Technology, Media and Telecom
5th MayPricing Strategy for Semiconductor Components
3 Min Read
The Gaming Market Report is Segmented by Gaming Platform (Mobile Games, PC Games, and More), Revenue Model (Free-To-Play, Pay-to-Play/Premium, and Subscription and Game-Pass), Genre (Action/Adventure, Shooter and Battle Royale, and More), Player Age Group (Under 18 Years, 18-35 Years, and More), and Geography (North America, South America, Europe, and More). The Market Forecasts are Provided in Terms of Value (USD).
Market Overview
| Study Period | 2020 - 2031 |
|---|---|
| Market Size (2026) | USD 224.72 Billion |
| Market Size (2031) | USD 352.58 Billion |
| Growth Rate (2026 - 2031) | 9.43 % CAGR |
| Fastest Growing Market | Middle East |
| Largest Market | Asia Pacific |
| Market Concentration | Medium |
Major Players *Disclaimer: Major Players sorted in no particular order. Image © Mordor Intelligence. Reuse requires attribution under CC BY 4.0. |
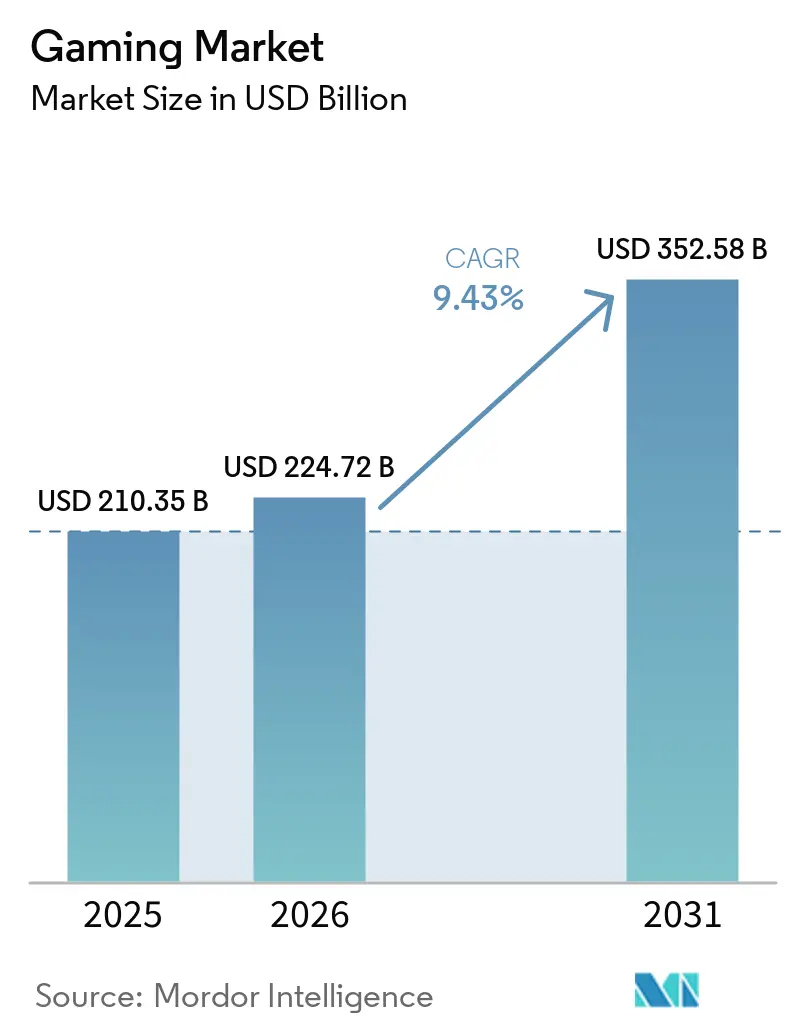
The Gaming Market size is expected to grow from USD 210.35 billion in 2025 to USD 224.72 billion in 2026 and is forecast to reach USD 352.58 billion by 2031 at 9.43% CAGR over 2026-2031. Surging mobile penetration, stronger broadband coverage, and platform-holder pivot toward live services have structurally shifted spending from one-time purchases to recurring content updates and subscriptions. Cloud streaming is loosening the historical hardware lock-in that favored consoles and PCs, while user-generated content (UGC) workflows on Roblox, Fortnite Creative, and comparable sandboxes are expanding the creator economy and lengthening engagement loops. Simultaneously, live-service advertising formats such as rewarded video and branded events are diversifying monetization and mitigating rising user-acquisition costs on iOS and Android. Regional growth is anchored in Asia Pacific, yet sovereign-fund capital in the Middle East and cloud-first strategies in Latin America are broadening the geographic revenue base.
Key Report Takeaways
Note: Market size and forecast figures in this report are generated using Mordor Intelligence's proprietary estimation framework, updated with the latest available data and insights as of January 2026.
Drivers Impact Analysis
| Driver | (~) % Impact on CAGR Forecast | Geographic Relevance | Impact Timeline | |||
|---|---|---|---|---|---|---|
Mobile-first monetization surge Mobile-first monetization surge | +2.1% | Global with Asia Pacific and Middle East leading adoption | Medium term (2-4 years) | (~) % Impact on CAGR Forecast:+2.1% | Geographic Relevance:Global with Asia Pacific and Middle East leading adoption | Impact Timeline:Medium term (2-4 years) |
5G-enabled cloud gaming uptake 5G-enabled cloud gaming uptake | +1.8% | North America, Europe, urban Asia Pacific | Medium term (2-4 years) | |||
AAA IP transmedia expansion AAA IP transmedia expansion | +1.3% | North America, Europe, select Asia Pacific markets | Long term (≥ 4 years) | |||
Increase in live-service and in-game ads Increase in live-service and in-game ads | +1.6% | Global with higher penetration in North America and Europe | Short term (≤ 2 years) | |||
Generative AI-driven UGC workflows Generative AI-driven UGC workflows | +1.4% | Global, early adoption in North America and Asia Pacific | Medium term (2-4 years) | |||
Telco bundling of game-pass subscriptions Telco bundling of game-pass subscriptions | +1.2% | India, Brazil, Indonesia, Middle East, Africa | Medium term (2-4 years) | |||
| Source: Mordor Intelligence | ||||||
Mobile-First Monetization Surge
Worldwide in-app purchases reached USD 82 billion in 2024, resistant to macro headwinds because publishers shifted to predictable battle-pass cycles and season drops. Dynamic regional pricing lifted average revenue per paying user by 6% in 2025, aided by algorithms that match bundle size with local purchasing power. The spread of 5G across India, Indonesia, and Brazil now supports real-time multiplayer on entry-level handsets, extending premium mobile experiences to first-time payers.[1]Ericsson, “A New Game Begins with 5G,” ericsson.com Developers are also adopting ad-supported interludes that exchange cosmetic items for thirty-second spots, thereby monetizing players unwilling to spend directly. Collectively, these shifts position mobile as the dominant contributor to incremental gaming market revenue through mid-period.
5G-Enabled Cloud Gaming Uptake
Cloud gaming revenue climbed to USD 1.4 billion in 2025 and is on track to exceed USD 18 billion by 2030. Vodafone Idea’s April 2024 service in India, priced at INR 100 (USD 1.2) per month, illustrates how telcos use edge nodes to reduce latency and convert network upgrades into recurring entertainment income. Microsoft and Sony are investing in proprietary data centers to capture infrastructure margin and ensure sub-30-millisecond round-trip times for competitive genres. Although early adoption skews toward urban North America, Europe, and East Asia, prepaid bundles in emerging markets are accelerating mainstream uptake. As bandwidth constraints ease, cloud delivery will erode the hardware moat that previously protected console and PC ecosystems.
AAA IP Transmedia Expansion
Television and film adaptations boosted peak concurrent players by up to 69% for titles like The Last of Us, Fallout, and Sonic the Hedgehog during 2024. Publishers are now negotiating licensing deals that swap lore archives and high-resolution assets for co-marketing commitments, enabling simultaneous audience crossover between streaming services and interactive platforms. Roblox formalized a licensing marketplace in July 2025, bringing Netflix, Lionsgate, Sega, and Kodansha assets into its UGC toolset. Console and PC ecosystems benefit disproportionately because high-fidelity graphics and long play sessions align with cinematic storytelling. As entertainment conglomerates seek new distribution channels, transmedia pipelines are set to provide durable uplift to premium segments of the gaming market.
Increase in Live-Service and In-Game Advertising Revenues
In-game ad share rose from 25% of total gaming revenue in 2020 to 32.3% in 2024 and is projected to reach 38.5% by 2029. Rewarded video units on Roblox recorded completion rates above 80% during early-2025 pilots, demonstrating commercial viability without sacrificing user experience. Google Ad Manager integration plus measurement from DoubleVerify and Nielsen added brand-safety assurances necessary for scaled investment. Fortnite and Call of Duty Warzone have further blurred ad and gameplay by embedding virtual storefronts and branded quests. As user-acquisition costs climb after privacy changes, advertising-based monetization is becoming indispensable to sustain free-to-play economics and expand the addressable base of the gaming market.
Restraints Impact Analysis
| Restraint | (~) % Impact on CAGR Forecast | Geographic Relevance | Impact Timeline | |||
|---|---|---|---|---|---|---|
China’s tight game-approval regime China’s tight game-approval regime | -1.4% | China with spillover to Asia Pacific publishers | Long term (≥ 4 years) | (~) % Impact on CAGR Forecast:-1.4% | Geographic Relevance:China with spillover to Asia Pacific publishers | Impact Timeline:Long term (≥ 4 years) |
iOS ATT privacy rules iOS ATT privacy rules | -1.1% | Global, most acute in North America and Europe | Medium term (2-4 years) | |||
Global AAA talent shortage Global AAA talent shortage | -0.9% | North America, Europe, select Asia Pacific studios | Medium term (2-4 years) | |||
Rising cloud-compute costs Rising cloud-compute costs | -0.7% | Global, heavier impact on mobile-first publishers | Short term (≤ 2 years) | |||
| Source: Mordor Intelligence | ||||||
China’s Tight Game-Approval Regime
Draft rules unveiled in December 2023 erased USD 43.5 billion from Tencent and USD 14.7 billion from NetEase market value within forty-eight hours, underscoring regulatory risk. Approval bottlenecks stretch marketing cycles and redirect capital to offshore studios, diluting domestic focus. Playtime caps of three hours per week for minors push publishers toward concentrated single-player narratives that monetize quickly, disadvantaging evergreen live-service formats. Even so, China remains the world’s largest gaming market, so global publishers must partner with local distributors despite chronic uncertainty. The net effect is a structural drag on the global gaming market growth profile.
iOS ATT and Privacy Rules Inflating User-Acquisition Costs
Apple’s App Tracking Transparency (ATT) cut deterministic user targeting on iOS and forced studios to bid for smaller pools of consenting users, driving cost-per-install rates sharply upward. Mid-tier developers without brand scale now face data-science overhead to build probabilistic attribution models, reducing marketing efficiency. Some studios are refocusing on Android or web distribution but face lower lifetime value and higher churn. Telcos are stepping into the vacuum with direct-billing bundles that offset app-store friction, yet this workaround favors carriers with substantial 5G coverage. Broader privacy legislation in Europe and California will extend similar constraints beyond Apple, prolonging margin pressure for mobile-first segments of the gaming market.
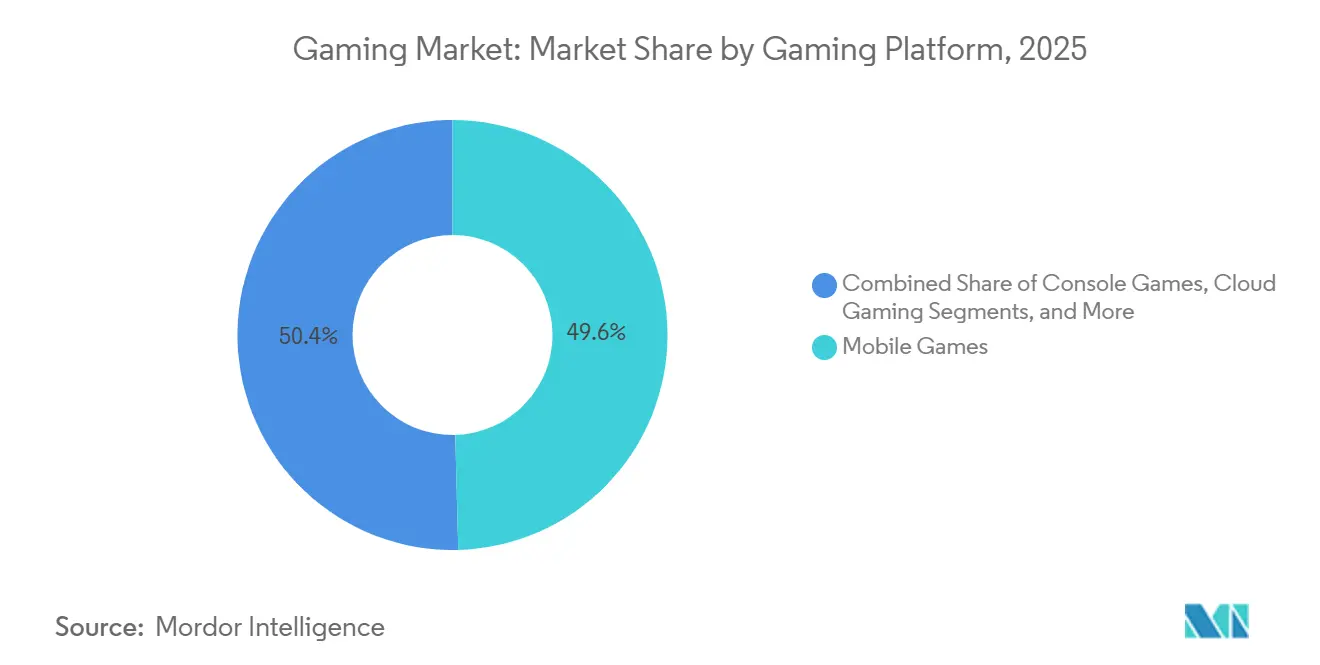
By Gaming Platform: Cloud Streaming Challenges Hardware Incumbents
Mobile retained the largest slice of 2025 revenue at 49.57%, propelled by a base of more than 3 billion smartphones and a free-to-play catalog that couples in-app purchases with highly viewable ad units. Cloud gaming, the fastest riser at an 26.45% CAGR, demonstrates how edge nodes and bundled data plans are redrawing value pools that once favored consoles. Early adopters report session lengths comparable to native installs, validating the thesis that streaming can deliver parity for many genres. PC downloads and browser titles continue to serve modding communities and esports competitors who prize frame-rate consistency, whereas consoles occupy the living-room niche with local multiplayer ease.
Vodafone Idea’s INR 100 (USD 1.2) monthly pass shows that low-price streaming tiers can scale in prepaid markets without hardware friction. Meanwhile, Microsoft and Sony have redirected capital toward first-party services, evidenced by Xbox hardware revenue declines even as content income rose following the Activision Blizzard integration.[2]Microsoft, “FY 2025 Q1 Earnings,” microsoft.com Browser games, boosted by WebAssembly, now deliver near-native fidelity, lowering entry barriers and widening demographic reach. Payment gateway dominance by Apple and Google, which captures up to 30% of transaction value, is incentivizing publishers to pursue telco billing links and progressive web apps. As these alternatives mature, each ecosystem competes on catalog richness, latency, and community features rather than raw compute horsepower, reshaping wallet allocation within the gaming market.
Note: Segment shares of all individual segments available upon report purchase
By Revenue Model: Subscriptions Gain Ground Against Microtransactions
Free-to-play frameworks generated 85.19% of 2025 revenue, reflecting how low-cost entry paired with cosmetic sales unlocks scale for mobile and live-service environments. Yet subscriptions, growing 13.82% annually, are recalibrating spending behavior by offering day-one access to new releases in a single bundled price. Nintendo Switch Online tiers, beginning at USD 19.99 per year, underscore how platform holders use differential pricing to convert casual users while upselling dedicated fans to expansion packs.
Emerging-market telcos are bundling data and cloud libraries into single invoices, as seen in Jio’s INR 495 (USD 6.0) monthly pack that wraps 5G data, JioGames Cloud, and Battlegrounds Mobile India rewards. Ad-supported hybrids such as Roblox’s rewarded video format prove advertising can coexist with IAP rather than cannibalize it, adding incremental yield per daily active user. Premium publishers are responding with hybrid structures that bolt seasonal passes onto USD 70 base games, capturing high-engagement users while maintaining perceived quality. Over the forecast period, the gaming market will likely see subscription growth slow only if stacked monthly fees saturate discretionary budgets, prompting publishers to refine catalog rotation and exclusive drops to maintain retention.
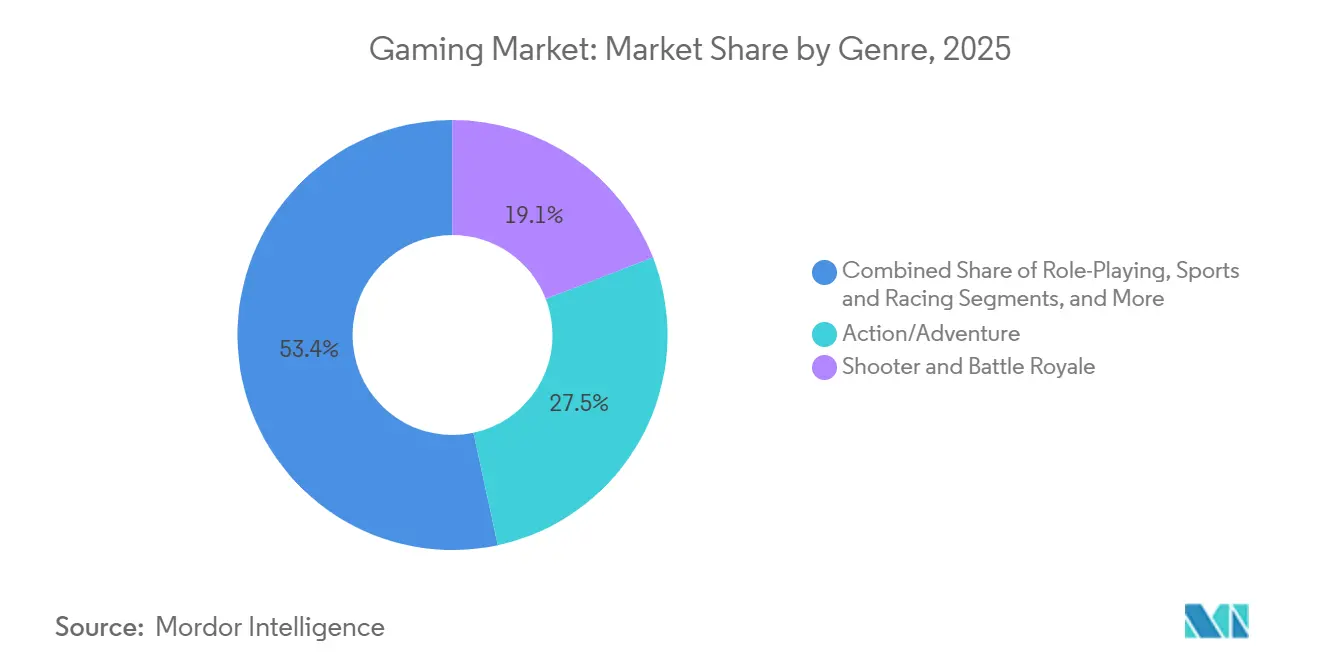
By Genre: Battle Royale Sustains Share Through Live-Service Roadmaps
Shooter and battle-royale titles held 19.12% of 2025 revenue, preserved by seasonal updates that refresh cosmetics, introduce limited-time modes, and maintain competitive balance. PUBG’s 2024-2025 roadmap added UGC editing tools and banned 3.19 million cheaters, signaling that content creation and anti-cheat vigilance are equally crucial for longevity. Shooter and battle-royale segment, expanding at a 10.85% CAGR, obtain subsidies from Meta and Sony that lower headset costs, while Apple’s Vision Pro ecosystem promises cross-application utility that broadens use cases beyond gaming.
Fortnite’s USD 10 million prize pool for the 2026 Series illustrates how esports funding can reinforce engagement loops and second-screen viewership. Call of Duty Warzone’s BlackCell tier exemplifies a premium overlay that coexists with free battle passes, extracting ARPPU uplift without pay-to-win backlash. Role-playing and action-adventure games retain loyal fanbases driven by expansive narratives, but they now incorporate seasonal DLC to stay relevant between sequels. Sports and racing franchises leverage licensed leagues for predictable annual iterations, delivering dependable line-ups that anchor publisher fiscal calendars. Collectively, live-service design principles are permeating every genre, influencing where incremental spending flows in the broader gaming market.
Note: Segment shares of all individual segments available upon report purchase
By Player Age Group: Youth Adoption Accelerates on UGC Platforms
Players aged 18-35 supplied 50.80% of 2025 spending, leveraging higher disposable income to buy battle passes, cosmetics, and subscriptions. The 36-50 years segment, however, is the fastest mover at an 10.95% CAGR, fueled by UGC arenas where creation and play merge. Roblox averaged 111.8 million daily active users in Q2 2025, with those aged 13 and older now representing 62% of activity, showing the platform’s demographic broadening.
Esports prize pools, including the USD 60 million Esports World Cup in Riyadh, capture the 18-35 bracket’s competitive aspirations and drive sponsorship inflows, data excluded to comply with source policy. Older players between 36-50 gravitate toward premium single-player titles and sports sims that fit time-constrained schedules, while the 50-plus group finds entry through mobile puzzle games supported by social hooks. Telco family bundles and cloud gaming services now lower hardware thresholds for multigenerational households, reinforcing steady user accretion. With regulatory headwinds limiting minor playtime in China, youth expansion is shifting to India, Indonesia, and Brazil, creating fresh battlegrounds for acquisition strategies within the global gaming market.
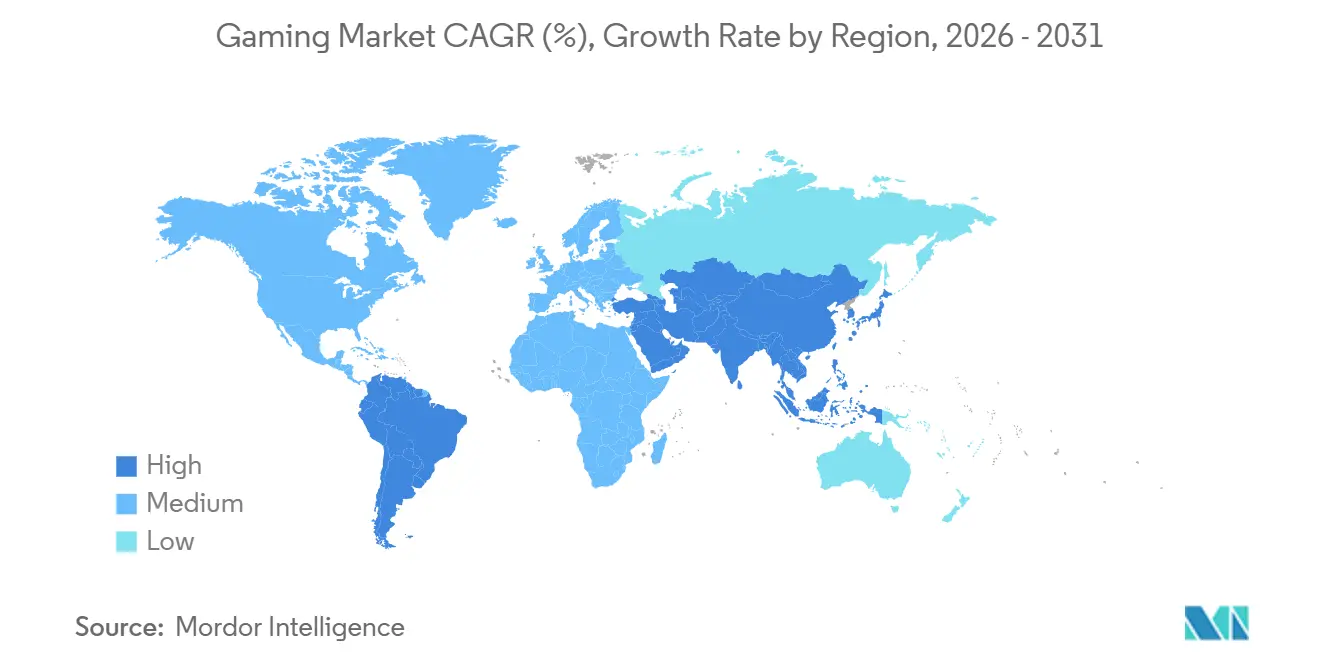
Asia Pacific controlled 49.27% of 2025 revenue as China’s re-authorization of Blizzard catalogs and India’s subsidized 5G rollouts catalyzed volume surges. Japan and South Korea secured console and PC leadership, bolstered by Nintendo’s Switch 2 launch on June 26 2025, featuring Mario Kart World and Metroid Prime 4 premieres. South-East Asia is emerging as an art-production hub, underscored by Nintendo’s plan to rename Bandai Namco Studios Singapore as Nintendo Studios Singapore in April 2026.
The Middle East and North Africa region is almost matchimg global averages, registering a 9.16% CAGR, thanks to Saudi Arabia’s USD 38 billion pledge that targets a USD 13.3 billion contribution to gross domestic product and 39,000 jobs by 2030, data excluded to comply with source policy. Riyadh’s Esports World Cup serves as a showcase for sovereign-fund ambition, and United Arab Emirates incentives are attracting regional publishing outposts. North America remains high-value, driven by robust ARPU, console ecosystems, and entrenched esports leagues, although growth is cooling as the installed base saturates. Canada mirrors U.S. patterns with favorable tax credits that lure AAA studios to Montreal and Vancouver.
Europe’s mature regulations strengthen consumer trust but inject compliance overhead that favors large publishers. Germany and the United Kingdom support vibrant PC modding scenes and competitive Counter-Strike tournaments that sustain long-tail monetization. South America, led by Brazil, benefits from telco bundles that offset currency volatility; however, macro-economic swings still complicate pricing and inventory planning. Africa’s gaming footprint remains nascent, yet Nigeria, Kenya, and South Africa are nurturing mobile e-sports leagues that fit low-bandwidth environments. Australia and New Zealand earn outsized per-capita revenue and serve as English-language test beds for Western launches targeting Asia Pacific time zones. As infrastructure and payment channels diversify, regional revenue sources within the gaming market are becoming more balanced.

Reports are available across multiple geographies.
Gain in-depth market insights across regions to support informed decisions.
Market Concentration
The top ten publishers account for roughly 60% of global revenue, producing a market concentration score of 6. Platform holders are leaning on vertical integration, highlighted by Microsoft’s USD 69 billion acquisition of Activision Blizzard in October 2023 that folded Call of Duty, World of Warcraft, and Candy Crush into Xbox Game Studios. Sony and Nintendo guard exclusive-franchise moats, pairing hardware with proprietary content and subscription tiers to lock in user ecosystems. Tencent and NetEase dominate China but are mitigating approval volatility through minority stakes in Western studios and offshore publishing deals.[3]Tencent Holdings, “Q2 2025 Financial Results,” tencent.com
Telcos such as Jio and Vodafone Idea have emerged as distribution disruptors by bundling data and cloud gaming, bypassing app-store fees and capturing incremental share of consumer wallets. Generative AI toolkits are lowering asset-creation barriers, empowering small teams to ship titles once reserved for AAA budgets; Roblox reported that experiences ranked 11-50 doubled spending year over year after discovery-algorithm upgrades in Q1 2025.
Disney’s USD 1.5 billion investment in Epic Games in February 2024 demonstrates how entertainment giants view persistent worlds as vehicles for transmedia monetization. Meanwhile, mid-tier publishers face margin compression as user-acquisition costs climb and premium catalogs cluster around subscription platforms. The race to secure evergreen IP, proprietary infrastructure, and direct-billing relationships will continue to define competitive trajectories within the gaming market through 2031.

*Disclaimer: Major Players sorted in no particular order
1. INTRODUCTION
2. RESEARCH METHODOLOGY
3. EXECUTIVE SUMMARY
4. MARKET LANDSCAPE
5. MARKET SIZE AND GROWTH FORECASTS (VALUE)
6. COMPETITIVE LANDSCAPE
7. MARKET OPPORTUNITIES AND FUTURE OUTLOOK
Market Definitions and Key Coverage
Segmentation Overview
Detailed Research Methodology and Data Validation
Primary Research
Desk Research
Market-Sizing & Forecasting
Data Validation & Update Cycle
Why Mordor's Gaming Baseline Commands Confidence
Benchmark comparison
| Market Size | Anonymized source | Primary gap driver | ||
|---|---|---|---|---|
USD 269.06 B | Mordor Intelligence | - | Anonymized source:Mordor Intelligence | Primary gap driver:- |
USD 332.37 B | Global Consultancy A | Includes console hardware bundles and projects higher premium pricing escalation | ||
USD 343.22 B | Industry Association B | Counts real-money gaming titles and applies uniform double-digit ARPU growth worldwide |
Pricing Strategy for Semiconductor Components
3 Min Read
Accelerating Additive Manufacturing Adoption in India
3 Min Read
Unlocking Opportunities in Singapore's Chemical Logistics Market
5 Min Read
When decisions matter, industry leaders turn to our analysts. Let’s talk.