Video Game Market Size and Share
Market Overview
| Study Period | 2020 - 2031 |
|---|---|
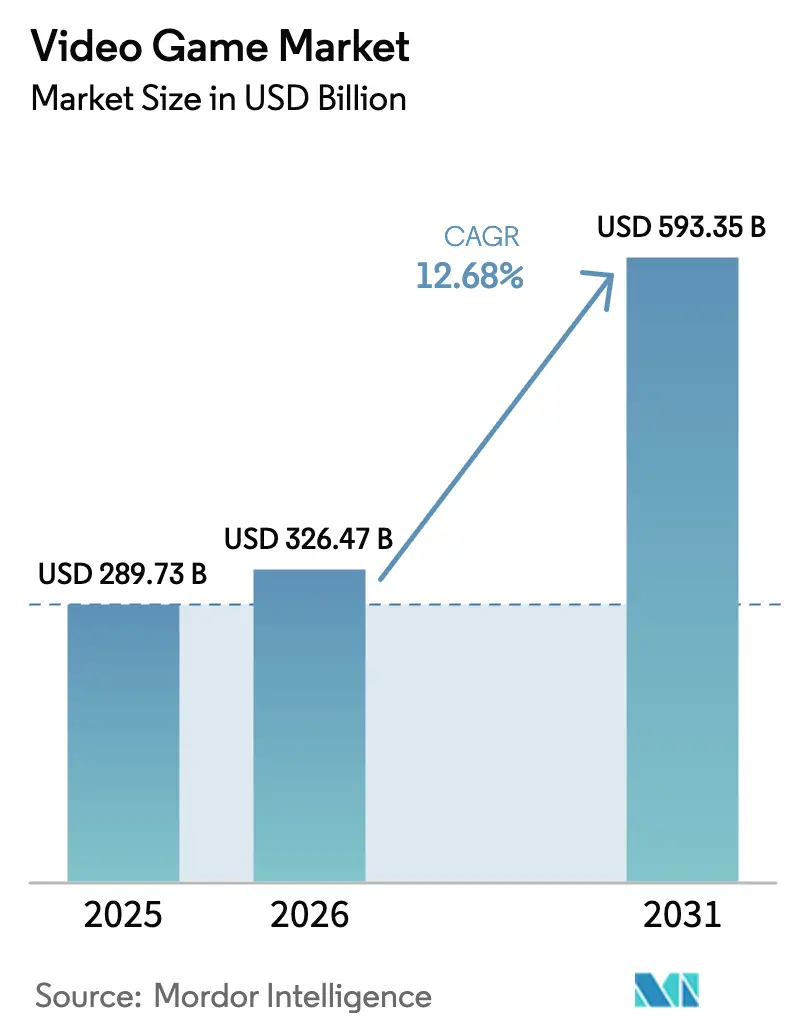
| Market Size (2026) | USD 326.47 Billion |
| Market Size (2031) | USD 593.35 Billion |
| Growth Rate (2026 - 2031) | 12.68% CAGR |
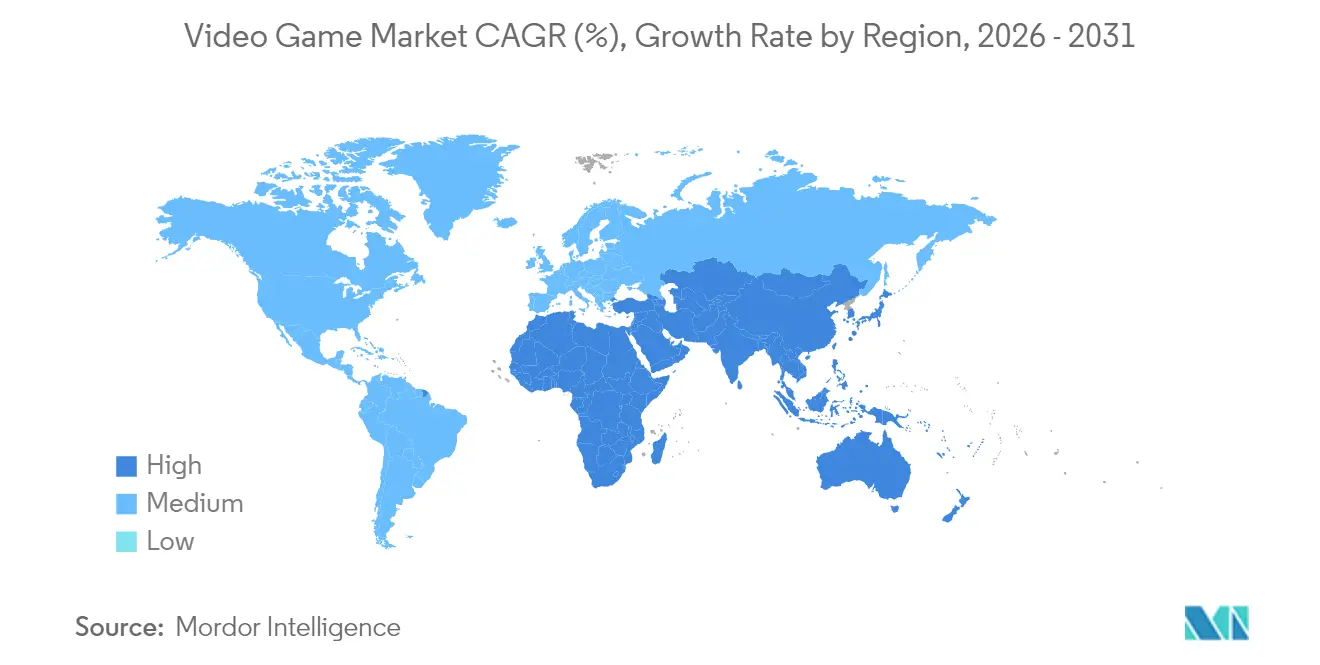
| Fastest Growing Market | Middle East and Africa |
| Largest Market | Asia Pacific |
| Market Concentration | Low |
Major Players *Disclaimer: Major Players sorted in no particular order Image © Mordor Intelligence. Reuse requires attribution under CC BY 4.0. | |
Video Game Market Analysis by Mordor Intelligence
The Video Game Market size is expected to increase from USD 289.73 billion in 2025 to USD 326.47 billion in 2026 and reach USD 593.35 billion by 2031, growing at a CAGR of 12.68% over 2026-2031.
Sustained smartphone adoption in emerging Asia, widening 5G coverage, and the migration of gamers toward flexible, cross-platform experiences underpin this growth. Subscription services such as Xbox Game Pass and PlayStation Plus continue to expand their user bases and raise average spending per player, while maturing cloud-gaming infrastructure lets high-fidelity titles stream to low-power devices. Generative-AI tooling shortens content-production cycles, enabling publishers to refresh live-service titles more often and extend product lifetimes. Nevertheless, tighter mobile-platform rules in the United States and European Union, alongside rising customer-acquisition costs, are compressing margins for publishers that rely heavily on mobile storefronts.
Key Report Takeaways
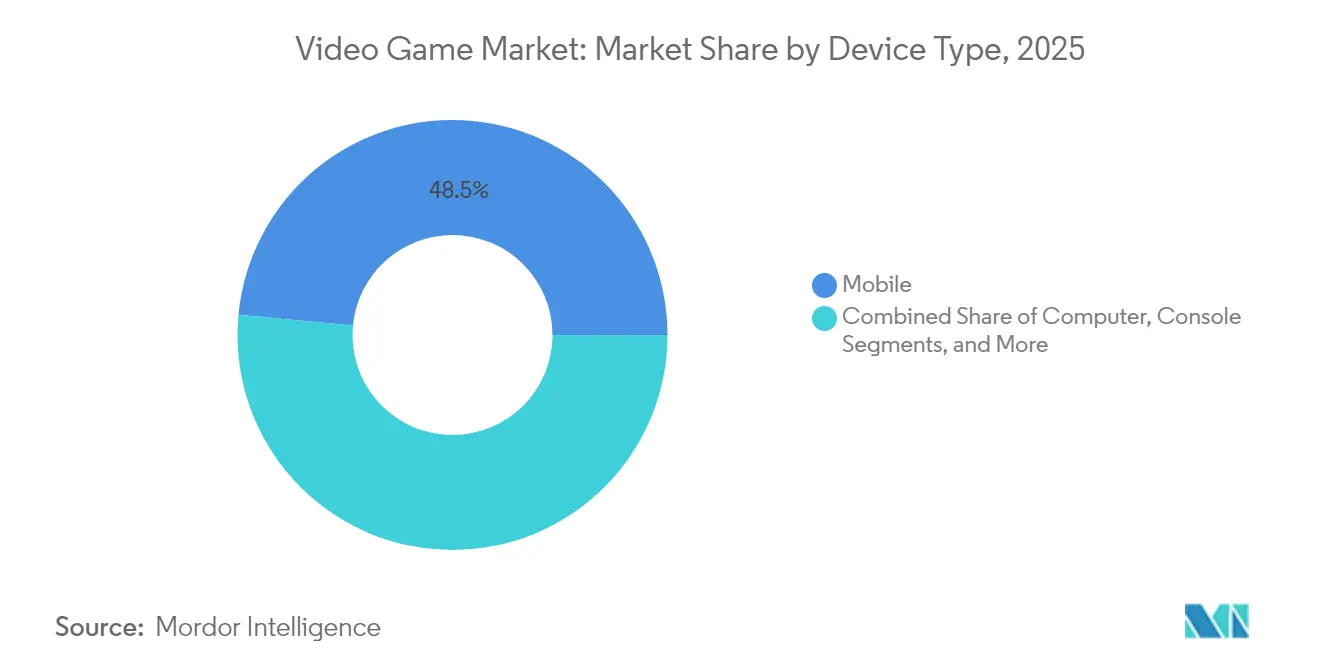
- By device type, mobile gaming held 48.50% of the video game industry share in 2025, while cloud-gaming devices are projected to expand at a 26.25% CAGR through 2031.
- By genre, action titles led with 24.60% revenue share in 2025; role-playing games are advancing at a 14.74% CAGR to 2031.
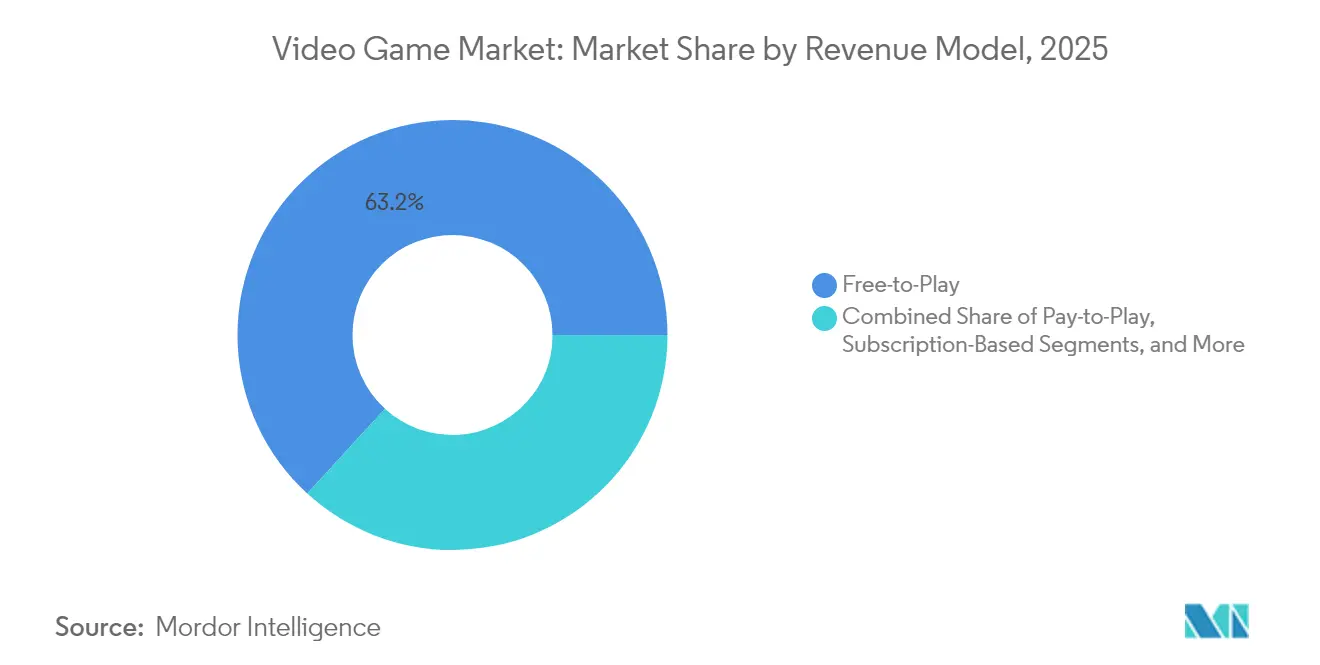
- By revenue model, free-to-play accounted for 63.20% share of the video game market size in 2025, whereas subscription platforms are rising at a 19.55% CAGR through 2031.
- By end-user, casual gamers represented 59.10% of the 2025 base; professional esports athletes show the fastest growth at an 17.48% CAGR.
- By geography, Asia-Pacific commanded 47.60% of 2025 revenue, while the Middle East & Africa region is set to post the highest 14.06% CAGR to 2031.
Note: Market size and forecast figures in this report are generated using Mordor Intelligence’s proprietary estimation framework, updated with the latest available data and insights as of 2026.
Global Video Game Market Trends and Insights
Drivers Impact Analysis*
| Driver | (~) % Impact on CAGR Forecast | Geographic Relevance | Impact Timeline |
|---|---|---|---|
| Mobile-first adoption in emerging Asia | +2.1% | Asia-Pacific and spillover to MEA | Medium term (2-4 years) |
| Subscription-platform proliferation | +1.8% | North America & Europe, expanding globally | Medium term (2-4 years) |
| 5G-enabled cloud-gaming infrastructure | +1.5% | North America, Europe, developed APAC | Long term (≥ 4 years) |
| Generative-AI content pipelines | +1.4% | Global, with early uptake in North America | Short term (≤ 2 years) |
| Cross-Platform Engine Upgrades Lowering Dev Costs | +1.2% | Global, with emphasis on indie developers | Short term (≤ 2 years) |
| Esports Franchise Valuations Driving Investment in Competitive Titles | +0.9% | Global, with concentration in China, US, South Korea | Medium term (2-4 years) |
| Source: Mordor Intelligence | |||
Mobile-First Gaming Adoption in Asia
Asia’s younger demographics and affordable smartphones have made the region the center of global mobile gaming revenue. China’s mobile segment generated USD 31.2 billion in 2024 after authorities approved 1,416 new domestic titles, while Indonesia recorded a USD 1.3 billion mobile spend on the back of free-to-play releases tailored to local habits. Competitive play is increasingly social; South Korea’s success with role-playing hits such as “Legend of Mushroom” illustrates how community engagement drives time-in-game. As Asian publishers refine regional payment solutions and localize narratives, publishers from outside the region must adopt a mobile-first mindset to sustain growth.
Subscription Services Redefine Monetization
Global spending on game-library, single-game, and platform-level subscriptions is projected to reach USD 19 billion in 2024 and exceed USD 27 billion by 2028, equal to 14% of total gaming expenditure. The appeal lies in perceived value: subscribers access extensive catalogs across console, PC, and cloud endpoints for a monthly fee. Early evidence indicates that these plans lift hardware sales and improve engagement without eroding premium-game revenue. Publishers benefit from steadier cash flows, while players face lower barriers to trying unfamiliar genres.
5G Accelerates Cloud-Gaming Uptake
The transition to standalone 5G networks is cutting latency to sub-20 milliseconds, enabling streamed gameplay that feels native. The cloud-gaming segment is forecast to climb from USD 6.91 billion in 2024 to USD 22.01 billion in 2028, a 33.6% CAGR. Operators in the Middle East, notably Jordan, are positioning new fibre-backed 5G nodes as catalysts for content-industry diversification [1]Kevin J. Murphy, “Leveraging 5G to Transform Jordan’s Gaming Industry to Achieve Global Dominance,” ericsson.com. Cloud access widens addressable audiences—players on modest handsets can stream titles that once demanded dedicated hardware.
Generative-AI Tools Shorten Production Cycles
Adoption of generative text-to-asset tooling is rising across art, audio, and non-player character scripting. Unity’s 2025 report notes a 36% share of studios experimenting with AI-assisted workflows, up from 31% one year earlier [2]Unity Technologies, “2025 Unity Gaming Report,” unity.com. While only 13% of surveyed developers expect AI to improve game quality in the long run, early users cite faster iteration and richer personalization of live-service updates. These efficiencies translate into shorter go-to-market timelines and more frequent content drops that keep existing players engaged.
Restraints Impact Analysis*
| Restraint | (~) % Impact on CAGR Forecast | Geographic Relevance | Impact Timeline |
|---|---|---|---|
| App-store fee regulation | −1.2% | United States, European Union | Short term (≤ 2 years) |
| Higher user-acquisition costs | −0.9% | Global, most acute in saturated markets | Medium term (2-4 years) |
| IP-Infringement Litigation Around User-Generated Content Mods | −0.7% | Global, with concentration in North America | Medium term (2-4 years) |
| Geopolitical Export Controls on Gaming GPUs | −0.5% | China, United States, with supply chain implications globally | Long term (≥5 yrs) |
| Source: Mordor Intelligence | |||
App-Store Rules Cut Into Margins
The EU Digital Markets Act and parallel US antitrust actions require platform owners to lower commissions and permit outside payment options. Apple’s March 2025 compliance filing reduces most in-app fees to 10% and unlocks side-loading in Europe [3]Apple Inc., “Apple’s DMA Compliance Report,” apple.com. In the near term, implementation expenses and uncertainty over alternative-store uptake compress mobile profit margins for traditional publishers. Over time, cheaper distribution paths could enhance developer economics, but benefits will not be evenly distributed.
User-Acquisition Costs Keep Climbing
The global average cost per install reached USD 5.11 on iOS and USD 4.61 on Android in 2024, according to mobile-marketing benchmarks. Blame falls on tighter privacy rules that limit ad-targeting precision, forcing marketers to raise bids. A rising share of studios now track lifetime-value-to-CAC ratios at or below 3:1, prompting heavier investment in retention mechanics such as live-ops events and battle passes. Smaller teams without deep wallets face tougher economics, nudging them toward niche genres or cross-promotional alliances.
*Our forecasts treat driver/restraint impacts as directional, not additive. The impact forecasts reflect baseline growth, mix effects, and variable interactions.
Segment Analysis
By Device Type: Cloud Traction Narrows Mobile Lead
Mobile gaming generated USD 140.53 billion in 2025, accounting for 48.50% of the video game market share. Console revenue followed at USD 56.2 billion, slightly ahead of PC’s USD 46.3 billion. Cloud-gaming services are the fastest-rising category; the segment’s video game industry size is projected to reach USD 24.68 billion by 2029 on a 26.25% CAGR. Wider 5G rollout and aggressive platform bundling are converting non-traditional gamers who do not own dedicated hardware.
Cloud’s momentum also influences hardware strategy. Device makers are releasing handheld streaming terminals that tether to home Wi-Fi or cellular networks, blurring lines between console and mobile experiences. Publishers hedge by supporting cross-progression so players can shift screens without losing achievements. As latency drops and data-center GPU density rises, the gap between local and streamed performance narrows, challenging the historical dominance of high-end consoles.


By Genre: Innovation Fuels Role-Playing Momentum
Action franchises retained a 24.60% revenue share in 2025, headlined by annualized blockbuster releases. Role-playing games, however, are accelerating with a 14.74% CAGR through 2031 as studios adapt deeper stories for mobile and cross-platform delivery. In Southeast Asia, strategy, simulation, and role-playing categories all posted double-digit download gains, underscoring regional appetite for complex mechanics.
Monetization dynamics also favor RPG creators. Gacha-style character pulls and battle-pass upgrades deliver consistent revenue, while user-generated mods extend shelf life. The cloud-streaming era further boosts high-fidelity RPGs that previously demanded powerful PCs. As AI-supported quest design matures, narrative branching is expected to deepen, enticing lapsed players back into long-running worlds.
By Revenue Model: Subscriptions Complement Free-to-Play
Free-to-play titles comprised 63.20% of 2025 spending, underpinned by in-game cosmetic and season-pass purchases. Subscription-based offerings represent the most rapid shift, rising at a 19.55% CAGR; their video game market size is forecast to cross USD 30.62 billion in 2029. Bundled libraries enhance perceived value for price-sensitive gamers, while developers receive steady, recurring revenue that eases budgeting for live-ops updates.
Hybrid models are emerging. Publishers often launch new titles into subscription catalogs for a limited window before reverting to standalone sales. This approach converts trial users to full purchases and preserves premium pricing. Platform holders, meanwhile, negotiate timed exclusives to differentiate their ecosystems, echoing the streaming-video playbook.
By End-User: Casual Base Funds Esports Upscale
Casual players accounted for 59.10% of the active base in 2025, attracted by accessible mobile controls and quick session lengths. In contrast, professional esports athletes represent a small but fast-growing cohort with an 17.48% CAGR to 2031. Prize pools, media rights, and sponsorship deals lift the segment’s video game industry size, while training academies and analytics platforms professionalize talent pipelines.
Brands increasingly view esports as a marketing channel toward Generation Z audiences unreachable by traditional media. Investments such as Saudi Arabia’s Savvy Games Group—backed by USD 37.7 billion for studio acquisitions and local infrastructure—illustrate state-level ambitions to capture this value chain. Concurrently, collegiate leagues in North America standardize pathways from amateur to professional competition.
Geography Analysis
Asia-Pacific retains leadership with 47.60% of global revenue in 2025, anchored by China’s robust ecosystem. China’s online-gaming sector is projected to climb from USD 71.07 billion in 2025 to USD 101.89 billion by 2030 on a 7.52% CAGR, with Tencent controlling roughly half of the domestic market. Japan and South Korea add depth through console and PC communities that emphasize high-spend, high-engagement genres. Regional publishers leverage locally relevant intellectual properties, creating cultural resonance that global firms sometimes struggle to replicate.
The Middle East & Africa region is the industry’s fastest-growing territory, set to expand at a 14.06% CAGR. Saudi Arabia expects its gaming sector to contribute USD 13 billion to GDP by 2030. Public-sector vehicles such as Savvy Games Group aim to attract international studios with tax incentives, regional e-sports arenas, and a labor-force-training pipeline. Across Africa, mobile accessibility drives nearly 90% of engagement, and the regional video game market size for mobile titles is on track to surpass USD 1.12 billion in 2025.
North America generated USD 46 billion in consumer spending during 2023, underscoring enduring console and PC loyalty. Hardware sales softened in late 2024, but PC and subscription revenues rose, signaling a pivot toward flexible content access models. Europe follows a similar digital-first trajectory; the UK market dipped 4.15% to GBP 4.55 billion (USD 3.37 billion) in 2025, yet mobile micro-transactions grew 2.45% to GBP 1.624 billion (USD 2.19 billion). The Digital Markets Act introduces alternative payment choices that could realign revenue flows toward publishers over the medium term.

Competitive Landscape
The console segment concentrates around three platform holders—Sony, Microsoft, and Nintendo—giving it a high entry barrier. Microsoft’s USD 68.7 billion acquisition of Activision Blizzard in 2022 vaulted the company to third place by gaming revenue and delivered evergreen franchises such as Call of Duty into Game Pass. Sony counters with timed exclusives from in-house studios and aggressive PlayStation Plus bundling, while Nintendo leverages proprietary IP and hybrid-console hardware to sustain differentiation.
Mobile remains relatively fragmented despite Tencent’s sizeable Asian dominance. Tencent’s 2024 purchase of a major European mobile developer for USD 1.2 billion expands overseas reach and offsets domestic regulatory risk. ByteDance’s entry through dedicated gaming divisions underscores the appeal of short-form content expertise applied to interactive formats. Supercell and Playtika use live-ops mastery and data-driven design to retain whales in competitive free-to-play genres.
Technology partnerships shape the emerging value chain. Microsoft’s USD 500 million cloud-infrastructure upgrade announced in April 2025 adds AI-assisted matchmaking and extends Xbox Cloud Gaming to 15 new markets. Unity’s latest engine enables developers to export simultaneously to mobile, PC, and mixed-reality headsets, and its 2025 report shows 40% of studios now prioritize multiplatform launches. Generative-asset toolchains reduce art-production bottlenecks for smaller teams, lowering the capital needed to compete against AAA incumbents.
Video Game Industry Leaders
Activision Blizzard Inc.
Apple Inc.
ByteDance
Electronic Arts Inc.
Supercell
- *Disclaimer: Major Players sorted in no particular order


Recent Industry Developments
- May 2025: Team Liquid’s valuation approached USD 500 million, demonstrating the commercial maturation of esports organizations.
- April 2025: Microsoft committed USD 500 million to expand Xbox Cloud Gaming into 15 new territories and integrate AI-driven matchmaking.
- March 2025: Apple’s Digital Markets Act compliance report detailed reduced commissions and alternative payment options for EU consumers.
- February 2025: Hasbro announced its “Playing to Win” strategy to broaden its consumer reach to 750 million by 2027 through digital games built on core franchises.


Research Methodology Framework and Report Scope
Market Definitions and Key Coverage
Our study defines the global video game market as every dollar earned from selling or subscribing to electronic games that deliver interactive audio-visual experiences on consoles, computers, mobiles, cloud streams, and emerging XR devices. Revenues span boxed and digital titles, live-service micro-transactions, downloadable content, and game-pass style subscriptions.
Hardware sales, advertising inventory, and regulated online gambling remain outside the frame.
We intentionally leave out pay-to-watch esports media rights and dedicated gaming hardware.
Segmentation Overview
- By Device Type
- Computer
- Mobile
- Console
- Cloud-Gaming Devices (Smart TVs, Sticks)
- By Genre
- Action
- Shooter
- Role-Playing
- Sports
- Adventure
- Others (Strategy, Simulation, Puzzle and Casual)
- By Revenue Model
- Free-to-Play
- Pay-to-Play (Premium)
- Subscription-Based
- In-Game Advertising
- By End-User
- Casual Gamers
- Hardcore / Competitive Gamers
- Professional Esports Athletes
- By Geography (Value)
- North America
- United States
- Canada
- Mexico
- South America
- Brazil
- Argentina
- Rest of South America
- Europe
- Germany
- United Kingdom
- France
- Italy
- Spain
- Rest of Europe
- Asia-Pacific
- China
- Japan
- South Korea
- India
- Rest of Asia-Pacific
- Middle East and Africa
- United Arab Emirates
- Saudi Arabia
- South Africa
- Rest of Middle East and Africa
- North America
Detailed Research Methodology and Data Validation
Primary Research
Our analysts interviewed publishers, mobile store operators, payment aggregators, esports league managers, and indie studios across Asia-Pacific, North America, Europe, and MENA. These conversations tested assumptions on average selling prices, free-to-play conversion, and content launch cadence, ensuring every model input mirrored current market sentiment.
Desk Research
We began by mapping household entertainment outlays, console import-export flows, and gamer census counts from public bodies such as the Entertainment Software Association, International Telecommunication Union, UN Comtrade, and Eurostat. Company filings, investor presentations, and quarterly transcripts provided price ranges, platform mix, and genre shift signals. Our team then mined open developer portals, patent registers, and curated streams within D&B Hoovers and Dow Jones Factiva to capture emerging monetization patterns and studio pipeline health. This list is illustrative, and many additional open datasets informed our groundwork.
Market-Sizing & Forecasting
We applied a top-down build anchored on consumer spend series and platform penetration, then cross-checked it with bottom-up snapshots from publisher revenues and sampled ASP-by-active-user calculations. Key variables include smartphone install base, console replacement cycles, broadband latency, cloud-GPU pricing, and regional play-time regulations. Forecasts blend multivariate regression with scenario analysis to capture currency shifts and blockbuster release slates. Where data gaps surfaced, we bridged them with analog geography ratios that experts validated.
Data Validation & Update Cycle
Our analysts benchmark every output against independent trackers, investigate variances, and submit the model for multi-level review before sign-off. Reports refresh annually, with interim revisions triggered by major acquisitions, regulatory rulings, or currency swings. A final pre-publication sweep guarantees subscribers receive the latest view.
Why Mordor's Video Game Baseline Commands Reliability
Published market values often diverge because firms select different revenue buckets, refresh cadences, and exchange rates. Our disciplined scope, yearly update rhythm, and dual-lens modeling narrow those spreads, giving decision-makers a stable point of reference.
Key gap drivers include whether mobile ad spend is counted, how free-to-play micro-transactions are grossed, and the treatment of cloud gaming subscriptions, while some studies also roll hardware into software or freeze data for several years.
Benchmark comparison
| Market Size | Anonymized source | Primary gap driver |
|---|---|---|
| USD 289.73 B (2025) | Mordor Intelligence | - |
| USD 298.98 B (2024) | Global Consultancy A | Includes accessories and VR hardware |
| USD 274.63 B (2024) | Regional Consultancy B | Excludes cloud gaming subscriptions, older refresh cycle |
| USD 199.74 B (2022) | Trade Publisher C | Counts paid downloads only, omits in-game spending |
This comparison highlights that Mordor Intelligence delivers a balanced, transparent baseline grounded in clearly stated variables and repeatable steps, making our numbers the dependable choice for strategic planning.


Key Questions Answered in the Report
How big is the Video Game Industry?
The Video Game Market size is expected to reach USD 326.47 billion in 2026 and grow at a CAGR of 12.68% to reach USD 593.35 billion by 2031.
What is the current Video Game Market size?
In 2026, the Video Game Industry size is expected to reach USD 326.47 billion.
Who are the key players in Video Game Industry?
Activision Blizzard Inc., Apple Inc., ByteDance Electronic Arts Inc., Supercell are the major companies operating in the Video Game Market.
Which is the fastest growing region in Video Game Market?
Middle East and Africa is estimated to grow at the highest CAGR over the forecast period (2026-2031).
Which region has the biggest share in Video Game Industry?
In 2025, the Asia Pacific accounts for the largest market share in Video Game Market.
What years does this Video Game Market cover, and what was the market size in 2025?
In 2025, the Video Game Market size was estimated at USD 326.47 billion. The report covers the Video Game Market historical market size for years: 2019, 2020, 2021, 2022, 2023 and 2024. The report also forecasts the Video Game Market size for years: 2026, 2027, 2028, 2029, 2030 and 2031.
Page last updated on:


