Total Rewards Platform Market Size and Share
Market Overview
| Study Period | 2020 - 2031 |
|---|---|
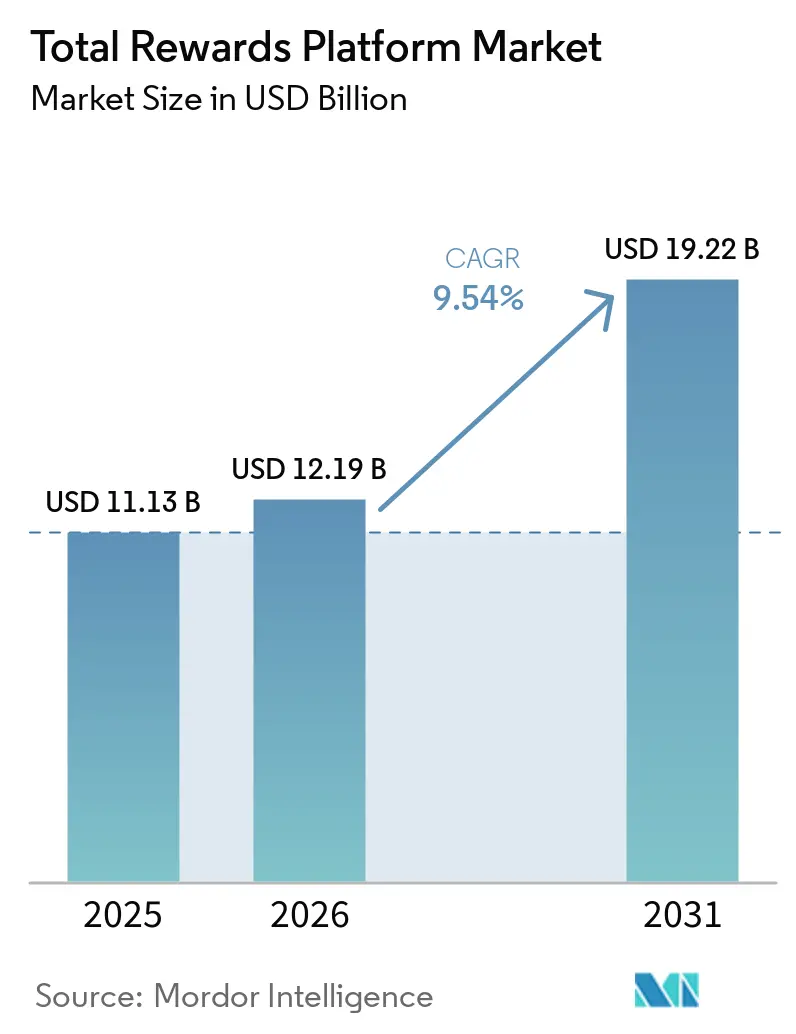
| Market Size (2026) | USD 12.19 Billion |
| Market Size (2031) | USD 19.22 Billion |
| Growth Rate (2026 - 2031) | 9.54% CAGR |
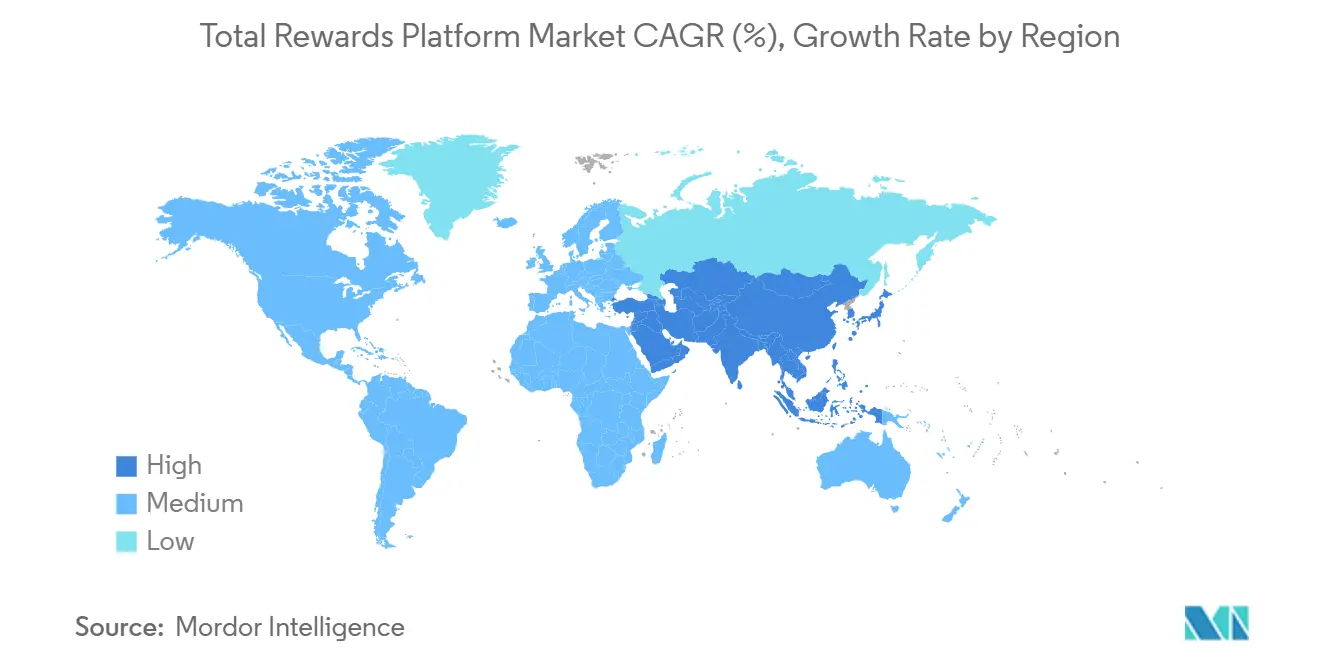
| Fastest Growing Market | Asia-Pacific |
| Largest Market | North America |
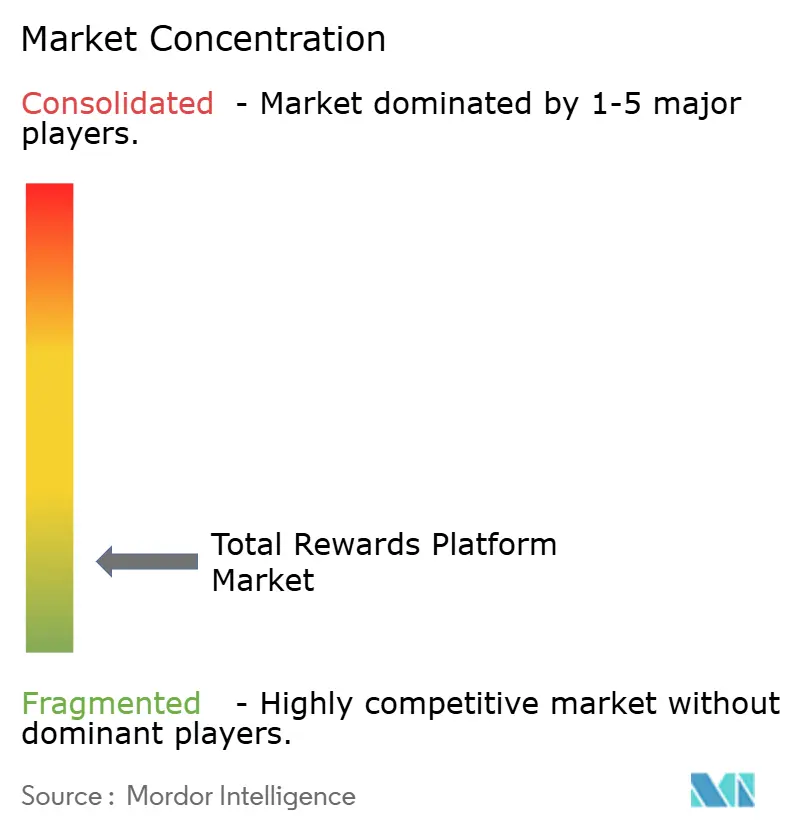
| Market Concentration | Low |
Major Players *Disclaimer: Major Players sorted in no particular order Image © Mordor Intelligence. Reuse requires attribution under CC BY 4.0. | |
Total Rewards Platform Market Analysis by Mordor Intelligence
The total rewards platform market size was valued at USD 11.13 billion in 2025 and is projected to reach USD 19.22 billion by 2031, at a CAGR of 9.54% from 2026 to 2031. Growth is structural rather than cyclical because regulation, workforce dispersion, and personalization needs are all rising simultaneously. Pay transparency rules, distributed teams, and AI-enabled decision support are pushing employers away from separate recognition, compensation, and benefits tools and toward unified platforms that can manage governance and execution in one place. The 2026 compliance timetable in Europe is bringing forward buying decisions, while cloud renewal windows are reopening adjacent rewards and payroll contracts that had remained in place for years. Smaller employers and healthcare organizations are also entering the category more quickly because SaaS pricing, modular deployment, and integrated lifestyle spending account capabilities reduce the operational burden of running multiple vendors. At the same time, native bundling by HCM suite vendors and stricter expectations around AI explainability are making platform design, auditability, and data controls more important in vendor selection.
Key Report Takeaways
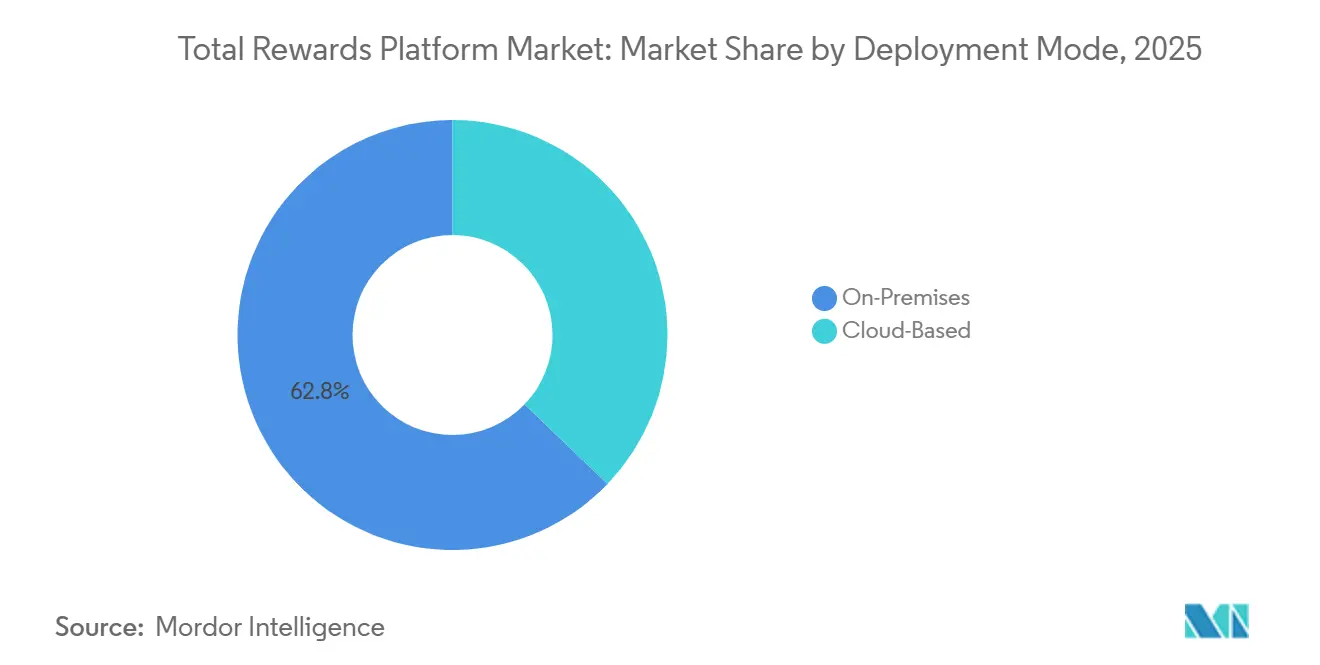
- By deployment mode, on-premises held 62.81% share in 2025, while cloud-based deployment is forecast to expand at a 12.36% CAGR through 2031.
- By platform module, recognition and rewards accounted for 36.41% share in 2025, while people analytics and pay equity is projected to grow at an 11.21% CAGR through 2031.
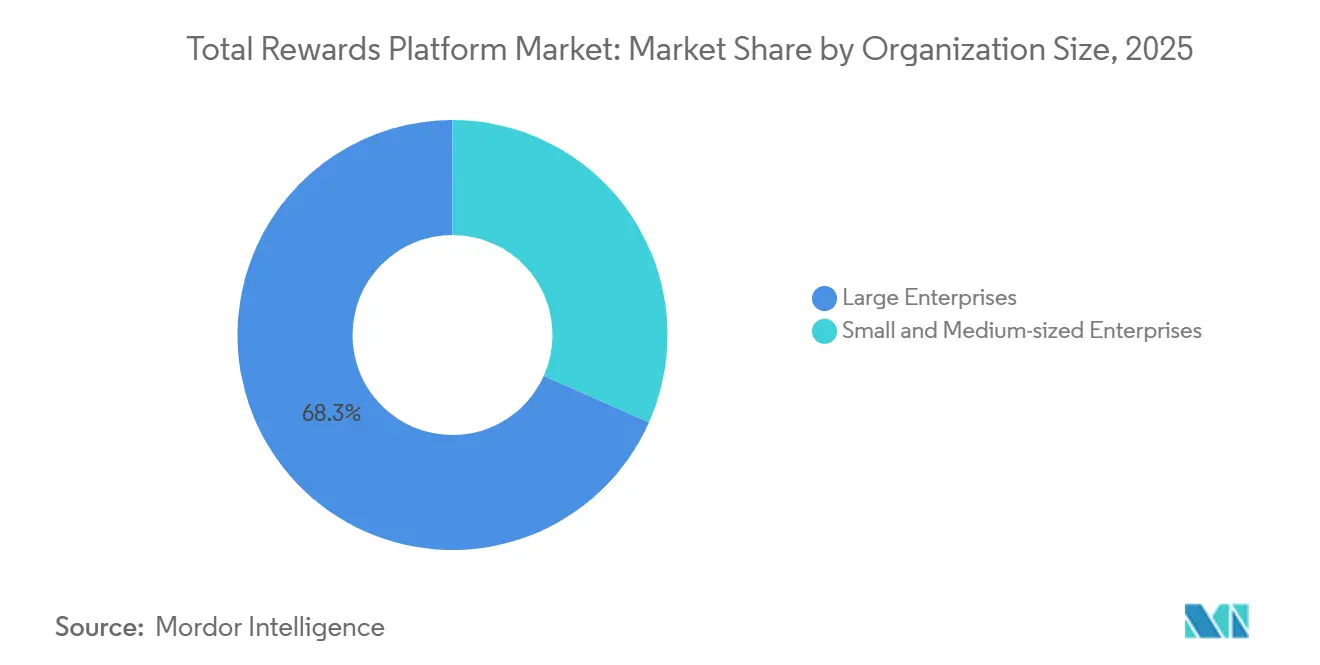
- By organization size, large enterprises captured 68.34% share in 2025, while small and medium-sized enterprises are set to advance at a 12.05% CAGR through 2031.
- By end-user industry, IT and telecommunications represented 38.76% share in 2025, while healthcare and life sciences is forecast to record a 10.81% CAGR through 2031.
- By geography, North America held 35.49% share in 2025, while Asia-Pacific is projected to expand at an 11.67% CAGR through 2031.
Note: Market size and forecast figures in this report are generated using Mordor Intelligence’s proprietary estimation framework, updated with the latest available data and insights as of January 2026.
Global Total Rewards Platform Market Trends and Insights
Drivers Impact Analysis*
| Driver | (~) % Impact on CAGR Forecast | Geographic Relevance | Impact Timeline |
|---|---|---|---|
| Rising Pay Transparency and Pay Equity Compliance Demand | +2.1% | Global, with concentrated near-term impact in Europe, North America, and select Asia-Pacific jurisdictions | Short term (≤ 2 years) |
| Artificial Intelligence-Driven Personalization and Decision Support Across Rewards, Benefits, and Compensation | +1.9% | Global, with highest velocity in North America, followed by Europe and Asia-Pacific core markets | Medium term (2-4 years) |
| Cloud Migration of HR and Rewards Workflows | +1.7% | Global, with strongest momentum in Asia-Pacific emerging markets and the European mid-market | Medium term (2-4 years) |
| Hybrid and Distributed Workforces Increasing Need for Digital Recognition and Self-Service Rewards Access | +1.4% | Global, with particular intensity in North America and Western Europe | Short term (≤ 2 years) |
| Shift From Fragmented Point Tools to Unified Total Rewards Visibility Layers | +1.0% | Global, amplified in large enterprises and regulated sectors | Medium term (2-4 years) |
| Lifestyle Spending Accounts and Flexible Benefits Wallets Expanding Platform Scope | +0.8% | North America and Europe, with early adoption in core Asia-Pacific and Middle East and Africa markets | Long term (≥ 4 years) |
| Source: Mordor Intelligence | |||
Rising Pay Transparency and Pay Equity Compliance Demand
Pay transparency legislation has moved from a reputational topic to an operating requirement, pushing direct investment across the total rewards platform market. As of April 2026, 4 EU member states had partial transpositions in force, and 9 more had published draft legislation, yet employers with 150 or more staff had to capture 2026 gender pay data for reporting due in June 2027. At least 7 member states, including France, Denmark, and Lithuania, were also moving beyond the Directive's minimum terms by lowering thresholds or widening employer obligations. That variation is pushing multinational employers toward pay equity modules that can apply country-specific logic, rather than relying on HRIS exports and manual reporting workarounds. In the United States, California's January 1, 2026, requirement to include equity awards in pay equity analysis has added another layer of compensation data management that basic payroll systems do not handle well. This is making compliance-led procurement more urgent in Europe and North America and is strengthening near-term demand in the total rewards platform market.
Artificial Intelligence-Driven Personalization and Decision Support Across Rewards, Benefits, and Compensation
AI is having its clearest effect in automated pay equity monitoring, personalized benefits guidance, and scenario-based compensation planning in the total rewards platform market. Mercer stated that AI can absorb 52% of transactional rewards workloads, including routine inquiries and standard benefits administration tasks. Large employers are also using agentic systems that test merit increase proposals against market benchmarks, internal equity data, and performance trends simultaneously, with adoption reaching 48% in 2026. Organizations using AI-assisted merit tools are shortening annual review cycles from 8-12 weeks to 2 weeks. The same systems create governance risk because biased historical pay data can continue to flow into future recommendations if testing controls are weak.[1]Vismay Gada, “Top 6 Trends in Compensation Management | How to Prepare,” beqom, beqom.comThat is creating fresh demand for explainable AI tools that can justify reward decisions in plain language and support human oversight across the total rewards platform market.
Cloud Migration of HR and Rewards Workflows
Cloud migration is moving from a gradual IT program to a time-based operating need in the total rewards platform market. SAP's phased end of support for on-premises ECC payroll by 2030, along with the expiry of compatibility pack support in December 2025, is pushing a clear migration wave among long-standing on-premises users. When a large employer shifts core HCM to SAP SuccessFactors, Workday, or Oracle Cloud, the same budget cycle often reopens adjacent contracts for rewards and benefits tools. Wipro's 2025 move to Oracle Cloud Infrastructure reduced payroll processing time from more than 70 minutes to 29 minutes across 230,000 employees in 65 countries. Cloud-hosted global payroll solutions now include compliance logic for more than 140 countries as a standard feature, removing a major localization barrier for cross-border rewards programs. This is why cloud deployment is advancing fastest as legacy contracts come up for renewal across the total rewards platform market.
Hybrid and Distributed Workforces Increasing Need for Digital Recognition and Self-Service Rewards Access
Hybrid and distributed work patterns are turning recognition into a retention tool across the total rewards platform market. Global productivity losses tied to disengaged hybrid workers were estimated at USD 8.9 trillion, making recognition spending easier to defend within HR budgets. The same source stated that 42% of managers admit to proximity bias, which means employees who are seen in person are more likely to be recognized. Mobile-first self-service tools are also becoming essential because 80% of the global workforce is deskless or frontline and does not rely on desktop access every day. Vendors are responding with apps that support local-currency catalogs, broader language coverage, and access through channels such as Slack, Microsoft Teams, kiosks, and mobile devices. This shift is expanding the role of digital recognition from culture support to daily workforce infrastructure in the total rewards platform market.
Restraints Impact Analysis*
| Restraint | (~) % Impact on CAGR Forecast | Geographic Relevance | Impact Timeline |
|---|---|---|---|
| Legacy HR, Payroll, Carrier, and Collaboration-System Integration Complexity | -1.4% | Global, most acute in large enterprises with multi-decade legacy estates in North America and Europe | Medium term (2-4 years) |
| Data Privacy, Artificial Intelligence Governance, and Cross-Border Compliance Burden | -1.2% | Global, highest in Europe and in markets with emerging data localization rules | Long term (≥ 4 years) |
| Multicountry Tax Treatment and Reward-Fulfillment Localization Complexity | -0.9% | Asia-Pacific, Middle East and Africa, and South America, with spillover to multinational employers globally | Long term (≥ 4 years) |
| Native Human Capital Management Suite Bundling and Pure-Play Displacement Risk | -0.7% | Global, concentrated in large enterprise accounts during HCM renewal cycles | Medium term (2-4 years) |
| Source: Mordor Intelligence | |||
Legacy HR, Payroll, Carrier, and Collaboration-System Integration Complexity
Integration friction remains the clearest operating barrier to adoption in the total rewards platform market. Bindbee stated that 68% of organizations run disconnected HR platforms, leading to 23% more administrative time and 31% higher error rates than in unified environments. Lift HCM showed that a 150-employee organization can spend 51 hours each month on duplicate administrative work, which adds USD 21,420 in yearly overhead. The larger challenge is ongoing maintenance, because organizations with 20 or more custom integrations can spend more than USD 500,000 each year and direct 60%-70% of integration IT spend to upkeep. Integration timelines still run 1-3 weeks for Workday, 2-4 weeks for SAP SuccessFactors, and 4-8 weeks for proprietary HRIS estates, due to security reviews and custom field mapping that slow progress. This burden falls hardest on mid-market employers without dedicated integration teams, slowing platform consolidation in the total rewards platform market.
Data Privacy, Artificial Intelligence Governance, and Cross-Border Compliance Burden
Data privacy and AI governance are creating a second layer of friction in the total rewards platform market. HIPAA fines tied to willful neglect of employee health benefits data can reach USD 2.2 million per year, while GDPR penalties can reach 4% of global annual turnover. The burden rises further when AI-generated pay recommendations need traceable model logic, training data records, and human oversight documentation under high-risk employment AI rules. Cross-border reward fulfillment also creates data residency conflicts when redemption records move across markets with localization rules in India, China, or Russia. Vendors with ISO 27001, SOC 2 Type II, and GDPR-compliant architecture built into core infrastructure are better placed to scale global use cases. Even so, enterprise buyers often struggle to test the depth of those controls during procurement, which extends evaluation cycles in the total rewards platform market.
*Our forecasts treat driver/restraint impacts as directional, not additive. The impact forecasts reflect baseline growth, mix effects, and variable interactions.
Segment Analysis
By Deployment Mode: Legacy Installations Still Lead, but Cloud is Resetting Demand
On-premises held 62.81% of the total rewards platform market share in 2025, reflecting the weight of long-running enterprise contracts over the current preference for self-managed systems. That installed base was built over long procurement cycles, and many large employers kept on-premises environments because payroll, rewards, and employee master data were deeply customized and difficult to move. Cloud-based deployment is projected to grow at a 12.36% CAGR through 2031, making it the fastest-growing deployment model in the total rewards platform market. The timing is important because SAP's December 2025 compatibility support expiry and its 2030 end-of-support path are creating specific renewal windows for employers that had delayed migration. Cloud infrastructure is also gaining credibility because vendors can push compliance updates across more than 140 countries without requiring each employer to manually manage local rule changes.
A growing number of employers are choosing a hybrid deployment, where core employee records remain on-premises while recognition, LSA administration, and pay equity analytics run in cloud modules. This pattern is especially visible in regulated sectors that want modern functionality but still need tighter control over sensitive data stores. It also means the total rewards platform industry is not moving in a straight line from on-premises to full cloud, because selective cloud adoption addresses compliance and operational needs simultaneously. In Europe and parts of Asia-Pacific, GDPR and data sovereignty rules will keep hybrid models relevant even as cloud adoption continues to rise.


By Platform Module: Recognition Still Leads Revenue, While Analytics Gains Strategic Weight
Recognition and rewards held a 36.41% share in 2025, making it the largest module in the total rewards platform market, as it is often the first capability employers choose to digitize. Employers usually launch recognition first because it can go live without deep payroll integration and quickly show visible participation and engagement activity. Compressed salary budgets, with average US merit increase budgets stabilizing at 3.2%-3.6% for 2026, also kept recognition attractive as a lower-cost retention lever. People analytics and pay equity are projected to grow at a 11.21% CAGR through 2031, marking the fastest expansion within this module group. That pace is being driven by reporting requirements under EU pay transparency rules and by broader state-level pay legislation in the United States.
Compensation management and benefits administration remain important middle layers because employers want merit planning, enrollment, and communication tools to use the same data model rather than being split across separate systems. Procurement patterns are also shifting toward bundles, since buyers increasingly want compensation, benefits, and recognition to interact rather than sit in disconnected applications. The remaining module group, including total rewards statements, sales performance management, and workforce scheduling links, is growing, where frontline managers need current pay guidance during hiring and retention decisions. Across these modules, security and audit controls are becoming part of the product decision rather than a later IT review because the workflows span compensation and health benefits data.
By Organization Size: Large Enterprises Hold the Base, but SMEs are Expanding Faster
Large enterprises held a 68.34% share in 2025, reflecting higher per-employee platform spending and wider adoption of multi-module rollouts across complex global operations. Their revenue base remains strong because multinational payroll, benefits, and compensation structures make unified tools even more valuable as the organization scales. Small and medium-sized enterprises are projected to grow at a 12.05% CAGR through 2031, the fastest pace within this segment.[2]Jess Huckins, “5 Top Findings From Our 2025 Midyear Lifestyle Benefits Benchmark Report,” Compt, compt.io Usage-based SaaS pricing and modular entry packages removed the capital hurdle that once limited advanced total rewards infrastructure to larger employers. Compt reported that mid-sized companies with 100-1,000 employees raised LSA funding by more than USD 300 per employee in the 2025 cycle, reaching USD 1,391 per employee each year.
Regulation is also pulling smaller employers into the category, especially in states where pay transparency rules now cover more than 30% of the national workforce. Many employers with 100-500 workers are finding that payroll-only systems cannot generate the pay-range documents or internal equity views now required for compliance. In Germany, cloud-native vendors are also competing hard for smaller businesses by combining standardized pricing with DSGVO automation and localized workflows. That pattern shows how the total rewards platform industry is widening from enterprise-led adoption to a broader mid-market demand base.
By End-User Industry: Technology Leads by Scale, While Healthcare Grows on Need
IT and telecommunications accounted for a 38.76% share in 2025, making it the largest end-user group in the total rewards platform market. The sector's high white-collar headcount, global operating footprint, and intense retention pressure keep demand elevated across recognition, compensation, and pay equity tools. Salary pressure is also sharper here because AI skills command premiums of as much as 56% over comparable roles. The healthcare and life sciences sector is projected to grow at a 10.81% CAGR through 2031, making it the fastest-growing end-user segment. Hospitals and life sciences employers are dealing with complex pay structures that include shift differentials, on-call premiums, physician incentives, and specialty sign-on bonuses that standard HR systems do not model well.
Employers in this segment also expect healthcare benefit costs to rise 8%-10% in 2026, which is increasing pressure on benefits design and communication. BFSI remains a steady buyer group because audit requirements around remuneration make documented compensation workflows more important than discretionary perks alone. Retail and e-commerce use these platforms to reach high-turnover frontline employees through mobile recognition tools, while manufacturing tends to focus on safety incentives and shift-based recognition. The total rewards platform industry is therefore seeing volume leadership from technology employers and urgency-led growth from healthcare organizations.
Geography Analysis
North America held 35.49% of the total rewards platform market share in 2025, which made it the largest regional block. The United States remained the anchor market, with more than 30% of the national workforce covered by active pay transparency laws in 2026. That legal coverage is widening as more states finalize pay range disclosure and pay equity reporting mandates. Canada and Mexico added demand on a smaller scale, with Canada's federal pay equity framework continuing to support the adoption of compensation analytics among regulated employers. A clear regional shift is now underway from single-use compliance tools toward broader suites that integrate compensation, benefits, recognition, and analytics within a single workflow.
Europe is centered on Germany, the United Kingdom, and France, which remain the largest enterprise HCM markets in the region. The EU Pay Transparency Directive is creating a near-term procurement trigger by introducing mandatory pay gap reporting, joint pay assessments for gaps above 5%, and tighter rules on pay secrecy. Germany adds another layer of localization, as vendors need DSGVO compliance, DATEV payroll integration, and works council-ready processes to win local enterprise accounts. The United Kingdom still supports its own demand because employers with 250 or more workers remain subject to gender pay gap reporting outside the EU framework.
Asia-Pacific is projected to grow at a 11.67% CAGR through 2031, making it the fastest-growing geography in the total rewards platform market. India's HR software market is set to exceed USD 1 billion in 2026, while China continues to absorb cloud compensation and recognition tools through large-enterprise digitalization programs. Japan's HR technology market is expected to reach USD 1.82 billion in 2026, and SmartHR's June 2025 payroll calculation launch showed how the country is moving from manual processes to connected HCM systems. South America, the Middle East, and Africa remain earlier-stage adoption areas, with Brazil leading benefits administration demand, Saudi Arabia and the UAE supporting recognition growth, and South Africa and Nigeria serving as footholds for multinational rollout.

Competitive Landscape
The total rewards platform market remains moderately fragmented, with recognition specialists, compensation vendors, benefits administrators, and flexible benefits wallet providers all competing for different entry points.[3]“Workday and Achievers Launch AI-Powered Recognition and Rewards Solution to Boost Employee Engagement and Retention,” Workday Newsroom, newsroom.workday.com Focused vendors such as Workhuman, O.C. Tanner, Achievers, beqom, Businessolver, Benefitfocus, Benepass, Twic or Forma, and Nayya operate alongside larger HCM suites rather than under a single dominant leader. No single vendor controls more than a mid-single-digit share of global revenue, because many employers still buy recognition, compensation management, and benefits administration from separate providers. That buying behavior leaves a long tail of specialists in place and keeps switching decisions closely tied to integration quality and renewal timing. Ecosystem coupling is now a central tactic, as vendors secure certified links with Workday, SAP SuccessFactors, and Microsoft Dynamics 365 to enter HCM renewal conversations earlier.
Workday and Achievers moved this strategy forward in April 2026 by launching an AI-powered recognition and rewards offering directly within Workday Human Capital Management. Awardco followed the same path in November 2025 with a Workday-certified data sync integration that supported 49 languages and more than 250 joint customers. Benepass took a different route in January 2026 by raising USD 40 million to expand HSA and specialty HRA lines, after managing more than USD 900 million in benefit funding and processing 4.5 million card transactions. Alight also expanded its partner network in March 2026 to include Benifex and Nudge Global, strengthening its reach in multinational benefits and financial wellness.
AI governance and pay equity analytics are emerging as structural differentiators, especially as 93% of compensation software buying decisions now involve IT, Finance, and executive leadership in addition to HR. The strongest open areas remain mid-market compensation tools, frontline recognition in healthcare and manufacturing, and cross-border LSA administration with automated tax treatment. Native bundling from Workday, SAP SuccessFactors, and Oracle raises the renewal risk for pure-play vendors, because platform buyers may accept broader suite functionality before deeper specialization can be tested. Vendors that embed SOC 2 Type II, ISO 27001, GDPR, and HIPAA controls into their core architecture are better positioned to capture expansion revenue in the total rewards platform market.
Total Rewards Platform Industry Leaders
O.C. Tanner Company
beqom SA
Achievers Solutions Inc.
Benifex Limited
Awardco, Inc.
- *Disclaimer: Major Players sorted in no particular order

Recent Industry Developments
- April 2026: Workday and Achievers launched "Workday Recognition provided by Achievers," an AI-powered recognition and rewards solution integrated directly within Workday Human Capital Management. The solution delivers real-time performance insights, identifies top contributors and high-impact skills, and supports a global rewards catalog in local currencies across 190 countries, positioning it as a direct challenge to standalone recognition platforms during Workday renewal cycles.
- March 2026: Alight expanded its Alight Partner Network to include Benifex, building on Benifex's 2025 merger with Benify, and integrated its financial education platform nudge Global to strengthen financial wellbeing capabilities for multinational employers. The partnership creates a combined digital-first benefits journey spanning recognition, flexible benefits, and financial wellness.
- February 2026: WTW launched Rewards AI, a generative AI-enabled compensation intelligence platform that provides natural-language querying of rewards data, traceable recommendations tied directly to data sources, and real-time market shift analysis. The launch marked WTW's entry into the AI-native compensation decisioning segment, directly competing with specialist compensation management platforms.
- January 2026: Benepass closed a USD 40 million Series B funding round led by Centana Growth Partners, with participation from FoW Partners, Portage Ventures, and Threshold Ventures. Funding is directed toward expanding enterprise-scale HSA and Specialty HRA product lines, with the company managing more than USD 900 million in benefit funding and achieving revenue growth of more than double year-over-year since January 2025.


Global Total Rewards Platform Market Report Scope
Total rewards platforms offer organizations a comprehensive suite to manage employee compensation, benefits, and wellness programs. By providing a holistic view of employee rewards and allowing for personalized adjustments, these platforms significantly enhance employee engagement and retention. Nestled within the broader Human Capital Management landscape, the market underscores the importance of data-driven and AI-enhanced reward strategies.
The Total Rewards Platform Market Report is Segmented by Deployment Mode (Cloud-Based and On-Premises), Platform Module (Recognition and Rewards, Compensation Management, Benefits Administration, People Analytics and Pay Equity, and Other Platform Modules), Organization Size (Large Enterprises and Small and Medium-sized Enterprises), End-User Industry (Information Technology and Telecommunications, Banking, Financial Services, and Insurance, Healthcare and Life Sciences, Retail and E-commerce, Manufacturing, and Other End-User Industries), and Geography (North America, South America, Europe, Asia-Pacific, Middle East, and Africa). The Market Forecasts are Provided in Terms of Value (USD).
| Cloud-Based |
| On-Premises |
| Recognition and Rewards |
| Compensation Management |
| Benefits Administration |
| People Analytics and Pay Equity |
| Other Platform Modules |
| Large Enterprises |
| Small and Medium-sized Enterprises |
| Information Technology and Telecommunications |
| Banking, Financial Services, and Insurance |
| Healthcare and Life Sciences |
| Retail and E-commerce |
| Manufacturing |
| Other End-User Industries |
| North America | United States |
| Canada | |
| Mexico | |
| South America | Brazil |
| Argentina | |
| Rest of South America | |
| Europe | Germany |
| United Kingdom | |
| France | |
| Italy | |
| Spain | |
| Russia | |
| Rest of Europe | |
| Asia-Pacific | China |
| Japan | |
| India | |
| South Korea | |
| Australia and New Zealand | |
| Rest of Asia-Pacific | |
| Middle East | Saudi Arabia |
| United Arab Emirates | |
| Turkey | |
| Rest of Middle East | |
| Africa | South Africa |
| Nigeria | |
| Rest of Africa |
| By Deployment Mode | Cloud-Based | |
| On-Premises | ||
| By Platform Module | Recognition and Rewards | |
| Compensation Management | ||
| Benefits Administration | ||
| People Analytics and Pay Equity | ||
| Other Platform Modules | ||
| By Organization Size | Large Enterprises | |
| Small and Medium-sized Enterprises | ||
| By End-User Industry | Information Technology and Telecommunications | |
| Banking, Financial Services, and Insurance | ||
| Healthcare and Life Sciences | ||
| Retail and E-commerce | ||
| Manufacturing | ||
| Other End-User Industries | ||
| By Geography | North America | United States |
| Canada | ||
| Mexico | ||
| South America | Brazil | |
| Argentina | ||
| Rest of South America | ||
| Europe | Germany | |
| United Kingdom | ||
| France | ||
| Italy | ||
| Spain | ||
| Russia | ||
| Rest of Europe | ||
| Asia-Pacific | China | |
| Japan | ||
| India | ||
| South Korea | ||
| Australia and New Zealand | ||
| Rest of Asia-Pacific | ||
| Middle East | Saudi Arabia | |
| United Arab Emirates | ||
| Turkey | ||
| Rest of Middle East | ||
| Africa | South Africa | |
| Nigeria | ||
| Rest of Africa | ||


Key Questions Answered in the Report
What is the total rewards platform market size in 2026 and how large will it be by 2031?
The total rewards platform market was valued at USD 11.13 billion in 2025 and is projected to reach USD 19.22 billion by 2031, growing at a 9.54% CAGR from 2026 to 2031.
Which deployment model is growing fastest in total rewards platforms?
Cloud-based deployment is the fastest-growing model, with a projected 12.36% CAGR through 2031, while on-premises still held the larger installed share in 2025.
Why are pay transparency rules increasing software demand?
Employers now need stronger job architecture, pay equity analysis, and reporting controls, especially in Europe and several US states, which basic payroll systems often cannot support well.
Which platform module leads revenue and which one is expanding fastest?
Recognition and rewards led with a 36.41% share in 2025, while people analytics and pay equity is growing fastest at an 11.21% CAGR through 2031.
Why are SMEs adopting these platforms faster than large enterprises?
SaaS pricing, modular deployment, and compliance needs are lowering the entry barrier, helping SMEs grow at a 12.05% CAGR through 2031.
Which region leads and which one grows fastest?
North America led with a 35.49% share in 2025, while Asia-Pacific is projected to grow fastest at an 11.67% CAGR through 2031.
Page last updated on:


