Platform As A Service Market Size and Share
Market Overview
| Study Period | 2020 - 2031 |
|---|---|
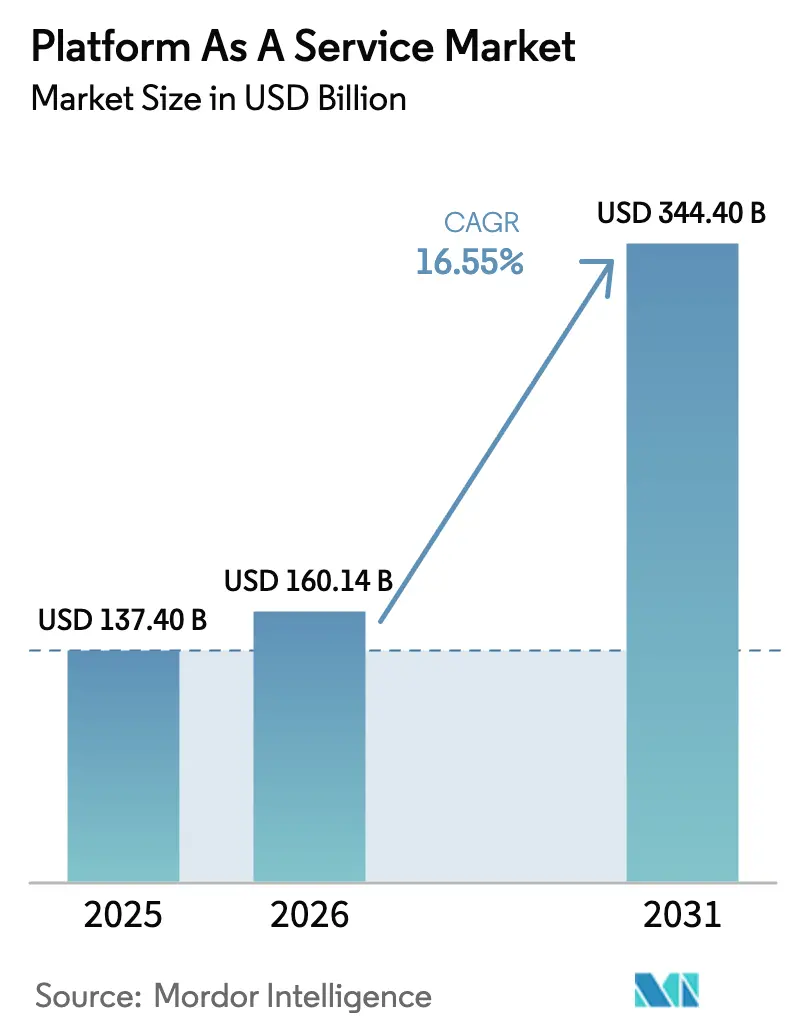
| Market Size (2026) | USD 160.14 Billion |
| Market Size (2031) | USD 344.4 Billion |
| Growth Rate (2026 - 2031) | 16.55% CAGR |
| Fastest Growing Market | Asia Pacific |
| Largest Market | North America |
| Market Concentration | Medium |
Major Players *Disclaimer: Major Players sorted in no particular order Image © Mordor Intelligence. Reuse requires attribution under CC BY 4.0. | |
Platform As A Service Market Analysis by Mordor Intelligence
The Platform as a Service market size is expected to grow from USD 137.40 billion in 2025 to USD 160.14 billion in 2026 and is forecast to reach USD 344.4 billion by 2031 at 16.55% CAGR over 2026-2031. Strong growth reflects enterprises’ shift to cloud-native development environments that remove infrastructure management, shorten release cycles, and embed AI capabilities natively. Over 94% of companies already use cloud services, and 89% execute multi-cloud strategies to reduce vendor dependence while accessing best-of-breed tools . Database PaaS remains the backbone for mission-critical workloads, while Integration PaaS posts the quickest gains as firms link data, applications, and edge assets. Regionally, North America benefits from hyperscaler scale and mature digital ecosystems, yet Asia-Pacific advances fastest as manufacturers, financial institutions, and public agencies accelerate modernization. Across verticals, financial services leverage PaaS for compliance automation and real-time analytics, whereas healthcare outpaces all peers on the back of telemedicine and patient-data initiatives.
Key Report Takeaways
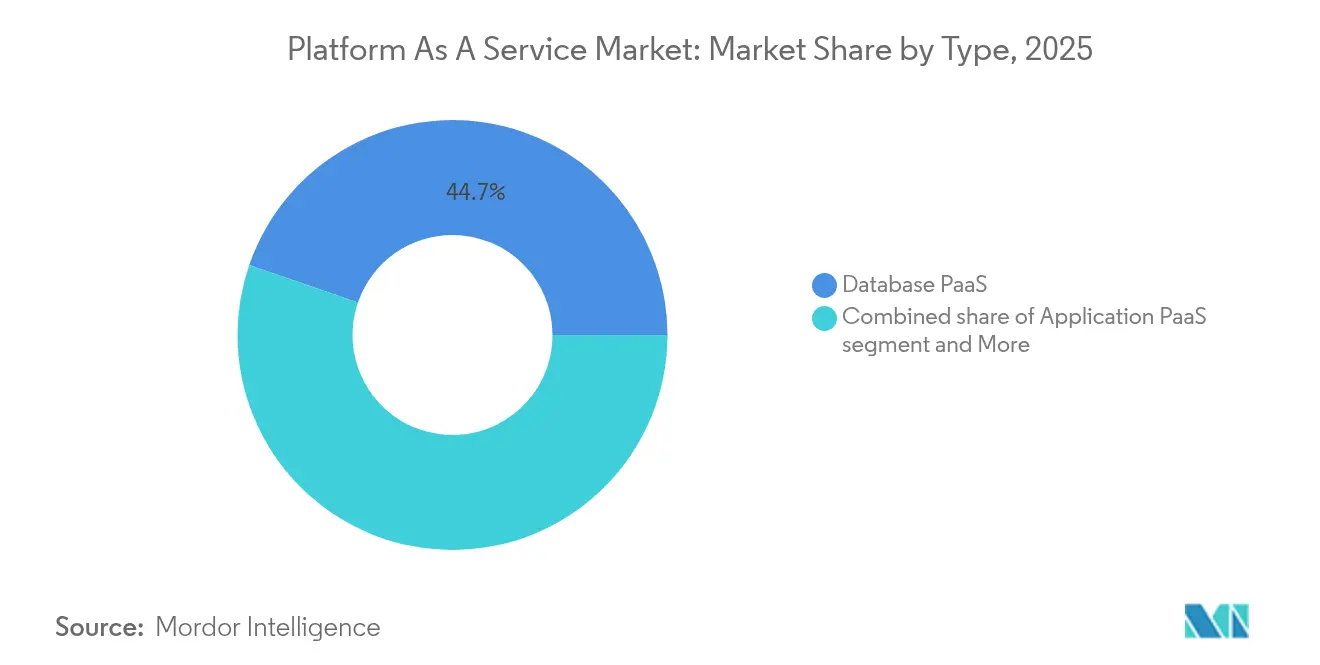
- By type, Database PaaS captured 44.72% of the Platform as a Service market share in 2025; Integration PaaS is forecast to expand at a 22.96% CAGR to 2031.
- By deployment model, Public PaaS held 64.05% of revenue in 2025, while Hybrid PaaS registers the highest projected CAGR at 24.12% through 2031.
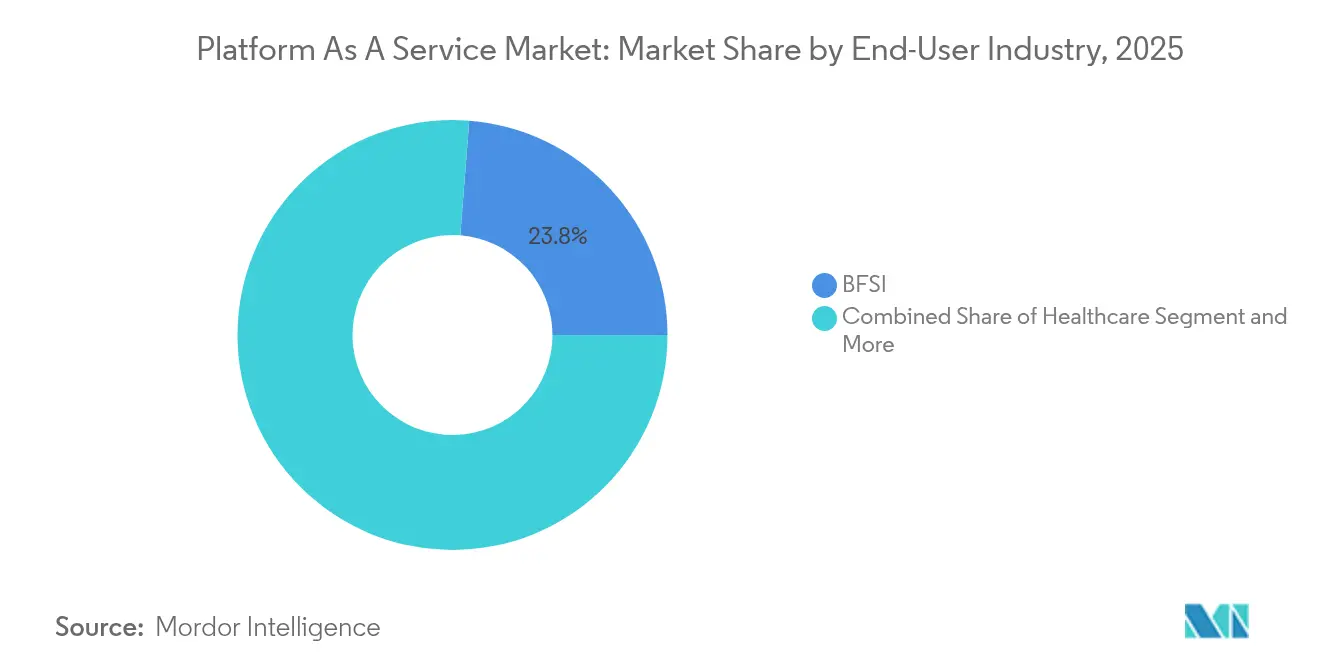
- By end-user industry, financial services led with 23.76% revenue share in 2025; healthcare is advancing at a 16.92% CAGR to 2031.By organization size, large enterprises accounted for 68.92% of revenue in 2025, whereas SMEs are growing at a 20.95% CAGR to 2031.
- By organization size, large enterprises held 68.92% revenue share in Platform-as-a-service market, while SMEs registers the highest projected CAGR at 20.95% through 2031.
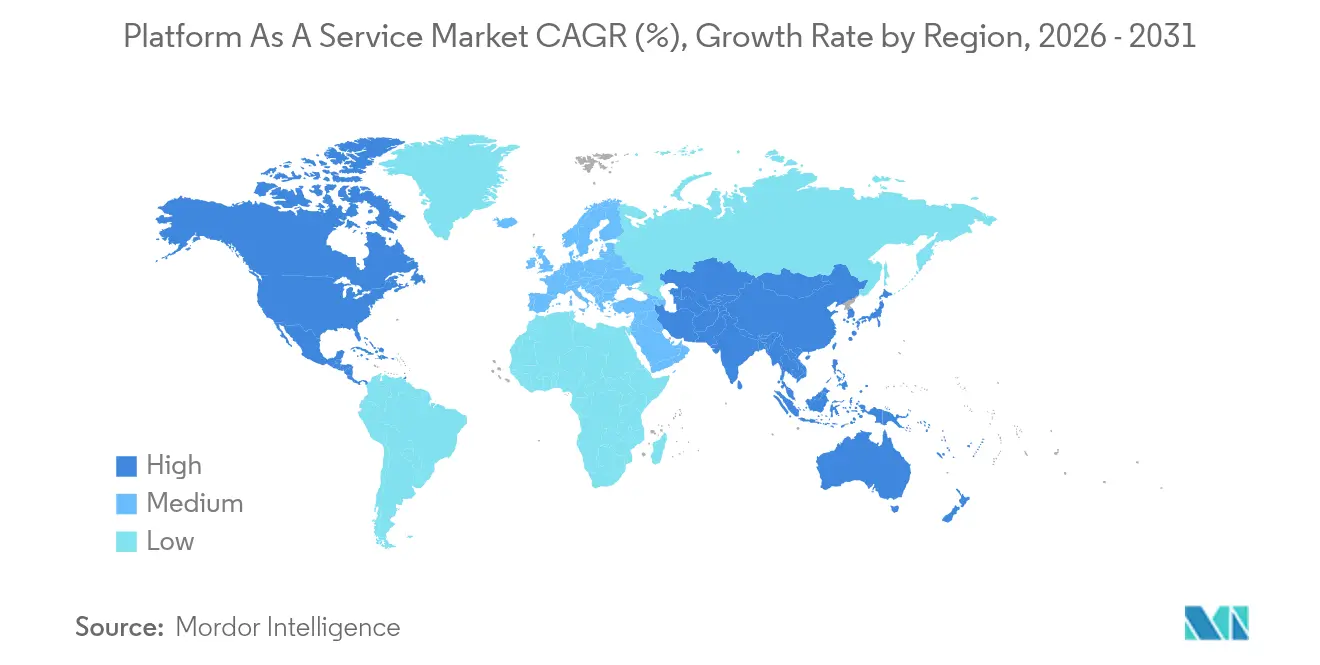
- By geography, North America commanded 38.12% of revenue in 2025; Asia-Pacific is forecast to rise at a 17.05% CAGR through 2031
Note: Market size and forecast figures in this report are generated using Mordor Intelligence’s proprietary estimation framework, updated with the latest available data and insights as of 2026.
Global Platform As A Service Market Trends and Insights
Drivers Impact Analysis*
| Driver | (~) % Impact on CAGR Forecast | Geographic Relevance | Impact Timeline |
|---|---|---|---|
| Rising penetration of digitalisation | +3.2% | Global, with accelerated adoption in Asia-Pacific and emerging markets | Medium term (2-4 years) |
| Growing need to cut time-to-market and development cost | +2.8% | North America and EU core, expanding to Asia-Pacific manufacturing hubs | Short term (≤ 2 years) |
| Surge in multi-cloud and hybrid-cloud strategies | +2.1% | Global, particularly strong in regulated industries across all regions | Medium term (2-4 years) |
| Expansion of AI/ML and analytics workloads | +3.5% | North America and EU leading, rapid adoption in China and India | Long term (≥ 4 years) |
| Emergence of industry-specific PaaS | +1.9% | Sector-specific with healthcare and BFSI leading globally | Long term (≥ 4 years) |
| Green-software and energy-efficiency mandates | +1.3% | EU and North America regulatory-driven, voluntary adoption in APAC | Long term (≥ 4 years) |
| Source: Mordor Intelligence | |||
Rising Penetration of Digitalisation
Digital transformation remains the prime enabler for the Platform as a Service market. Ninety-four percent of organizations now rely on cloud services, and many cite platform services as the fastest route to modernize legacy systems without heavy capital outlays. Manufacturers integrate IoT data streams, retailers stand up omnichannel storefronts, and public agencies adopt “cloud-first” procurement rules that favor PaaS. Seamless scaling, embedded security, and native DevOps tooling collectively reduce risk and improve release velocity, reinforcing adoption momentum.
Growing Need to Cut Time-to-Market and Development Costs
Enterprises using managed platforms report a 40% drop in development cycles and a 25% fall in coding expenditure, mainly because pre-built runtime environments and automated CI/CD pipelines remove infrastructure bottlenecks. Consumption-based pricing further aligns cost with actual usage, encouraging experimentation. SMEs gain parity with large rivals because low-code stacks and serverless components let small teams build sophisticated digital products quickly.
Surge in Multi-cloud and Hybrid-cloud Strategies
Eighty-nine percent of firms distribute workloads across two or more clouds, seeking latency optimization, vendor negotiation leverage, and regulatory compliance. PaaS vendors respond with cross-platform connectors and unified policy engines. The Oracle-Google Cloud alliance, for instance, permits customers to run Oracle’s databases next to Google’s AI services without refactoring. Regulated sectors such as insurance and banking favor hybrid models that retain sensitive data on-premises while offloading analytics to public regions.
Expansion of AI/ML and Analytics Workloads
Hyperscalers embed GPU and TPU accelerators into their PaaS stacks, enabling developers to fine-tune large language models or deploy real-time analytics in a few clicks. Azure Machine Learning guarantees 99.9% uptime and automates model retraining, while Red Hat OpenShift extends AI pipelines to edge sites[2]Red Hat Inc., “Red Hat OpenShift 2025 Roadmap,” redhat.com. As AI infuses every application layer, demand for fully managed, scalable runtime environments rises, fuelling long-term PaaS growth.
Restraints Impact Analysis*
| Restraint | (~)% Impact on CAGR Forecast | Geographic Relevance | Impact Timeline |
|---|---|---|---|
| Data privacy and sovereignty concerns | -2.4% | EU GDPR-driven, expanding to Asia-Pacific with localization mandates | Medium term (2-4 years) |
| Vendor lock-in risk and switching costs | -1.8% | Global, highest impact in North America enterprise segment | Short term (≤ 2 years) |
| Energy cost volatility in data centers | -1.2% | EU and North America, with spillover to Asia-Pacific | Long term (≥ 4 years) |
| Cloud misconfiguration and breach risk | -1.0% | Global, affecting multi-cloud adopters | Short term (≤ 2 years) |
| Source: Mordor Intelligence | |||
Data Privacy and Sovereignty Concerns
Forty-five nations now require local data residency for some workloads, and GDPR imposes heavy fines for cross-border transfers without adequate safeguards aws. European and APAC banks respond by insisting on sovereign-cloud zones that guarantee physical location control. Providers build dedicated regions and advanced encryption services, yet compliance audits and contract negotiations lengthen PaaS procurement cycles, tempering uptake.
Vendor Lock-in Risk and Switching Costs
Migrating from one platform to another can involve refactoring code, exporting databases, and retraining staff, generating non-trivial expense. Over 70% of enterprises exceeded cloud budgets in 2024, partly because removing workloads proved more complex than anticipated spacelift. Multi-cloud adoption mitigates concentration risk, but adds orchestration overhead. Newer vendors promote open standards and container portability, yet entrenched API dependencies continue to restrain fluid movement.
*Our forecasts treat driver/restraint impacts as directional, not additive. The impact forecasts reflect baseline growth, mix effects, and variable interactions.
Segment Analysis
By Type: Database Leadership and Integration Momentum
Database PaaS contributed 44.72% of revenue in 2025, underscoring its centrality to transaction-heavy systems that demand high availability and automated patching. Azure SQL Database, for instance, offers 99.99% availability and built-in performance tuning, enabling organizations to redeploy DBA resources to higher-value tasks. Integration PaaS records the strongest trajectory at a 22.96% CAGR as firms connect SaaS suites, on-premises ERP, and edge devices to craft unified data fabrics. The Platform as a Service market size for integration-centric offerings is therefore poised to outpace the broader market through 2031.
Beyond these two pillars, application PaaS maintains relevance for core web workloads, communication PaaS gains prominence for customer-engagement APIs, and mobile PaaS serves organizations with dedicated app portfolios. As digital maturity rises, demand tilts toward integration, analytics, and event-driven architectures. This mix positions the Platform as a Service industry at the heart of composable enterprise strategies, where loosely coupled services supersede monolithic stacks.


By Deployment: Public Scale versus Hybrid Control
Public PaaS retained 64.05% revenue share in 2025 thanks to elastic capacity, global points of presence, and continuous feature updates delivered by hyperscalers. The Platform as a Service market size for public deployments aligns with enterprises seeking predictable OpEx models and rapid geographic expansion. Hybrid PaaS, however, advances at a 24.12% CAGR because regulated industries host sensitive data on-premises while offloading bursty analytics to public zones. Products such as Red Hat OpenShift or Microsoft’s Azure Arc enable uniform tooling across locations, reducing operational friction.
Private PaaS remains niche, reserved for defense, critical infrastructure, and organizations with stringent latency or sovereignty mandates. Even there, providers increasingly pair on-premises control planes with public-cloud management APIs to deliver common developer experiences. Consequently, workload-placement decisions shift from binary public-versus-private choices to fine-grained policies governed by data classification, compliance, and performance profiles. This evolution broadens the addressable Platform as a Service market.
By End-User Industry: BFSI Scale Meets Healthcare Acceleration
Financial services captured 23.76% of 2025 spend, leveraging platforms to automate regulatory reporting, deploy digital banking applications, and run high-frequency analytics. Database encryption, auditable change tracking, and regional fail-over attract banks that need strict compliance without sacrificing agility. Conversely, healthcare grows fastest at 16.92% CAGR as telehealth, electronic health record modernization, and AI-assisted diagnostics demand scalable back-ends. Cloud-native reference architectures with HIPAA-compliant controls accelerate provider adoption.
Manufacturing, retail, and energy each exploit edge-ready PaaS capabilities for smart-factory analytics, omnichannel commerce, and grid optimization respectively. Government agencies adopt platform services to digitize citizen interactions and reduce legacy maintenance costs. These cross-industry patterns confirm that the Platform as a Service market extends well beyond early adopters and now underpins critical workloads in every sector.
By Organization Size: Enterprise Resources, SME Velocity
Large enterprises controlled 68.92% of 2025 revenue, using their capital strength to standardize on strategic platforms, negotiate volume discounts, and integrate advanced security tooling. They also orchestrate complex hybrid environments that span hundreds of subsidiaries and regions. SMEs, however, register a 20.95% CAGR because subscription pricing and low-code tooling level the playing field. Nearly half of small businesses expect to run core workloads on hyperscaler PaaS by 2025, reflecting democratization of advanced capabilities.
While budget constraints and skills gaps persist, providers counter with managed services bundles, automated policy templates, and marketplace ecosystems that simplify adoption. These developments ensure that growth at the lower end of the market feeds a diverse pipeline of new workloads, sustaining long-run expansion of the Platform as a Service market.
Geography Analysis
North America’s installed enterprise base and concentration of hyperscalers anchor leadership. Government agencies allocate rising budgets to platform solutions that improve mission speed, while Fortune 500 companies embed AI services throughout application portfolios. Sovereign-cloud concerns and geopolitical tensions, however, encourage diversification across providers and regions.
Asia-Pacific records the world’s fastest uptake, driven by cloud-first manufacturing, fintech disruption, and government mandates that digitize citizen services. Localization rules mean hybrid architectures prevail, but progressive regulators increasingly certify public regions once data-protection controls meet national standards.
Europe balances innovation with stringent privacy requirements. Providers respond by launching dedicated EU sovereign zones and enhancing encryption tools. South America plus the Middle East and Africa progress at different paces, yet improving connectivity and entrepreneurial ecosystems nurture green-field PaaS deployments. Together these patterns underscore the ubiquity of platforms as foundational digital infrastructure across advanced and emerging economies.

Competitive Landscape
Moderate concentration characterizes the current Platform as a Service market. AWS, Microsoft, and Google Cloud collectively account for roughly 68% of wider cloud infrastructure revenue, though new rivals target specialized niches.
AWS continues to lead at 31%, Microsoft follows at 20%, and Google holds 13%, but each deepens AI integration and verticalisation to defend share crn. Oracle teams with Google to combine industry-specific databases and GenAI tooling, while IBM emphasizes hybrid governance through Red Hat OpenShift.
Start-ups such as Fly.io and Flightcontrol simplify global deployment for developers wary of lock-in, and telecom operators build edge platforms to monetize 5G. Patent-filing analysis shows Microsoft, IBM, and Intel increasing cybersecurity RandD, highlighting IP as a competitive differentiator eurekalert. As buyers demand workload-specific performance, data-resident controls, and open APIs, advantage shifts from raw scale to specialized capability sets, keeping vendor dynamics fluid.
Platform As A Service Industry Leaders
AWS
Microsoft Corporation
Google LLC
SAP SE
Oracle Corporation
- *Disclaimer: Major Players sorted in no particular order

Recent Industry Developments
- June 2025: Oracle and Google Cloud unveiled a multicloud alliance allowing Oracle Database services to run in Google facilities, enabling joint customers to unify analytics and AI workflows
- May 2025: Microsoft reported Azure revenue up 33% YoY, crediting AI services for 16 percentage-points of that growth as enterprises embed large-language-model capabilities into applications.
- March 2025: Flexera’s 2025 State of the Cloud survey found 79% of respondents using AWS and 77% using Azure, with one-third spending above USD 12 million annually on public cloud.
- January 2025: ALSO Holding AG disclosed preliminary 2024 turnover of EUR 11.0 billion (USD 12.43 billion), citing momentum in cloud, AI, and cybersecurity platforms that serve 135,000 resellers.


Research Methodology Framework and Report Scope
Market Definitions and Key Coverage
According to Mordor Intelligence, our study defines the Platform as a Service market as every cloud-delivered platform that lets developers build, run, integrate, and govern applications without owning underlying hardware, operating systems, or middleware. Offerings span application, integration, database, and communication PaaS across public, private, and hybrid clouds.
Scope exclusion: We deliberately leave out pure Infrastructure-as-a-Service workloads and stand-alone SaaS applications.
Segmentation Overview
- By Type
- Database PaaS
- Application PaaS
- Integration PaaS
- Communication PaaS
- Mobile PaaS
- By Deployment
- Public PaaS
- Private PaaS
- Hybrid PaaS
- By End-User Industry
- BFSI
- Healthcare
- Manufacturing
- Retail and E-commerce
- Government and Defence
- Energy and Utilities
- Telecom and IT Services
- By Organisation Size
- Large Enterprises
- Small and Medium-sized Enterprises (SMEs)
- By Geography
- North America
- United States
- Canada
- Mexico
- South America
- Brazil
- Argentina
- Rest of South America
- Europe
- United Kingdom
- Germany
- France
- Italy
- Spain
- Nordics
- Rest of Europe
- Middle East and Africa
- GCC
- Israel
- South Africa
- Rest of Middle East and Africa
- Asia-Pacific
- China
- India
- Japan
- South Korea
- ASEAN
- Australia
- New Zealand
- Rest of Asia-Pacific
- North America
Detailed Research Methodology and Data Validation
Primary Research
Mordor analysts conduct semi-structured interviews with cloud architects, enterprise CIOs, and developer-community leads in North America, Europe, Asia-Pacific, and the Middle East. These conversations confirm adoption velocity, average subscription prices, and switching triggers that desk work alone cannot surface.
Desk Research
We begin with structured desk work, drawing on tier-one open datasets such as the US Census ICT surveys, Eurostat digital-economy panels, OECD cloud-spend trackers, and regional telecom regulators' cloud-traffic statistics. Company 10-Ks, investor presentations, developer-conference transcripts, and patent filings enrich trend mapping, while Dow Jones Factiva and D&B Hoovers supply revenue splits and competitive clues. The sources listed illustrate breadth, and many additional public and paid references guided our fact-finding.
A second sweep reconciles figures across cloud trade associations, customs export ledgers for servers, and Questel patent families so outliers are flagged before numbers advance to modeling.
Market-Sizing & Forecasting
We deploy a top-down and bottom-up blend. Global enterprise IT spend is filtered to the addressable developer-platform pool, adjusted by cloud-penetration ratios, then cross-checked against sampled provider revenue roll-ups and average selling price multiplied by active-user counts. Key variables like hyperscaler capex pipelines, professional-developer headcount, container-adoption ratio, workload-migration rates, and average PaaS price per user feed a multivariate regression that projects demand through 2030. Where supplier disclosures are partial, we interpolate using regional cloud-traffic growth and invoice benchmarks gathered during primary calls.
Data Validation & Update Cycle
Outputs pass anomaly scans, peer-review rounds, and senior-analyst sign-off. We refresh every twelve months, triggering interim updates whenever material events such as price resets or landmark acquisitions occur so clients always receive the latest view.
Why Mordor's Platform As A Service Baseline Is the Trusted Yardstick
Published estimates often diverge because firms choose different service mixes, currency bases, and refresh timings.
Key gap drivers include some publishers folding serverless add-ons into totals, aggressive double-counting of bundled DevOps tools, or static price curves that ignore vendor discounts we capture through annual client interviews.
Benchmark comparison
| Market Size | Anonymized source | Primary gap driver |
|---|---|---|
| USD 137.40 B (2025) | Mordor Intelligence | - |
| USD 167.93 B (2025) | Global Consultancy A | counts adjacent SaaS modules and applies uniform 21 % CAGR without price-erosion checks |
| USD 107.55 B (2025) | Industry Association B | excludes private-cloud PaaS and uses 2023 currency rates |
| USD 93.40 B (2024) | Regional Consultancy C | relies on voluntary vendor surveys with limited geographic reach |
The comparison shows that our disciplined scope setting, variable-level price tracking, and yearly refresh deliver a balanced, transparent baseline that decision-makers can reuse with confidence.


Key Questions Answered in the Report
What is the current value of the Platform as a Service market?
The Platform as a Service market stands at USD 160.14 billion in 2026.
How fast will the Platform as a Service market grow?
Revenue is projected to rise at a 16.55% CAGR, reaching USD 344.4 billion by 2031.
Which segment leads the Platform as a Service market?
Database PaaS holds leadership with 44.72% revenue share in 2025.
Which region is expanding fastest?
Asia-Pacific records the highest growth, forecast at a 17.05% CAGR through 2031.
Why are hybrid deployment models gaining traction?
Hybrid PaaS delivers public-cloud scalability while meeting data-residency and latency requirements, advancing at a 24.12% CAGR.
How concentrated is vendor competition?
AWS, Microsoft, and Google Cloud capture around 68% of spending, indicating moderate concentration with room for specialized challengers.
Page last updated on:


