Physical Security Services Market Size and Share
Market Overview
| Study Period | 2020 - 2031 |
|---|---|
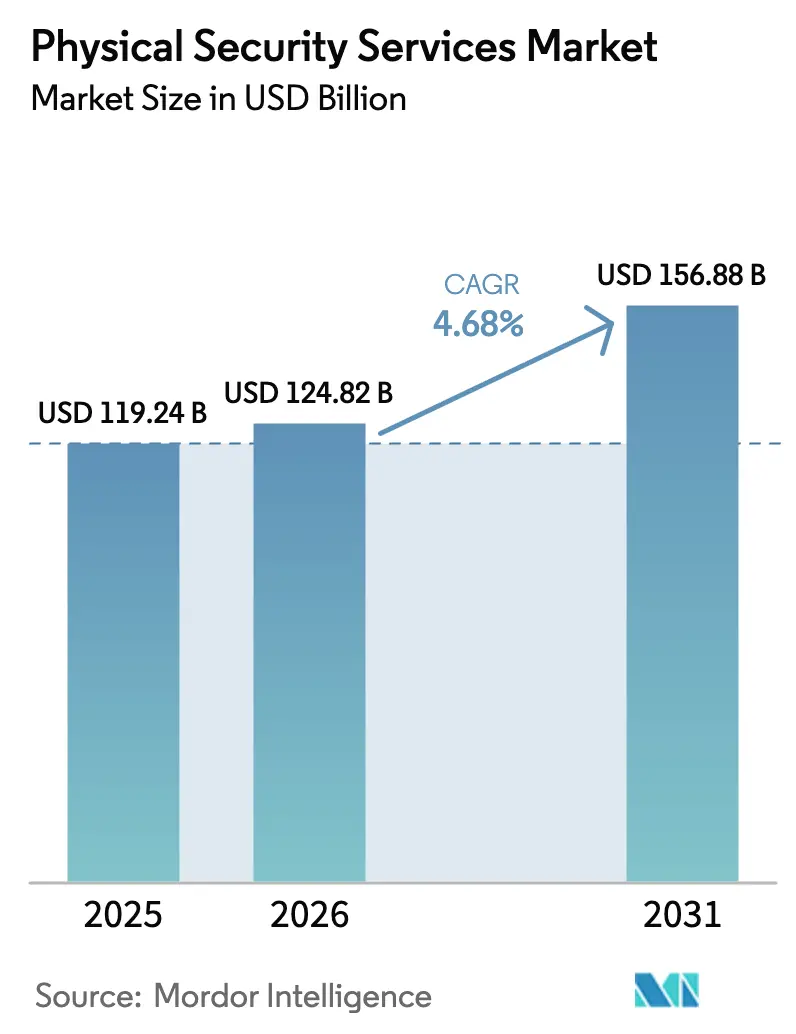
| Market Size (2026) | USD 124.82 Billion |
| Market Size (2031) | USD 156.88 Billion |
| Growth Rate (2026 - 2031) | 4.68% CAGR |
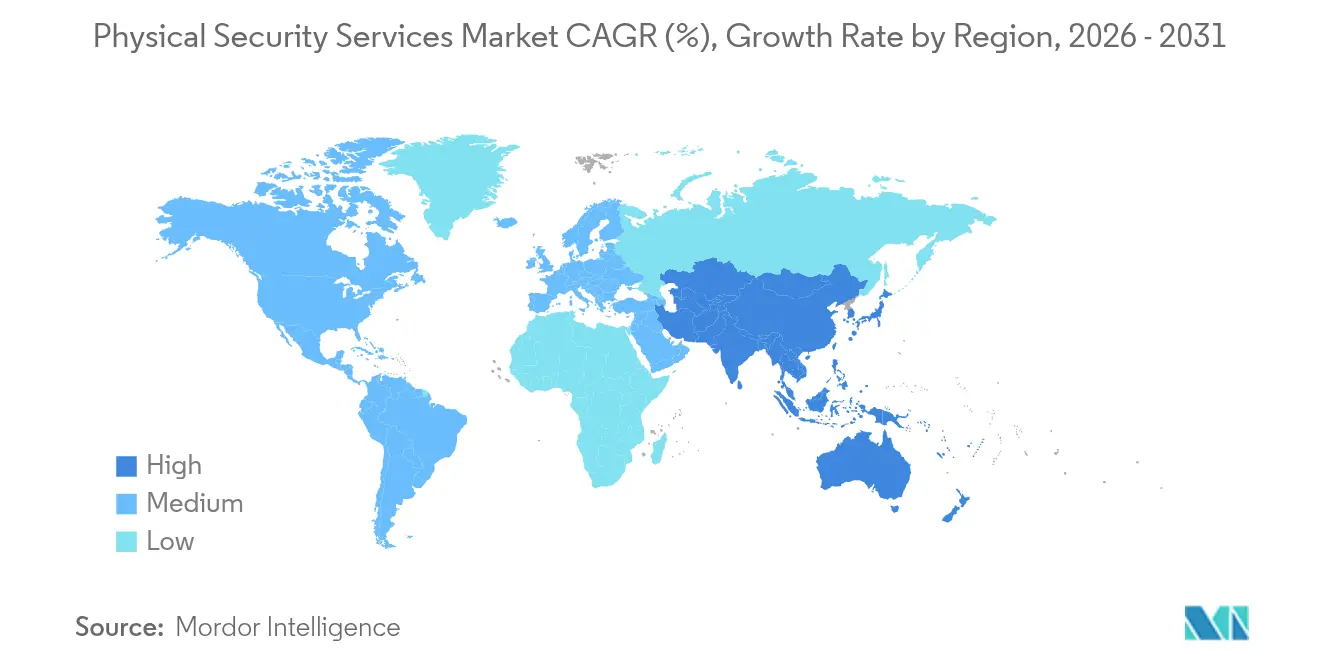
| Fastest Growing Market | Asia Pacific |
| Largest Market | North America |
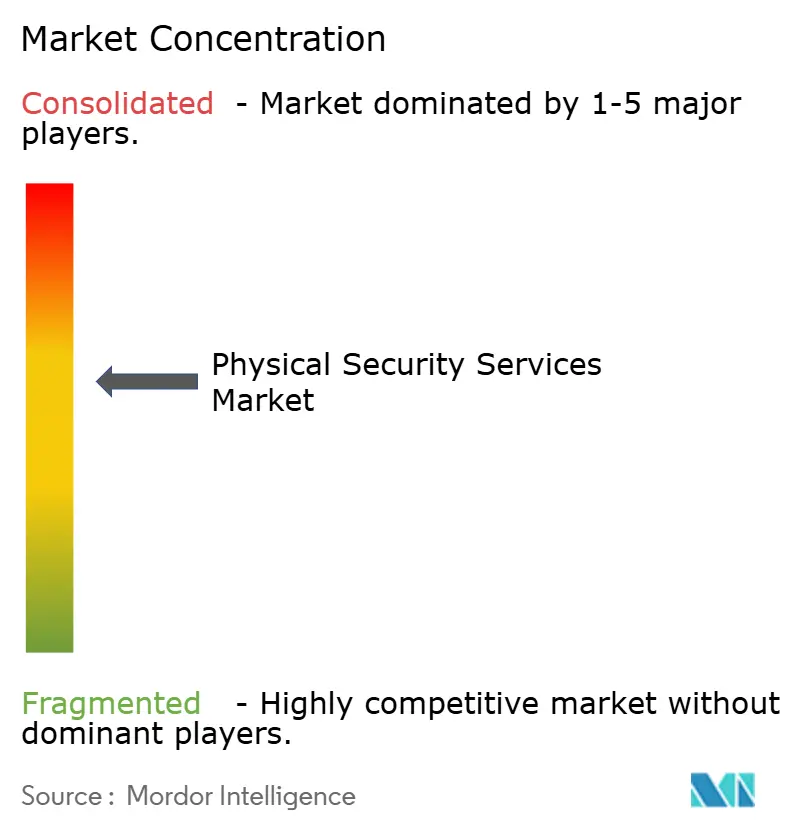
| Market Concentration | Medium |
Major Players *Disclaimer: Major Players sorted in no particular order Image © Mordor Intelligence. Reuse requires attribution under CC BY 4.0. | |
Physical Security Services Market Analysis by Mordor Intelligence
The physical security services market size was valued at USD 119.24 billion in 2025 and estimated to grow from USD 124.82 billion in 2026 to reach USD 156.88 billion by 2031, at a CAGR of 4.68% during the forecast period (2026-2031). The expansion is underpinned by the shift from guard-centric models to technology-enabled ecosystems that blend manned services with AI analytics, cloud video management, and cyber-physical convergence. Service providers weather economic cycles well, a point underscored by Allied Universal’s stable B3 corporate family rating even after multiple leveraged acquisitions, highlighting the sector’s recession-resilient profile. Demand is further buoyed by post-pandemic smart-facility retrofits, stricter labor-law enforcement that favors licensed operators, and rapid uptake of remote monitoring services that lower manpower intensity while expanding coverage.
Key Report Takeaways
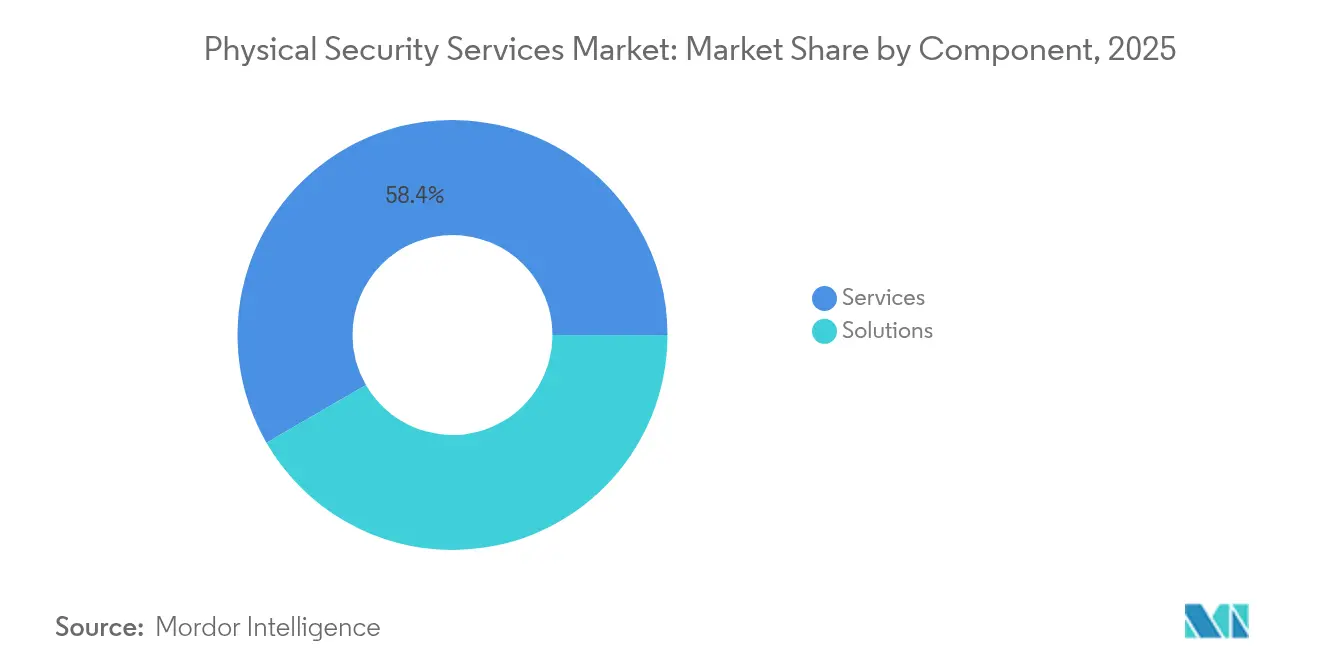
- By component, services accounted for 58.35% of the physical security services market share in 2025; solutions are projected to post the fastest 4.92% CAGR through 2031.
- By solutions, video surveillance systems led with 38.55% revenue share in 2025 and are slated to expand at a 5.35% CAGR to 2031.
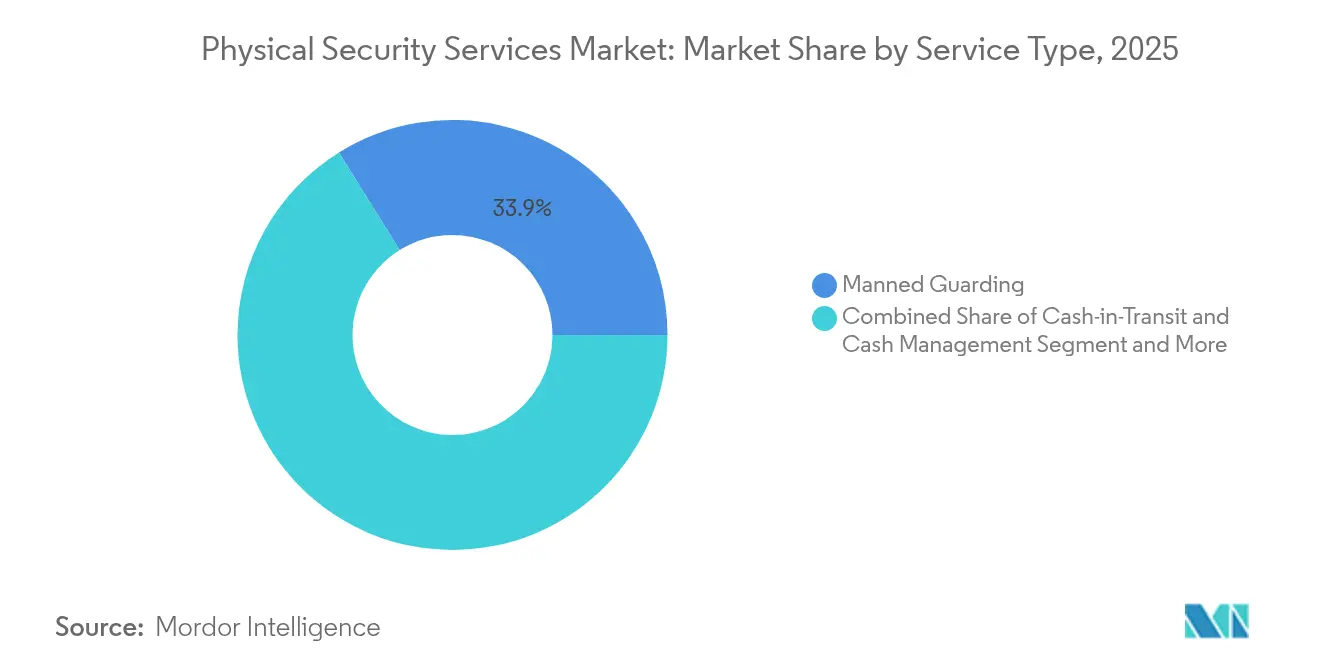
- By service type, manned guarding held 33.85% of the physical security services market size in 2025, while remote monitoring and response is growing at 5.55% CAGR.
- By end-user industry, commercial offices and data centers commanded 25.45% share in 2025; critical infrastructure is advancing at the quickest 5.45% CAGR.
- By geography, North America contributed 31.25% of 2025 revenue; Asia Pacific is forecast to record the strongest 5.02% CAGR.
Note: Market size and forecast figures in this report are generated using Mordor Intelligence’s proprietary estimation framework, updated with the latest available data and insights as of 2026.
Global Physical Security Services Market Trends and Insights
Drivers Impact Analysis*
| Driver | (~) % Impact on CAGR Forecast | Geographic Relevance | Impact Timeline |
|---|---|---|---|
| Convergence of physical SOC in data-rich verticals | +0.8% | Global, early adoption in North America and EU | Medium term (2-4 years) |
| Outsourcing of guarding to licensed players amid labour-law tightening | +0.6% | Global, strong in Europe and North America | Short term (≤ 2 years) |
| Hyperlocal cash logistics expansion in under-banked South America | +0.4% | South America, spillover to MEA | Medium term (2-4 years) |
| Post-COVID smart-facility retrofits driving remote monitoring | +0.7% | Global, concentration in developed markets | Short term (≤ 2 years) |
| ESG-linked security KPIs in commercial real-estate REITs | +0.3% | Primarily North America and EU | Long term (≥ 4 years) |
| Source: Mordor Intelligence | |||
Convergence of Physical SOC in Data-Rich Verticals
Enterprises are merging physical and cybersecurity operations centers, with analysts expecting 60% adoption by 2027.[1]Claro Enterprise Solutions, “Cyber-Physical Security – Integrated security defenses,” usclaro.com Data-center operators spearhead this shift because legacy perimeter controls cannot counter sophisticated blended threats. AI video analytics integrated with security information and event management platforms deliver unified incident visibility that cuts operating costs by 30% while improving response speed, as illustrated by Germains Seed Technology’s cloud-managed deployment.
Outsourcing of Guarding to Licensed Players amid Labour-Law Tightening
Tougher state and national licensing regimes—California’s background-check mandates and the Philippines’ Republic Act No. 11917 being prime examples—are raising compliance hurdles for informal operators. [2]Delta Protective Services, “Hiring Your Own Security Guards? Here's What California Law Says You Must Do,” deltaprotectiveservices.com Enterprises are mitigating liability by consolidating contracts with vendors that possess robust training programs and audit trails, accelerating industry consolidation and premium pricing for compliant firms.
Explosive Scale-up of Hyperlocal Cash Logistics in Under-Banked South America
Allied Universal’s inaugural Colombian acquisitions highlight rising demand for last-mile CIT solutions that support micro-retailers in cash-reliant economies.[3]Allied Universal, “Allied Universal Announces First Acquisitions in South America,” ausnewsroom.aus.com Technology such as Loomis SafePoint enables real-time processing at point of sale, improving security and reducing handling costs.
Post-COVID Smart-Facility Retrofits Driving Remote Monitoring
Legacy buildings are investing in IoT upgrades that blend security, HVAC, and energy controls; retrofits lower on-site headcount and shift surveillance to cloud platforms. Self-storage owners expect fully automated facilities within eight years, underscoring the momentum of remote management models.
Restraints Impact Analysis*
| Restraint | (~) % Impact on CAGR Forecast | Geographic Relevance | Impact Timeline |
|---|---|---|---|
| Shadow (unlicensed) guarding workforce under-cutting prices | -0.5% | Africa & Southeast Asia | Medium term (2-4 years) |
| GDPR-grade video data retention costs for European SMEs | -0.3% | Europe, regulatory spillover globally | Long term (≥ 4 years) |
| Chip-set supply volatility raising solution CAPEX | -0.4% | Global, acute impact in Asia-Pacific | Short term (≤ 2 years) |
| Cashless retail curtailing CIT growth in Nordics | -0.2% | Nordic countries | Long term (≥ 4 years) |
| Source: Mordor Intelligence | |||
Shadow (Unlicensed) Guarding Workforce Under-Cutting Prices in Africa and SEA
Weak regulatory oversight allows informal guards to bypass licensing, insurance, and training costs, keeping prices 15–20% below compliant operators in South Africa’s two-million-strong guard sector. Similar dynamics in Kenya and Tanzania depress margins and hinder investment in up-skilling.
GDPR-Grade Video Data Retention Costs for European SMEs
Small firms must store encrypted footage, document data flows, and service data-subject requests, inflating ownership costs by as much as 25% relative to non-GDPR regions. Managed video-as-a-service models are emerging as a cost-effective workaround, yet adoption hinges on vendor trust and proven compliance credentials.
*Our forecasts treat driver/restraint impacts as directional, not additive. The impact forecasts reflect baseline growth, mix effects, and variable interactions.
Segment Analysis
By Component: Solutions Drive Technology Integration
Solutions captured 41.65% of 2025 revenue while services retained 58.35% share. However, the solutions segment is set to clock a 4.92% CAGR, outpacing legacy manpower services as enterprises embrace integrated platforms that blend analytics, access, and incident management. Allied Universal’s acquisition of Unified Command exemplifies how incumbents are embedding technology to protect margins and differentiate.
Services remain indispensable for high-touch assignments, yet margins face wage and compliance pressures. Providers are mitigating this by bundling AI analytics and remote operations within guarding contracts, enabling outcome-based pricing that aligns with client risk appetites. Securitas, for instance, derived 32% of 2024 sales from technology and solutions, signalling a pivotal migration toward higher-value offerings.


By Solutions: Video Surveillance Systems Lead Innovation
Video surveillance systems accounted for 38.55% of 2025 spending and are forecast to grow at 5.35% CAGR, the highest among solution categories. AI-powered analytics convert cameras from passive recorders into proactive risk sensors, thereby catalysing replacement demand for ageing analogue fleets.
Access control is the runner-up, driven by biometric readers and mobile credentials that improve user convenience without sacrificing security. Perimeter detection, fire-life safety, and emerging drone and environmental sensors round out the portfolio, with unified platforms gaining favour for their single-pane-of-glass management. The chip shortage flagged by Hikvision continues to elevate camera lead times and pricing, nudging buyers toward cloud subscriptions that decouple analytics from proprietary hardware.
By Service Type: Remote Monitoring Transforms Delivery Models
Manned guarding still represents the largest slice at 33.85% in 2025, but remote monitoring and response are expanding fastest at 5.55% CAGR as centralized command centers supervise multiple facilities simultaneously. GardaWorld’s agreement to acquire Stealth Monitoring adds eight monitoring hubs and 100,000 cameras to its footprint, demonstrating scale advantages inherent in this model.
Cash-in-transit services remain critical in cash-heavy regions; Loomis posted 7.8% organic growth in 2023 aided by automated cash solutions. System integration, O&M, and consulting services are likewise resilient as organizations seek lifecycle guarantees for increasingly sophisticated deployments.
By End-User Industry: Critical Infrastructure Drives Growth
Commercial offices and data centers comprised the single largest vertical at 25.45% in 2025, yet the critical infrastructure is projected to grow the quickest at 5.45% CAGR as utilities confront cyber-physical threats that jeopardize grid stability. BFSI demand persists due to stringent compliance mandates, whereas retail is reinventing store protection for omnichannel fulfillment risks.
Transportation hubs are accelerating investment in automated screening and perimeter analytics that process high passenger throughput without congestion. Government, healthcare, and residential segments all make incremental gains as smart-building programs and community security schemes normalize integrated platforms over point solutions.
Geography Analysis
North America generated 31.25% of global revenue in 2025. The United States dominates spending thanks to federal critical infrastructure mandates and corporate security budgets that embrace premium licensing and background-check requirements. Allied Universal alone surpassed USD 21 billion in annual sales serving more than 400 Fortune 500 firms, illustrating the regional scale barrier to entry. Canada and Mexico add volume through manufacturing reshoring and logistics growth linked to near-shoring trends.
Asia Pacific is the fastest-growing territory at 5.02% CAGR to 2031. Rapid urbanisation, smart-city funding, and stricter national security rules fuel adoption in China, India, and ASEAN. The Philippines’ new licensing act levels the playing field for professional providers, while Japanese and South Korean corporates pioneer facial-recognition access and cloud video for dense urban campuses.
Europe is technologically mature yet highly regulated. GDPR raises ownership costs, nudging SMEs toward managed security subscriptions. Nordic countries advance cashless payment agendas that trim CIT volumes, though German, French, and UK firms continue to invest in ESG-aligned guarding frameworks. Market fragmentation persists but pan-regional roll-ups by Securitas and Prosegur are tipping share toward multinationals with proven compliance infrastructure.

Competitive Landscape
The physical security services market is moderately concentrated and consolidating. Allied Universal executed 24 transactions from 2022–24, adding USD 240 million in annual revenue in 2024 alone—a scale play that widens service coverage while deepening technology capabilities. GardaWorld’s USD 2 billion bid for Stealth Monitoring reflects a pivot toward AI video analytics, positioning the firm to monetise outcome-based remote surveillance contracts.
Incumbents are vertically integrating: Honeywell’s USD 4.95 billion purchase of Carrier’s access-solutions arm expands its hardware and software stack, while Bosch’s divestment of building-technologies to Triton realigns focus toward higher-margin industrial automation. Prosegur’s EUR 17 million (USD 18.4 million) Q1-2024 profit jump underscores how hybrid service-and-solution portfolios lift earnings resilience.
Physical Security Services Industry Leaders
Allied Universal (inc. G4S)
Securitas AB
Prosegur Compania de Seguridad S.A.
Secom Co., Ltd.
Brink’s Company
- *Disclaimer: Major Players sorted in no particular order

Recent Industry Developments
- February 2025: GardaWorld entered into a binding agreement to acquire Stealth Monitoring for approximately USD 2 billion, creating a global leader in AI-enabled mobile and fixed video monitoring security solutions. The transaction combines GardaWorld's international presence with Stealth Monitoring's technology platform that monitors over 100,000 cameras nightly across eight monitoring centers, expected to close in Q4 2025 pending regulatory approvals.
- February 2025: Allied Universal announced a USD 500 million add-on to its senior secured notes due 2031, with Moody's maintaining its B3 Corporate Family Rating and stable outlook. The proceeds will be used to pay down existing debt, supporting the company's continued acquisition strategy while maintaining financial flexibility for future growth initiatives
- February 2025: Prosegur reported consolidated net profit of EUR 17 million (USD 18.4 million) for Q1 2024, representing a 32% increase year-over-year, with total revenues reaching EUR 1.126 billion (USD 1.22 billion). The company's Prosegur Cash division achieved net profit of EUR 18 million (USD 19.4 million) while Prosegur Security sales increased 12.2% to EUR 585 million (USD 633.9 million), demonstrating strong performance across both service lines.
- January 2025: Honeywell completed its USD 4.95 billion acquisition of Carrier's Global Access Solutions business, adding significant brands to its security portfolio and enhancing its position in the access control and video surveillance markets.


Global Physical Security Services Market Report Scope
Physical security services are a crucial component of the broader security industry, encompassing a range of services designed to protect individuals, assets, and properties from physical threats. This market includes professional services and managed services that aim to prevent unauthorized access, theft, vandalism, and other security breaches.
The physical security services market is segmented by component (solution (access control system, video surveillance system, security scanning, metal detection, and imaging, fire and life safety, and others) and services (professional services and managed services)), end-user industry (manufacturing and industrial, IT and telecom, BFSI, retail, residential, public infrastructure (airports, etc.), and other end-user industries), and geography (North America, Europe, Asia, Australia and New Zealand, Latin America, and the Middle East and Africa). The market sizes and forecasts are provided in terms of value (USD) for all the above segments.
| Soultions |
| Services |
| Video Surveillance Systems |
| Access Control Systems |
| Perimeter Intrusion Detection Systems |
| Fire and Life-Safety Systems |
| Other Solutions |
| Manned Guarding |
| Cash-in-Transit (CIT) and Cash Management |
| Remote Monitoring and Response (VSaaS, ACaaS) |
| System Integration, OandM |
| Risk Consulting and Training |
| Other Services |
| Commercial Offices and Data Centers |
| BFSI |
| Retail and E-commerce |
| Industrial and Manufacturing |
| Critical Infrastructure (Energy and Utilities) |
| Transportation and Logistics (Airports, Ports, Rail) |
| Government and Defense |
| Healthcare |
| Residential |
| Other End-users |
| North America | United States | |
| Canada | ||
| Mexico | ||
| South America | Brazil | |
| Argentina | ||
| Rest of South America | ||
| Europe | Germany | |
| United Kingdom | ||
| France | ||
| Italy | ||
| Spain | ||
| Nordics | ||
| Rest of Europe | ||
| Asia-Pacific | China | |
| Japan | ||
| India | ||
| South Korea | ||
| ASEAN | ||
| Australia | ||
| New Zealand | ||
| Rest of Asia-Pacific | ||
| Middle East and Africa | Middle East | GCC |
| Turkey | ||
| Israel | ||
| Rest of Middle East | ||
| Africa | South Africa | |
| Nigeria | ||
| Egypt | ||
| Rest of Africa | ||
| By Component | Soultions | ||
| Services | |||
| By Solutions | Video Surveillance Systems | ||
| Access Control Systems | |||
| Perimeter Intrusion Detection Systems | |||
| Fire and Life-Safety Systems | |||
| Other Solutions | |||
| By Services Type | Manned Guarding | ||
| Cash-in-Transit (CIT) and Cash Management | |||
| Remote Monitoring and Response (VSaaS, ACaaS) | |||
| System Integration, OandM | |||
| Risk Consulting and Training | |||
| Other Services | |||
| By End-User Industry | Commercial Offices and Data Centers | ||
| BFSI | |||
| Retail and E-commerce | |||
| Industrial and Manufacturing | |||
| Critical Infrastructure (Energy and Utilities) | |||
| Transportation and Logistics (Airports, Ports, Rail) | |||
| Government and Defense | |||
| Healthcare | |||
| Residential | |||
| Other End-users | |||
| By Geography | North America | United States | |
| Canada | |||
| Mexico | |||
| South America | Brazil | ||
| Argentina | |||
| Rest of South America | |||
| Europe | Germany | ||
| United Kingdom | |||
| France | |||
| Italy | |||
| Spain | |||
| Nordics | |||
| Rest of Europe | |||
| Asia-Pacific | China | ||
| Japan | |||
| India | |||
| South Korea | |||
| ASEAN | |||
| Australia | |||
| New Zealand | |||
| Rest of Asia-Pacific | |||
| Middle East and Africa | Middle East | GCC | |
| Turkey | |||
| Israel | |||
| Rest of Middle East | |||
| Africa | South Africa | ||
| Nigeria | |||
| Egypt | |||
| Rest of Africa | |||


Key Questions Answered in the Report
What is the current value of the physical security services market?
The physical security services market is valued at USD 124.82 billion in 2026, with a projected rise to USD 156.88 billion by 2031.
Which solution category is growing fastest?
AI-enabled video surveillance systems lead solution growth with a 5.35% CAGR through 2031.
Why are remote monitoring services expanding quickly?
Centralised monitoring centres lower labour costs and extend coverage, driving a 5.55% CAGR for remote monitoring and response services.
Which end-user segment shows the strongest growth outlook?
Critical infrastructure applications are expected to advance at a 5.45% CAGR as utilities defend against cyber-physical threats.
Page last updated on:


