Physical Security Market Size and Share
Market Overview
| Study Period | 2020 - 2031 |
|---|---|
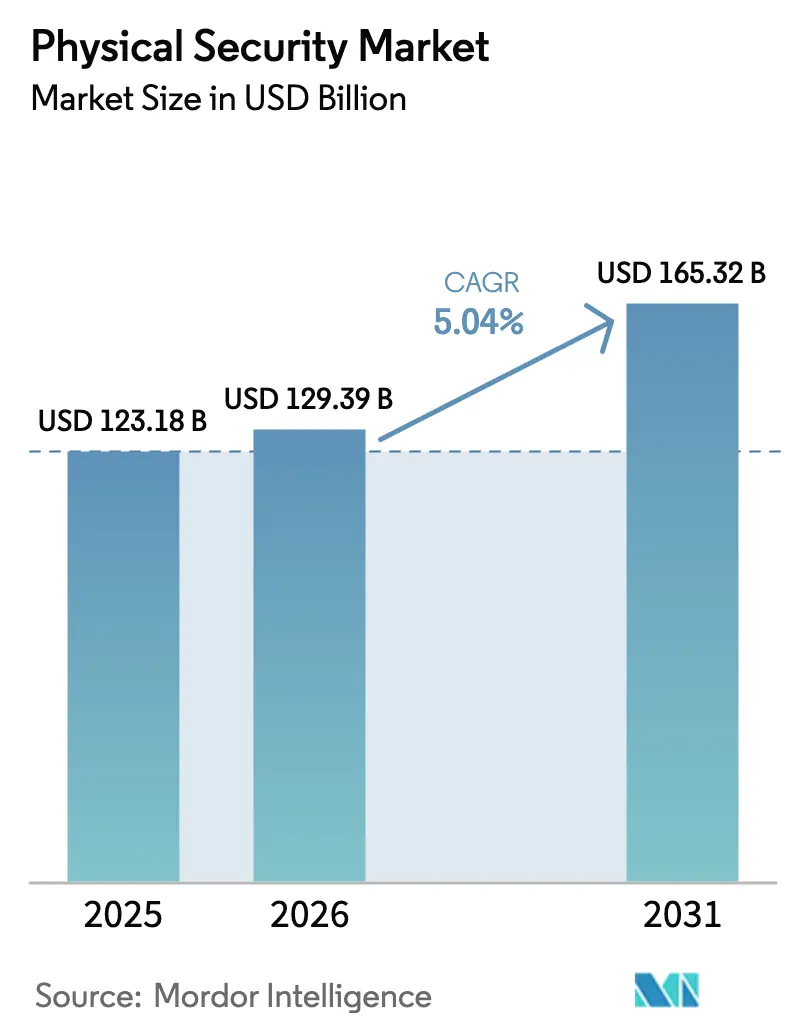
| Market Size (2026) | USD 129.39 Billion |
| Market Size (2031) | USD 165.32 Billion |
| Growth Rate (2026 - 2031) | 5.04% CAGR |
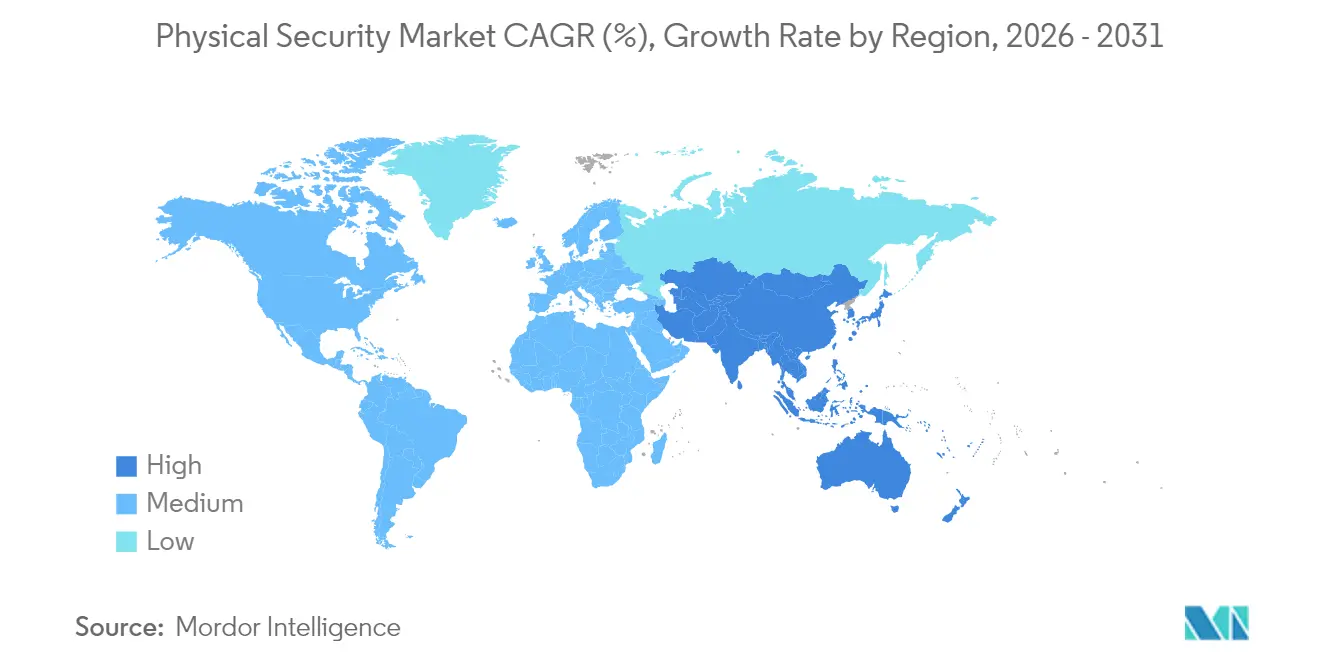
| Fastest Growing Market | Asia Pacific |
| Largest Market | North America |
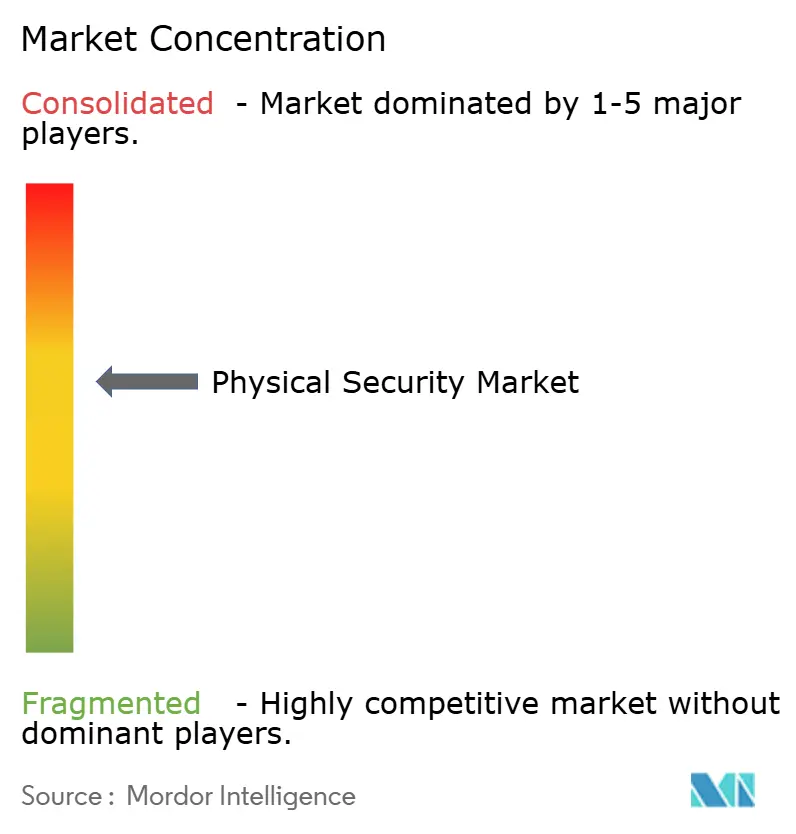
| Market Concentration | Medium |
Major Players *Disclaimer: Major Players sorted in no particular order Image © Mordor Intelligence. Reuse requires attribution under CC BY 4.0. | |
Physical Security Market Analysis by Mordor Intelligence
The Physical Security market size is expected to grow from USD 123.18 billion in 2025 to USD 129.39 billion in 2026 and is forecast to reach USD 165.32 billion by 2031 at 5.04% CAGR over 2026-2031.
Tight regulatory regimes, accelerating urbanization, and enterprise-wide digital transformation initiatives sustain steady spending even as vendors replace banned equipment and migrate workloads to the cloud. AI-infused analytics, edge computing, and mobile credentials expand use cases beyond traditional perimeter defense, spurring incremental demand from both public agencies and private operators. Rising insurance incentives for connected surveillance, ESG-linked financing for low-power devices, and mandatory supply-chain certifications promote continuous hardware refresh cycles that favor providers with compliance-ready portfolios. Intensifying competition around cloud deployment models shifts value creation toward recurring service revenue, while data-residency mandates compel vendors to localize hosting infrastructure or partner with regional providers, adding new layers of strategic complexity to the physical security market.
Key Report Takeaways
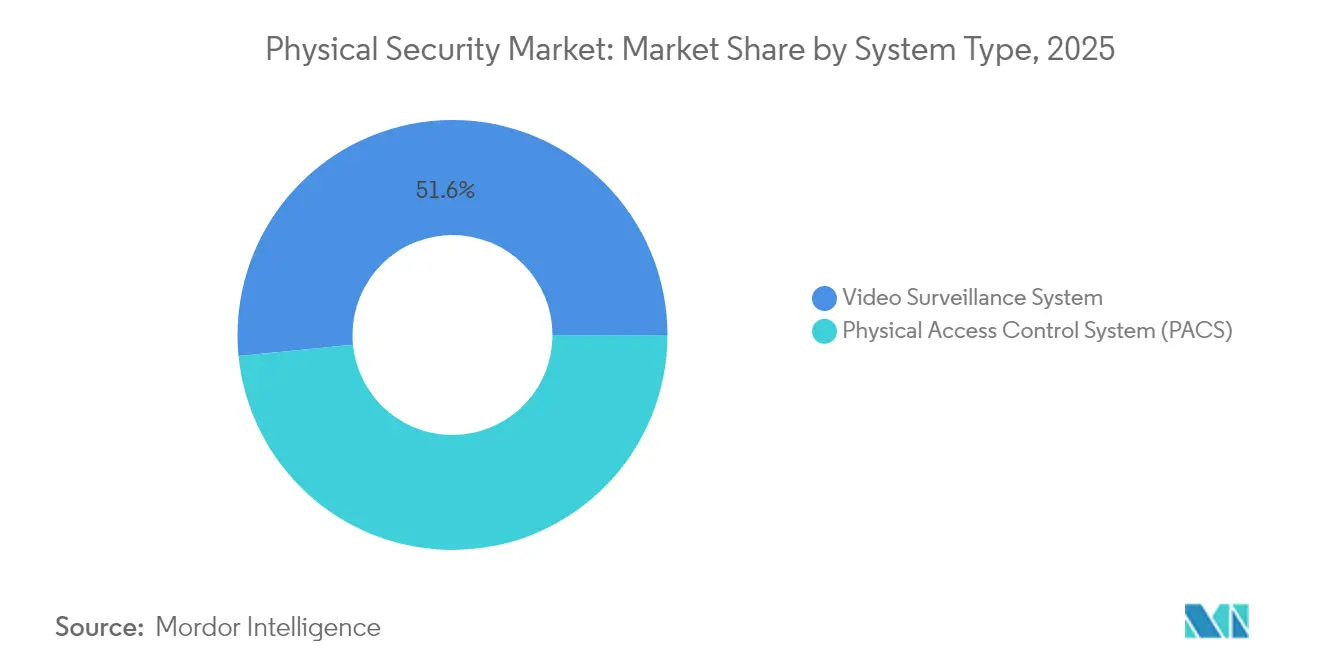
- By system type, video surveillance led with 51.55% revenue share of the physical security market in 2025; biometric systems hold the fastest projected expansion at a 6.55% CAGR to 2031.
- By service type, video-surveillance-as-a-service accounted for 61.45% of the physical security market share in 2025, while access-control-as-a-service is poised for the highest CAGR at 6.85% through 2031.
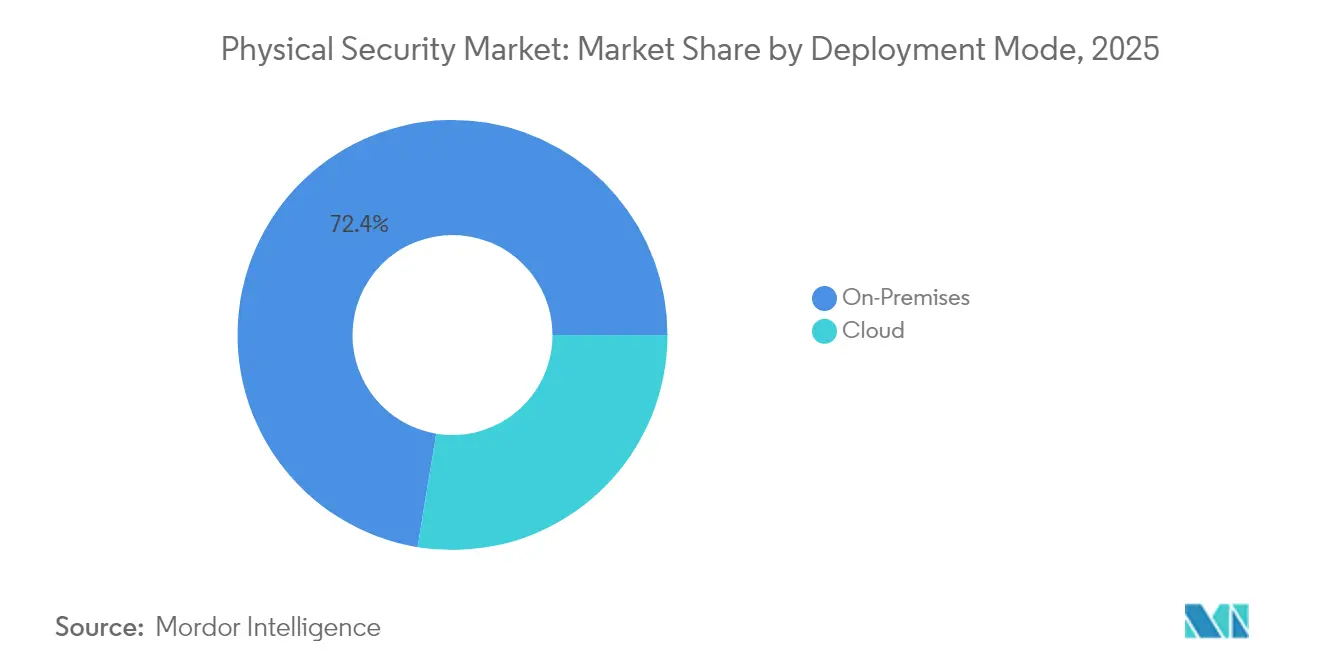
- By deployment, on-premises solutions retained 72.40% of the physical security market in 2025; cloud deployment is forecast to rise at a 6.58% CAGR by 2031.
- By organization size, large enterprises commanded 67.20% of the physical security market size in 2025, yet small and medium enterprises will grow fastest at a 7.15% CAGR to 2031.
- By end-user industry, government services captured 29.10% of the physical security market share in 2025, whereas residential applications will register the highest 5.95% CAGR in the same horizon.
- By geography, North America remained the largest regional contributor with 33.90% share of the physical security market in 2025; Asia is expected to record the strongest 7.10% CAGR through 2031.
Note: Market size and forecast figures in this report are generated using Mordor Intelligence’s proprietary estimation framework, updated with the latest available data and insights as of 2026.
Global Physical Security Market Trends and Insights
Drivers Impact Analysis*
| Driver | (≈) % Impact on CAGR Forecast | Geographic Relevance | Impact Timeline |
|---|---|---|---|
| Mandated supply-chain security audits fuelling PACS upgrades | +1.1% | North America | Medium term (2-4 years) |
| EU AI Act transparency clauses accelerating real-time video analytics refresh | +0.8% | Europe | Short term (≤ 2 years) |
| China Smart-City 4.0 allocating RMB 200 billion to edge surveillance nodes | +0.7% | Asia | Long term (≥ 4 years) |
| Oil-and-gas perimeter breaches triggering multi-sensor fence projects | +0.6% | Middle East | Medium term (2-4 years) |
| Insurance premium discounts for cloud-connected surveillance at logistics hubs | +0.5% | Global | Short term (≤ 2 years) |
| ESG-linked financing rewarding zero-carbon PoE security devices | +0.4% | Global | Long term (≥ 4 years) |
| Source: Mordor Intelligence | |||
Mandated Supply-Chain Security Audits Fuelling PACS Upgrades
Federal agencies face heightened scrutiny over supply-chain integrity, prompting accelerated replacement of legacy physical access control systems with vetted, interoperable solutions that meet General Services Administration procurement protocols. The oversight ripple extends to critical-infrastructure operators and private contractors, multiplying demand for certified products and favoring suppliers that can document trusted component provenance. Organizations that pre-qualify under the new guidelines secure competitive advantages in government tenders while avoiding remediation penalties [1]General Services Administration, “Physical Access Control Systems (PACS) Customer Ordering Guide,” gsa.gov.
EU AI Act Transparency Clauses Accelerating Real-Time Video Analytics Refresh
The EU AI Act effective August 2024 classifies biometric video analytics as high-risk AI, compelling vendors to supply risk assessments, explainable-AI logs, and GDPR-aligned data governance. Enterprises must refresh non-compliant analytics stacks or face regulatory fines, driving short-cycle upgrade projects and propelling demand for platforms engineered with built-in transparency features.
Oil & Gas Perimeter Breaches Trigger Multi-Sensor Fence Projects
Energy producers in the Middle East are integrating thermal cameras, radar, and distributed acoustic sensing (DAS) into unified perimeter platforms after recent intrusion attempts underscored the limits of single-technology defenses. PhotoniX journal findings document that DAS can cut unauthorised entry incidents by up to ninety % when combined with machine-learning classifiers. Operators that previously invested mainly in cyber resilience now allocate parallel budgets to fence-line upgrades because interruption of pipeline flow carries both revenue and geopolitical risk. Integrators report that early adopters recoup capital outlays through lower patrol costs and insurance savings, a feedback loop that accelerates follow-on orders.
ESG-Linked Financing Rewarding Zero-Carbon PoE Security Devices
Green-bond frameworks increasingly include performance triggers tied to energy consumption of installed hardware. Manufacturers offering low-wattage PoE cameras and net-zero production footprints qualify buyers for preferential interest rates. Facility managers can therefore re-allocate capital budgets to accelerated device replacement while simultaneously advancing corporate sustainability scorecards, tightening the link between environmental commitments and physical-security procurement.
Restraints Impact Analysis*
| Restraint | (~) % Impact on CAGR Forecast | Geographic Relevance | Impact Timeline |
|---|---|---|---|
| FCC bans on Chinese OEMs delaying municipal roll-outs | -0.9% | North America | Short term (≤ 2 years) |
| GDPR/Schrems II data-residency liabilities inflating VSaaS TCO | -0.6% | Europe | Medium term (2-4 years) |
| Skilled labor shortages slowing project execution | -0.4% | Middle East and Africa | Medium term (2-4 years) |
| Export restrictions limiting Chinese vendor shipments to certain markets | -0.3% | Global | Short term (≤ 2 years) |
| Source: Mordor Intelligence | |||
GDPR/Schrems II Data-Residency Liabilities Inflating VSaaS TCO
European cloud surveillance adopters allocate higher budgets to local data-center hosting, encryption key management, and continuous compliance audits. Service providers absorb infrastructure outlays and then pass through fees, elevating total cost of ownership and slowing uptake among resource-limited SMEs [2]European Parliament and Council, “Regulation (EU) 2024/1689 … on artificial intelligence,” eur-lex.europa.eu .
FCC Bans on Chinese OEMs Delaying Municipal Roll-Outs
The 2024-2025 prohibition on Chinese surveillance equipment disrupts city-level procurement cycles, raising unit costs and extending project timelines as municipalities pivot to alternative suppliers. Budget-constrained local bodies must re-bid contracts, perform new interoperability tests, and navigate federal grant applications, temporarily depressing shipment volumes in the North American portion of the physical security market.
*Our forecasts treat driver/restraint impacts as directional, not additive. The impact forecasts reflect baseline growth, mix effects, and variable interactions.
Segment Analysis
By System Type: Video Surveillance Dominance Amid Biometric Acceleration
Video surveillance systems contributed USD 63.51 billion of the physical security market size in 2025, equivalent to 51.55% share. Persistent deployment across transport hubs, city centers, and enterprise campuses underpins steady revenue, yet replacement demand is now tied to AI-ready cameras and edge recorders. Biometric platforms advance at a 6.55% CAGR, propelled by national digital-ID programs and workplace passwordless strategies. As credentials migrate to smartphones and wearables, multimodal readers gain traction, deepening ecosystem integration. Physical access control retains stable growth on the back of mandated government upgrades that standardize communication protocols and reduce siloed infrastructure. Hybrid IP-analog transition phases lengthen sales cycles but preserve margins on encoders and gateways.Second-generation perimeter security unites radar, fiber optic sensors, and thermal imaging to defend oil, gas, and airport assets. Interoperability initiatives, notably the Physical Security Interoperability Alliance PKOC framework, permit open credentials and cut vendor lock-in, stimulating competitive differentiation through software features over proprietary hardware.


By Service Type: VSaaS Leadership Challenged by ACaaS Growth
Video-surveillance-as-a-service generated USD 30.71 billion in 2025, reflecting 61.45% of the service sub-segment inside the physical security market. Recurring subscription bundles with AI analytics, remote health monitoring, and instant firmware patching resonate with cash-aware customers. Access-control-as-a-service expands faster at 6.85% CAGR through 2031, leveraging single sign-on synchronization and zero-trust mandates. Integrations with HR databases enable automated onboarding and off-boarding, trimming administrative overhead. Providers position these cloud suites as OpEx solutions that accelerate ROI while embedding compliance reporting dashboards. Data-localization laws remain the chief adoption barrier, especially for multinational corporations with distributed European operations.
By Deployment: On-Premises Prevalence Amid Cloud Migration
On-premises installations occupied 72.40% of the physical security market in 2025. High-security environments defense, nuclear, and regulated finance, retain local servers to safeguard classified footage and metadata. Even so, remote firmware orchestration and analytics increasingly shift to private-cloud extensions. Cloud deployment, though smaller, will rise at a 6.58% CAGR as machine-learning-as-a-service lowers analytic thresholds and ML model updates distribute instantly. Hybrid models dominate transition strategies, letting enterprises process sensitive streams onsite while exporting anonymized data for pattern recognition in the cloud. Compliance frameworks such as the EU Radio Equipment Directive amplify preference for certified cloud infrastructures that pre-package cybersecurity controls.
Geography Analysis
North America generated USD 41.77 billion in 2025, equal to 33.90% of the physical security market. Federal procurement mandates, the FEMA equipment-replacement grant, and widespread adoption of AI video analytics bolster demand despite procurement bottlenecks created by FCC bans on Chinese OEMs. Enterprises allocate upgrade budgets to avoid non-compliance penalties and to harden critical infrastructure. Cloud migration in the region accelerates because hyperscale data centers provide FedRAMP-authorized environments, reducing accreditation cycles for government contractors.
Asia-Pacific represents the fastest advancing territory at a 7.10% CAGR to 2031. China’s RMB 200 billion Smart-City 4.0 program catalyzes edge analytics nodes and smart traffic initiatives, setting de facto standards exportable to regional peers. India’s logistics corridor surveillance, paired with Southeast Asian metro-rail expansion, underwrites multi-year project pipelines. Indigenous manufacturing offers cost leverage, although export licensing constraints limit addressable markets for some Chinese vendors.
Europe maintains a balanced trajectory as GDPR and the AI Act recalibrate solution selection criteria. The physical security market size for compliant AI video analytics is climbing because organizations must document algorithmic decisions and keep biometric data on EU soil. Providers re-architect hosting footprints or spin up sovereign-cloud alliances to meet Schrems II conditions, passing costs to customers yet ensuring uninterrupted service.
Mordor Intelligence provides coverage of the physical security market across other key regional markets, including North America, Europe, Asia, and South America, each with their regulatory frameworks and demand patterns.

Competitive Landscape
The top five manufacturers together hold roughly 42% of the physical security market, indicating a moderately consolidated arena with persistent room for niche disruptors. Established groups concentrate on embedding AI chipsets, cloud orchestration layers, and open-standard protocols to lock in platform stickiness. Johnson Controls, Honeywell, and Axis Communications integrate physical and cyber alerts into unified incident-response dashboards, reinforcing enterprise loyalty. Assa Abloy and HID Global diversify into mobile credentials and digital wallets to pre-empt fintech encroachment into access control.
Regulatory turbulence prompts selective M&A as scale players scoop up AI analytics specialists or regional distributors to close compliance capability gaps. The Vision-Box and Onfido takeovers illustrate a pivot toward end-to-end digital identity stacks that blend biometric verification with travel and fintech workflows. Patent filings on federated-learning-based object detection and low-power PoE expand defensible IP moats. Startups differentiate via specialized analytics hazardous-gas leak detection, forklift-collision avoidance then partner with integrators for channel reach. Suppliers stressing open-architecture hardware reduce customer switching costs but must reinvent margin models through software licensing and analytics subscriptions.
Physical Security Industry Leaders
Cisco Systems, Inc.
Honeywell International Inc.
Johnson Controls
TELUS
Genetec Inc.
- *Disclaimer: Major Players sorted in no particular order

Recent Industry Developments
- March 2025: JPMorgan Chase led a EUR 36 million (USD 38.5 million) Series B funding round for Eye Security to scale 24/7 monitoring and cyber-insurance bundles ahead of the NIS2 directive rollout. The capital injection positions Eye Security to bundle physical intrusion data with cyber telemetry, creating a unified risk-scoring proposition
- February 2025: The U.S. Court of Appeals upheld FCC authority to ban Hikvision equipment approvals, confirming long-term substitution opportunities for compliant vendors and reinforcing geopolitical risk premiums in the physical security market.
- January 2025: CISA released updated Facility Security Plan guidelines that codify standardized threat-assessment matrices and prescribe layered protection strategies, raising baseline hardware and service requirements for federal agencies.
- December 2024: Amadeus acquired Vision-Box and Entrust purchased Onfido, signaling strategic moves toward integrated biometric identity orchestration for travel and remote onboarding use cases


Global Physical Security Market Report Scope
Physical security protects individuals, property, and tangible assets from potential damage or loss. While these systems share similarities with logical access control, their primary focus is protecting information and physical spaces.
The study tracks the revenue accrued through the sale of physical security solutions by various players across the globe. it also tracks the key market parameters, underlying growth influencers, and major vendors operating in the industry, which supports the market estimations and growth rates over the forecast period. The study further analyses the overall impact of COVID-19 aftereffects and other macroeconomic factors on the market. The report’s scope encompasses market sizing and forecasts for the various market segments.
Physical Security market is segmented by type system type (video surveillance system [IP surveillance, analog surveillance, and hybrid surveillance], physical access control system (PACS), biometric system, perimeter security, and intrusion detection), by service type (Access Control-as-a-Service (ACaaS) and Video Surveillance-as-a-Service (VSaaS)), by type of deployment (on-premises and cloud), organization size (SMEs and large enterprises), by end-user industry (government services, banking and financial services, IT and telecommunications, transportation and logistics, retail, healthcare, residential, and other end-user industries), by Geography (North America, Europe, Asia Pacific, Latin America, Middle East and Africa). The market sizes and forecasts are provided in terms of value (USD) for all the above segments.
| Systems |
| Services |
| Video Surveillance System | IP Surveillance |
| Analog Surveillance | |
| Hybrid Surveillance | |
| Physical Access Control System (PACS) | |
| Biometric System | |
| Perimeter Security | |
| Intrusion Detection |
| Video Surveillance-as-a-Service (VSaaS) |
| Access Control-as-a-Service (ACaaS) |
| On-Premises |
| Cloud |
| SMEs |
| Large Enterprises |
| Government Services |
| Banking and Financial Services |
| IT and Telecommunications |
| Transportation and Logistics |
| Retail |
| Healthcare |
| Residential |
| Other End-User Industries |
| North America | United States | |
| Canada | ||
| Mexico | ||
| South America | Brazil | |
| Argentina | ||
| Rest of South America | ||
| Europe | Germany | |
| United Kingdom | ||
| France | ||
| Nordics (Sweden, Norway, Finland, Denmark) | ||
| Rest of Europe | ||
| Asia Pacific | China | |
| Japan | ||
| India | ||
| South Korea | ||
| ASEAN | ||
| Australia | ||
| New Zealand | ||
| Rest of Asia Pacific | ||
| Middle East and Africa | Middle East | GCC |
| Turkey | ||
| Israel | ||
| Rest of Middle East | ||
| Africa | South Africa | |
| Nigeria | ||
| Egypt | ||
| Rest of Africa | ||
| By Component | Systems | ||
| Services | |||
| By System Type | Video Surveillance System | IP Surveillance | |
| Analog Surveillance | |||
| Hybrid Surveillance | |||
| Physical Access Control System (PACS) | |||
| Biometric System | |||
| Perimeter Security | |||
| Intrusion Detection | |||
| By Service Type | Video Surveillance-as-a-Service (VSaaS) | ||
| Access Control-as-a-Service (ACaaS) | |||
| By Deployment | On-Premises | ||
| Cloud | |||
| By Organization Size | SMEs | ||
| Large Enterprises | |||
| By End-User Industry | Government Services | ||
| Banking and Financial Services | |||
| IT and Telecommunications | |||
| Transportation and Logistics | |||
| Retail | |||
| Healthcare | |||
| Residential | |||
| Other End-User Industries | |||
| By Geography | North America | United States | |
| Canada | |||
| Mexico | |||
| South America | Brazil | ||
| Argentina | |||
| Rest of South America | |||
| Europe | Germany | ||
| United Kingdom | |||
| France | |||
| Nordics (Sweden, Norway, Finland, Denmark) | |||
| Rest of Europe | |||
| Asia Pacific | China | ||
| Japan | |||
| India | |||
| South Korea | |||
| ASEAN | |||
| Australia | |||
| New Zealand | |||
| Rest of Asia Pacific | |||
| Middle East and Africa | Middle East | GCC | |
| Turkey | |||
| Israel | |||
| Rest of Middle East | |||
| Africa | South Africa | ||
| Nigeria | |||
| Egypt | |||
| Rest of Africa | |||


Key Questions Answered in the Report
What is the current size of the physical security market?
The physical security market is valued at USD 129.39 billion in 2026 and is projected to reach USD 165.32 billion by 2031.
Which system type generates the most revenue today?
Video surveillance systems command 51.55% of 2025 revenue and remain the backbone of most integrated security deployments.
Why is cloud deployment growing faster than on-premises solutions?
Cloud platforms lower upfront capital outlays, deliver AI analytics at scale, and simplify remote management, resulting in a 6.58% CAGR forecast for cloud deployment through 2031.
How do recent FCC bans affect North American buyers?
Municipalities must replace banned Chinese equipment with compliant alternatives, increasing procurement costs and causing short-term project delays while creating new openings for vetted suppliers.
Page last updated on:


