Digital Printing Market Size and Share
Market Overview
| Study Period | 2020 - 2031 |
|---|---|
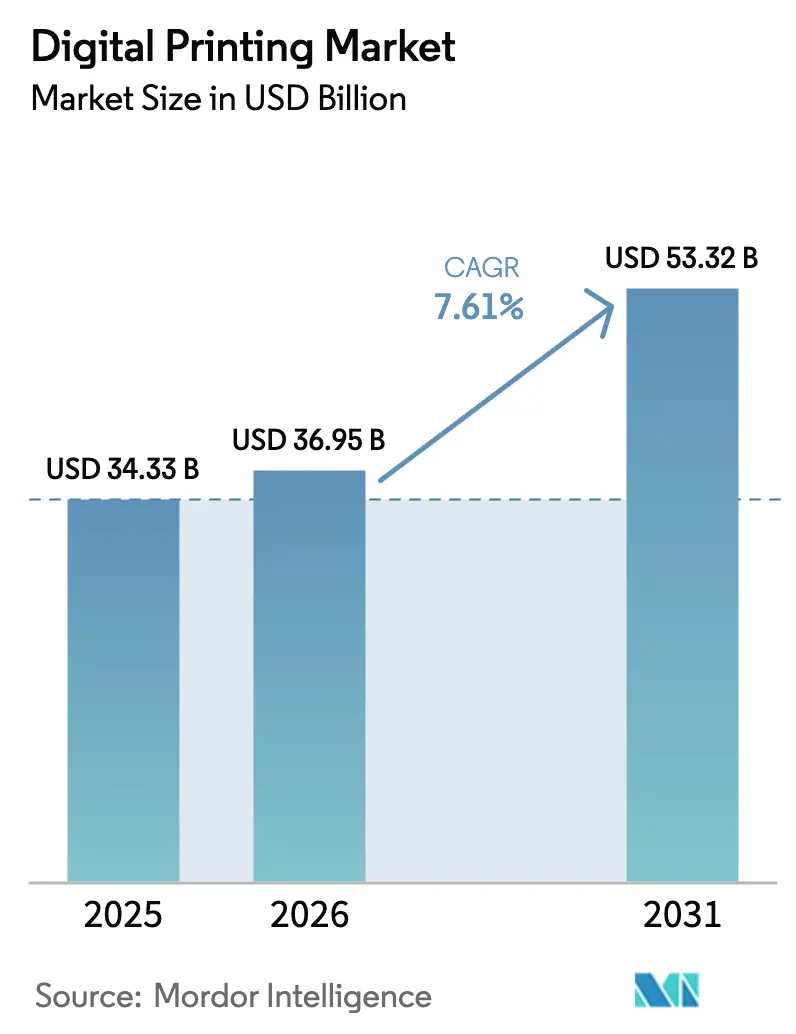
| Market Size (2026) | USD 36.95 Billion |
| Market Size (2031) | USD 53.32 Billion |
| Growth Rate (2026 - 2031) | 7.61% CAGR |
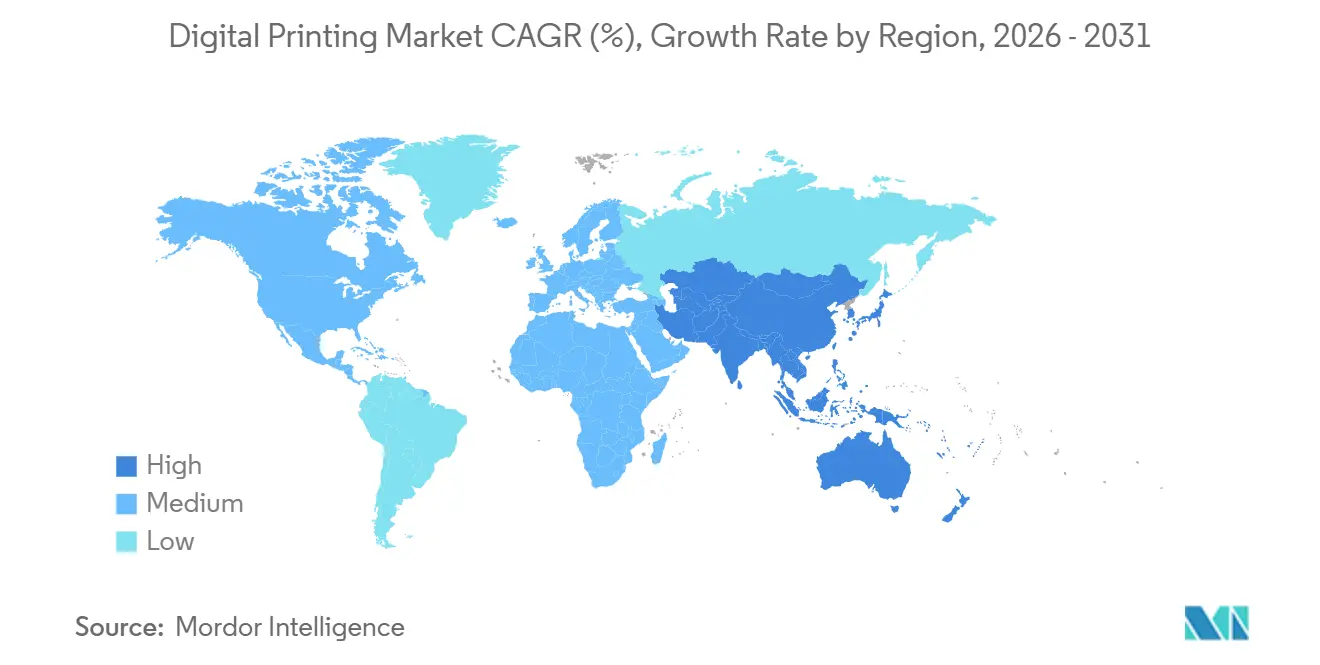
| Fastest Growing Market | Asia Pacific |
| Largest Market | Asia Pacific |
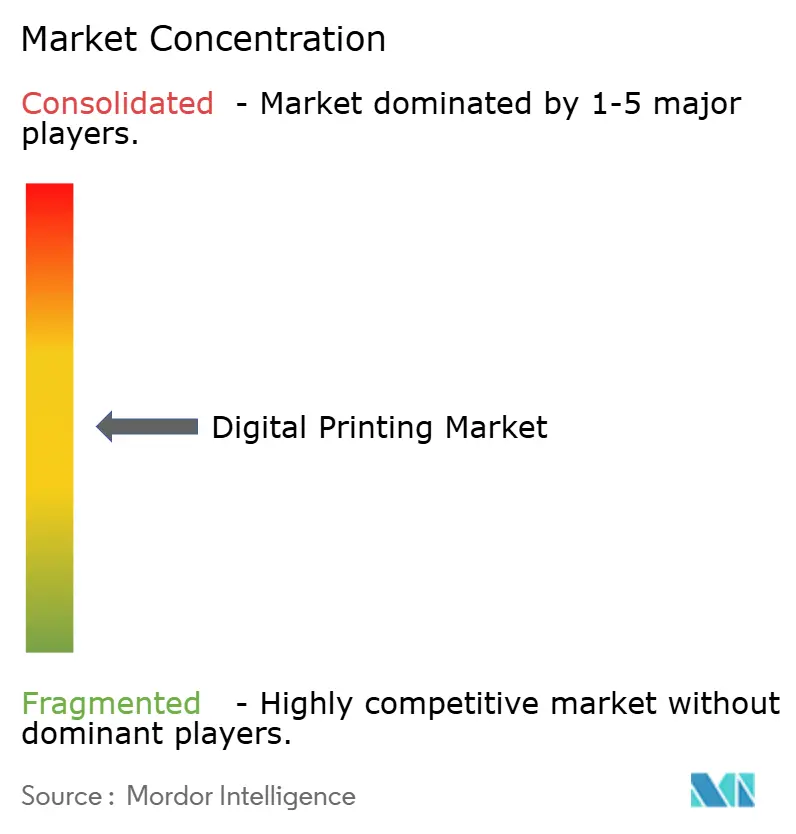
| Market Concentration | Medium |
Major Players *Disclaimer: Major Players sorted in no particular order Image © Mordor Intelligence. Reuse requires attribution under CC BY 4.0. | |
Digital Printing Market Analysis by Mordor Intelligence
The Digital Printing Market size is expected to increase from USD 34.33 billion in 2025 to USD 36.95 billion in 2026 and reach USD 53.32 billion by 2031, growing at a CAGR of 7.61% over 2026-2031.
Momentum is coming from e-commerce brands that require personalized packaging inside 24 hours, AI-enabled prepress tools that make micro-batch runs economical, and new European Union rules forcing a pivot away from solvent-based analog presses. Semiconductor shortages that lengthen press delivery lead times, combined with per- and polyfluoroalkyl substance reformulations, are slowing some purchasing decisions, yet converters that invest now are winning variable-data contracts once impossible at runs under 5,000 units. Paperboard remains the core substrate, but high-growth niches include direct-to-fabric garment lines and flexible packaging that embeds track-and-trace codes. Market leaders are acquiring printhead know-how, tightening their grip on consumables, and bundling AI-driven workflow software to defend margins against fast-moving disruptors.
Key Report Takeaways
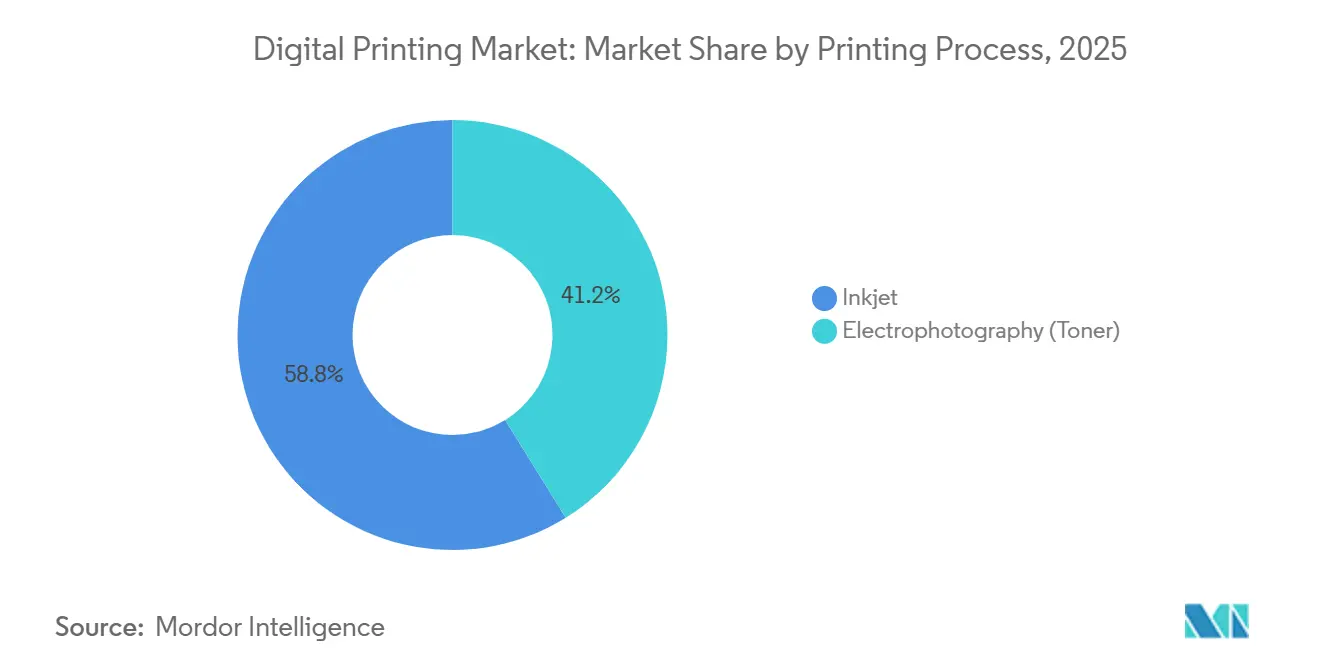
- By printing process, inkjet commanded 58.83% revenue share in 2025; electrophotography is forecast to trail as inkjet grows at an 8.44% CAGR through 2031.
- By ink type, UV-curable formulations held 31.74% of the digital printing market share in 2025, while LED-UV variants are projected to expand at an 8.14% CAGR to 2031.
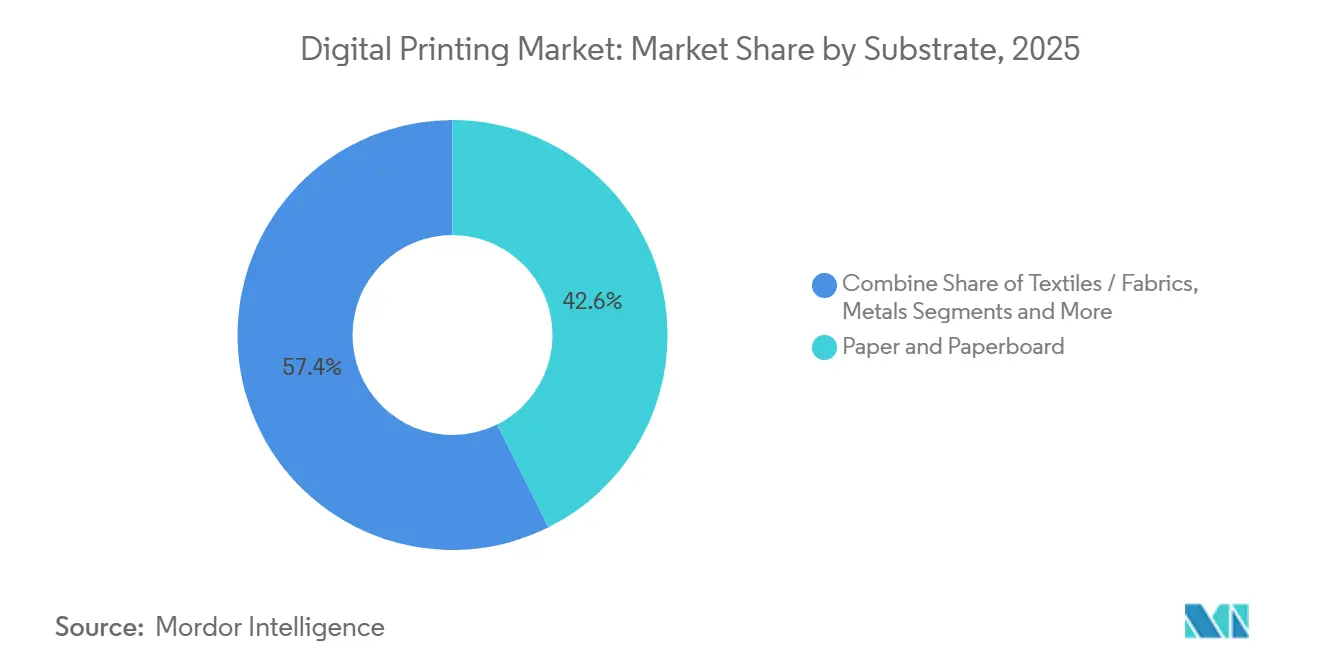
- By substrate, paper and paperboard captured 42.63% share of the digital printing market size in 2025; textiles and fabrics are expected to post the fastest 8.23% CAGR between 2026 and 2031.
- By application, packaging contributed 30.73% of 2025 revenue, whereas textile printing is set to advance at an 8.06% CAGR through 2031.
- By geography, Asia Pacific accounted for 38.73% of 2025 revenue in the digital printing market and is on track for an 8.32% CAGR to 2031.
Note: Market size and forecast figures in this report are generated using Mordor Intelligence’s proprietary estimation framework, updated with the latest available data and insights as of January 2026.
Global Digital Printing Market Trends and Insights
Drivers Impact Analysis*
| Driver | (~) % Impact on CAGR Forecast | Geographic Relevance | Impact Timeline |
|---|---|---|---|
| Booming short-run customized packaging demand | +1.8% | Global, with concentration in North America, Europe, and Asia Pacific e-commerce hubs | Medium term (2-4 years) |
| Declining per-unit print cost and faster turnaround | +1.5% | Global, particularly benefiting small and medium converters in Europe and North America | Short term (≤ 2 years) |
| Rapid AI-enabled workflow automation for micro-batch orders | +1.3% | North America and Europe early adopters, expanding to Asia Pacific | Medium term (2-4 years) |
| Expansion of digital-textile micro-factories in European Union and United States | +1.1% | Europe (Portugal, Italy, Spain) and United States (North Carolina, California), with spillover to Vietnam and Bangladesh | Long term (≥ 4 years) |
| Rising demand for sustainable inks and recyclable substrates | +1.0% | Europe leading due to regulatory mandates, followed by North America and select Asia Pacific markets | Long term (≥ 4 years) |
| E-commerce-led surge in on-demand packaging and label printing | +1.2% | Asia Pacific (China, India, ASEAN), North America, and Europe | Short term (≤ 2 years) |
| Source: Mordor Intelligence | |||


Booming Short-Run Customized Packaging Demand
Global parcel volumes keep rising as direct-to-consumer retail embeds itself in everyday shopping, driving converters toward press setups that economically handle sub-1,000-unit packaging jobs. Canon’s varioPrint iX-series reduces changeover time to three minutes, allowing mid-size folding-carton plants to run up to 20 artwork versions during a single shift.[1]Canon Inc., “varioPrint iX Series Product Launch,” Canon Global Newsroom, global.canon High-mix production helps beauty and nutraceutical brands test seasonal SKUs without carrying dead inventory. The United States Postal Service logged a 23% spike in parcel volume during the 2025 holiday peak, reinforcing that quick-turn packaging is no passing trend. As SKU rotations accelerate, converters that marry fast makeready with variable-data workflows are seeing double-digit share gains among e-commerce-first brands. Analog offset, with its plate costs and 90-minute washups, cannot compete below 5,000 units, opening lasting headroom for the digital printing market.
Declining Per-Unit Print Cost and Faster Turnaround
Press vendors have trimmed click charges and raised productivity enough to match offset economics for 2,000-10,000-sheet orders. HP’s Indigo 200K outputs 4,600 B2 sheets per hour at under USD 0.02 per A4 page, thanks to longer-life Samba printheads that exceed two billion drops before replacement.[2]HP Inc., “HP Indigo 200K Press Specifications and Case Studies,” HP Investor Relations, hp.com Label converters in India cut order-to-ship cycles to 36 hours after installing EFI Jetrion UV units, enabling real-time artwork changes required by pharmaceutical serialization. These performance jumps allow regional printers to win work once monopolized by multinational plants, boosting competition yet widening the overall digital printing market.
Rapid AI-Enabled Workflow Automation for Micro-Batch Orders
Artificial intelligence is now embedded in press controllers, color servers, and maintenance dashboards. Xerox FreeFlow Vision uses neural networks to detect misregistration and auto-correct ink laydown, dropping wastage from 8% to under 2%.[3]Xerox Holdings Corporation, “Iridesse Production Press and FreeFlow Vision Software,” xerox.com Ricoh Predictive Insight mines historical sensor feeds to forecast printhead failure 72 hours in advance, letting service teams schedule swaps during planned downtime.[4]Ricoh Company Ltd., “Pro C9500 Series and Predictive Insight Platform,” ricoh.com HP’s Nio front-end even pre-selects ICC profiles by reading substrate reflectance curves inline, slashing color-approval loops to 15 minutes. These AI modules relieve labor bottlenecks, especially in Western sites where experienced operators are scarce, and collectively add 1.3 percentage points to the market’s CAGR.
Expansion of Digital-Textile Micro-Factories in European Union and United States
Fast-fashion retailers are building on-demand hubs within 500 kilometers of shoppers to avoid Asian shipping delays, reduce freight-related CO₂ emissions, and comply with the Uyghur Forced Labor Prevention Act. Kornit’s Atlas Max Poly outputs 220 square meters per hour on polyester rolls while eliminating post-wash steps, shrinking water use by 95%. Inditex reported an 18% reduction in Scope 3 emissions after shifting volumes to European micro-factories, demonstrating that proximity printing meets both ESG targets and consumers' want-it-now expectations. Similar deployments in North Carolina show that domestic garment plants can profitably compete with import pricing when digital lines erase minimum-order constraints.
Restraints Impact Analysis*
| Restraint | (~) % Impact on CAGR Forecast | Geographic Relevance | Impact Timeline |
|---|---|---|---|
| High CAPEX and R&D outlays for high-end presses | -1.2% | Global, with acute impact on small and medium enterprises in Europe and North America | Medium term (2-4 years) |
| Stricter PFAS/solvent-ink regulations causing re-qualification delays | -0.9% | Europe and United States leading, with spillover to Canada and Australia | Short term (≤ 2 years) |
| Persistent color-management complexity across substrates | -0.6% | Global, particularly affecting converters serving multiple end-markets | Long term (≥ 4 years) |
| Semiconductor supply bottlenecks for industrial inkjet heads | -0.7% | Global, with supply concentrated in Japan and Taiwan | Short term (≤ 2 years) |
| Source: Mordor Intelligence | |||
High Capex and R&D Outlays for High-End Presses
Single-pass inkjet systems for corrugated lines range from USD 2.5 million to USD 4 million, a capital wall that regional plants cannot scale without private-equity backing. EFI’s Nozomi C18000 demands another USD 500,000 of site upgrades, from reinforced floors to humidity controls, before the first print fires. Lease deals soften the blow, yet USD 35,000-50,000 monthly notes remain untenable for plants with revenue under USD 20 million. The financing gap is pushing Tier-1 converters further ahead, consolidating high-margin brand contracts and restraining smaller shops from entering the digital printing market.
Stricter PFAS/Solvent-Ink Regulations Causing Re-Qualification Delays
The United States Environmental Protection Agency declared key PFAS chemistries hazardous in April 2024, forcing ink makers to reformulate UV-curable blends and retest every food-contact substrate. Flint Group and Siegwerk estimate that qualification cycles now stretch six to nine months, slowing new press sign-offs and marginally clipping the market CAGR. Europe’s broad PFAS ban, under consultation in 2025, could spark another round of reformulation by 2027, adding compliance costs and scheduling headaches for converters chasing multinational packaging accounts.
*Our forecasts treat driver/restraint impacts as directional, not additive. The impact forecasts reflect baseline growth, mix effects, and variable interactions.
Segment Analysis
By Printing Process: Inkjet Reinforces Its Lead with Substrate Flexibility
Inkjet secured 58.83% revenue in 2025 and is forecast at an 8.44% CAGR through 2031 as single-pass architectures deliver 150 meters-per-minute speeds on 40-GSM tissue and 600-micron board alike. The digital printing market size attributed to inkjet installations topped USD 21 billion in 2026. HP Indigo 200K and Canon ProStream placements in China and the United States prove that aqueous pigment lines now equal offset gloss on coated stock while switching jobs in minutes. Electrophotography still shines in monochrome transactional print; Xerox Iridesse adds metallic toner for premium invitations, sustaining its niche. Yet toner platforms rely on heated fusers that burn 40% more power than LED-UV curing, a cost penalty in Europe where energy prices remain volatile. ISO is updating standard 12647-2 to formalize single-pass tolerances, easing brand audits and accelerating inkjet adoption.
Electrophotography’s growth will trail at roughly 6.2% as sustainability standards disfavor silicone-oil contamination in recycled fiber streams. Ricoh’s oil-free C9500 doubles maintenance intervals to 1 million impressions, but substrate limits persist. Konica Minolta’s AccurioPress C14000 competes on click rate, yet brand owners increasingly pick presses that carry Forest Stewardship Council and Cradle to Cradle seals, awards more easily earned by water-based systems. Therefore, inkjet’s versatility and regulatory alignment continue to expand its share inside the digital printing market.

By Ink Type: LED-UV Curables Accelerate Energy-Efficient Adoption
UV-curable formulations accounted for 31.74% of 2025 revenue and will grow at an 8.14% pace, boosted by LED arrays that fire at 385-395 nanometers and start instantly. Fujifilm Jet Press 750S High Speed demonstrated 60% lower electricity draw than mercury predecessors during 2025 tests, giving European printers a direct route to carbon-reduction targets. Water-based pigments dominate corrugated and textile applications, offering zero volatile organic compounds and straightforward wastewater treatment. Latex inks straddle indoor-air compliance and outdoor durability; HP Latex 2700 extends applied-graphics durability to a five-year outdoor life without lamination. Dye-sublimation lines such as Mimaki Tiger-1800B MkII reached 180 square meters per hour, allowing sportswear factories to compete with rotary screen at runs above 500 units.
Solvent inks now cluster in vehicle wraps and outdoor banners where adhesion to vinyl overrides environmental rules. The European Union Ecodesign for Sustainable Products Regulation, effective 2027, will obligate recyclability labeling on textiles, nudging buyers toward water-based pigments. Collectively, these shifts expand the ink type diversity in the digital printing market, but LED-UV remains the star for its energy and compliance profile.
By Substrate: Textiles Post Fastest Growth as Fashion Embraces On-Demand
Paper and paperboard controlled 42.63% of 2025 print volume, yet textiles are poised for an 8.23% CAGR, the quickest across substrates. Direct-to-garment systems like Kornit Apollo push 240 shirts per hour with 50-wash fastness, enabling pre-sale models that eliminate 30% unsold inventory waste. The digital printing market size within textiles is forecast to double by 2031 as brands adopt near-real-time production. Plastics and films are carving share in flexible pouches that host QR codes for consumer engagement, as Bobst Digital Master 340 hybrid presses remove the USD 10,000 plate cost typical of gravure runs. Glass, ceramic, and metal remain niche volumes, yet Durst P5 350 HS shows that tile makers value digital for rapid pattern changes inside smart-home collections.
Corrugated board, energized by China’s e-commerce exports, is gaining digital penetration, with Screen Truepress Jet520HD recirculation kits pushing printhead life to 2.5 billion drops. The substrate mix underlines how the digital printing market rewards platforms that pivot quickly from fiber to polymer to fabric without mechanical changeovers.

By Application: Packaging Dominates, Textiles Accelerate
Packaging accounted for 30.73% of 2025 turnover, driven by labels that must now carry unique identifiers under European and United States drug-traceability laws. Domino N730i integrates cameras that verify every barcode, satisfying the Falsified Medicines Directive while saving manual inspection steps. Corrugated boxes printed on-the-fly for JD.com shipments transform shipping cartons into marketing billboards, expanding cost-justified regions for high-volume single-pass lines. Rigid cartons still toggle between offset for massive runs and digital for limited editions, yet converters see rising client pressure to pivot entirely to variable-data workflows.
Textile printing is growing at an 8.06% clip as athletic brands migrate polyester jerseys to dye-sublimation. Seiko Epson SureColor F10000 widens fabric widths to 1.6 meters, opening the upholstery and curtain markets. Commercial print is losing volume overall, but on-demand books keep toner presses busy in Amazon fulfillment centers. Large-format signage profitably leverages LED-UV inks that install immediately with no outgassing delay. Each application track underscores how the digital printing market monetizes speed, customization, and compliance more than raw print volume.
Geography Analysis
Asia Pacific generated 38.73% of 2025 revenue and is on track for an 8.32% CAGR, anchored by more than 200 single-pass corrugated lines installed in China during 2024-2025 to serve cross-border shipments. The China National Packaging Corporation pegged digital penetration in corrugated at 12% in 2025, double 2023 levels. India’s label sector is digitizing quickly to satisfy Food Safety and Standards Authority QR-code rules. Vietnam and Bangladesh attract garment micro-factories as brands diversify away from China, such as Kornit opened a Ho Chi Minh training hub in early 2025. North America captured roughly 28% of revenue, propelled by flexible packaging that serves nutraceutical and cannabis products requiring ever-changing compliance copy. Canada leverages digital for province-specific cannabis warnings, while Mexico’s nearshoring boom demands just-in-time cartons for electronics assembly.
Europe emphasizes sustainability and circular-economy compliance under the EU Green Deal. The Digital Product Passport for textiles and packaging necessitates item-level encoding, a function naturally embedded within high-resolution inkjet lines. Germany’s mechanical engineering base integrates print modules into robotized finishing cells, while France’s luxury sector insists on exacting spot-color reproduction and tactile varnish effects. The United Kingdom exploits creative industries’ demand for bespoke limited-run prints, encouraging SMEs to buy compact B2 inkjet units. Collectively, these regional dynamics reinforce the digital printing market as a cornerstone of next-generation manufacturing worldwide.
Europe held about a notable share of sales, with Germany and the United Kingdom leading installations of high-end inkjet presses. Single-Use Plastics restrictions channel investments into printed paper trays and molded fiber, favoring water-based inks. Luxury labels in France and Italy prize digital textile and label lines for limited runs. Spain and Portugal have become hubs for on-demand garment printing that meet next-day shipping into Western Europe. South America, Middle East, and Africa together form a sub-10% revenue block, yet Brazil shows double-digit label growth, and the United Arab Emirates equips exhibition printers with wide-format LED-UV units. South Africa tests direct-to-garment units under its retail master plan, indicating that the digital printing market’s reach is progressively global.
Mordor Intelligence provides coverage of the digital printing market across other key regional markets, including Middle East, each with their regulatory frameworks and demand patterns.

Competitive Landscape
The digital printing market is moderately fragmented. The top five suppliers, HP, Canon, Xerox, Ricoh, and Electronics For Imaging, held the largest share in 2025, leaving white space for specialists. HP expanded vertically by buying Memjet printhead patents in 2024 to reduce supply risk, and in January 2026 it committed USD 150 million to enlarge Indigo production in Israel, adding R&D labs for food-safe aqueous inks. Canon’s varioPrint iX platform blends toner and inkjet stations, letting customers toggle modes without swapping presses. Xerox bought Toshiba Tec’s inkjet head division for USD 180 million in October 2025, folding waveform engineering talent into its Iridesse roadmap. Ricoh opened a Telford innovation hub certified to ISO/IEC 17025, providing European buyers with a place to run substrate tests under controlled humidity conditions.
Disruptors continue to surface. Landa Digital Printing commercialized nanography, layering ink thinner than 500 nanometers to hit offset gloss on uncoated paper, a leap that attracts high-quality commercial printers. Kornit Digital locked apparel customers by pairing water-based pigment inks with built-in pretreatment, creating switching costs for users trained on the Apollo and Atlas ecosystems. Emerging vendors often pitch equipment-as-a-service contracts that cut upfront outlays in half, challenging the high-CAPEX paradigms restraining smaller converters. Meanwhile, patents in printhead algorithms and ink chemistries rose 35% year over year in the World Intellectual Property Organization database during 2024-2025, signaling ongoing innovation. Competitive strategies are converging on AI-driven predictive maintenance and inline inspection, because converters tolerate no more than 2% scrap in fast-moving fulfillment loops.
Digital Printing Industry Leaders
HP Inc.
Canon Inc.
Xeikon NV
Xerox Holdings Corporation
Electronics For Imaging, Inc.
- *Disclaimer: Major Players sorted in no particular order

Recent Industry Developments
- January 2026: HP Inc. announced a USD 150 million expansion of its Indigo press plant in Kiryat Gat, Israel, adding 50,000 square meters of floor space for Indigo 200K demand and an R&D wing for food-contact aqueous inks.
- December 2025: Canon Inc. launched the varioPrint iX-3200 hybrid press that switches between toner and aqueous inks, with first installs in Germany and Japan trimming makeready time by 30%.
- November 2025: Kornit Digital Ltd. partnered with PVH Corp. to deploy Apollo direct-to-garment units in Portugal and Mexico, earmarking USD 25 million for facilities and training, with production ramp-up in Q2 2026.
- October 2025: Xerox Holdings Corporation completed its USD 180 million acquisition of Toshiba Tec’s inkjet head unit, gaining a Shizuoka plant and 120 engineers for Iridesse and Baltoro platforms.


Research Methodology Framework and Report Scope
Market Definitions and Key Coverage
Our study defines the digital printing market as revenue generated worldwide from commercial-grade inkjet and electrophotographic presses, their associated consumables, and value-added print services that transfer images directly from electronic files without plates across packaging, textile, signage, publishing, and commercial print jobs.
For clarity, we exclude analog equipment, consumables dedicated solely to offset or flexography, and household photo printers.
Segmentation Overview
- By Printing Process
- Electrophotography (Toner)
- Inkjet
- By Ink Type
- Water-based Pigment
- Solvent
- UV-Curable
- Latex
- Dye-Sublimation
- By Substrate
- Paper and Paperboard
- Plastics and Films
- Textiles / Fabrics
- Glass and Ceramics
- Metals
- By Application
- Books and Publishing
- Commercial Printing
- Packaging
- Labels
- Corrugated Packaging
- Cartons
- Flexible Packaging
- Rigid Plastic Packaging
- Metal Packaging
- Textile Printing
- Photographic and Merchandise
- Signage and Large-Format Graphics
- By Geography
- North America
- United States
- Canada
- Mexico
- South America
- Brazil
- Argentina
- Rest of South America
- Europe
- Germany
- United Kingdom
- France
- Italy
- Spain
- Rest of Europe
- Asia-Pacific
- China
- Japan
- India
- South Korea
- ASEAN
- Rest of Asia-Pacific
- Middle East and Africa
- Middle East
- Saudi Arabia
- United Arab Emirates
- Rest of Middle East
- Africa
- South Africa
- Nigeria
- Rest of Africa
- Middle East
- North America
Detailed Research Methodology and Data Validation
Primary Research
Next, we interviewed print-service providers, press manufacturers, ink formulators, and packaging converters across North America, Europe, and Asia. Their views on run-length migration, ink yield, and substrate premiums enabled us to confirm penetration rates and fine-tune regional pricing assumptions that desk research alone could not fully capture.
Desk Research
We began by harvesting historic print-volume and price data from tier-one public sources such as UN Comtrade, EUROSTAT's PRODCOM files, the US Census Current Industrial Reports, and leading regional print-industry associations. We then enriched them with company 10-Ks and investor presentations to track average selling prices for major press classes.
Our team also tapped premium resources, D&B Hoovers for vendor financial splits and Dow Jones Factiva for deal flow, while patent activity from Questel signaled upcoming technology shifts. The sources cited here are illustrative, as a broader array of open datasets was consulted to validate trends.
Market-Sizing & Forecasting
Our model starts with a top-down reconstruction of global print-spend pools using production and trade statistics to size application-level demand. This is then cross-checked through selective bottom-up roll-ups of supplier revenues and sampled ASP-by-volume calculations. Any gap between the two views is iteratively reconciled before sign-off.
Key drivers, average run length, inkjet share of new installs, corrugated packaging tonnage, ad-spend shifts, textile fast-fashion output, and solvent-to-water ink substitution feed a multivariate regression that projects value to the end of the forecast period. According to Mordor Intelligence, the baseline stands at a specified value, and where granular data are scarce, we bridge gaps with penetration ratios derived from expert calls.
Data Validation & Update Cycle
Our analysts apply layered variance checks, compare outputs with independent shipment trackers, and re-contact experts when anomalies exceed preset bands. Models refresh every year, with interim updates after material events, and a final analyst review precedes each client delivery.
Why Mordor's Digital Printing Baseline Deserves Confidence
We observe that published estimates diverge because firms choose different printer classes, currency years, and utilization assumptions.
Mordor's study counts only commercial-grade presses and linked consumables, whereas several publishers fold in desktop units, assume aggressive double-digit utilization ramps, or freeze exchange rates two years back, inflating totals or altering growth outlooks.
Benchmark comparison
| Market Size | Anonymized source | Primary gap driver |
|---|---|---|
| USD 34.34 B (2025) | Mordor Intelligence | |
| USD 39.63 B (2023) | Global Consultancy A | Includes desktop/MFP devices; no regional mix adjustment in ASPs |
| USD 37.94 B (2024) | Industry Research B | Applies uniform 12 % CAGR to offset-replacement volumes; consumable split unvalidated |
We believe the comparison shows that disciplined scope setting, transparent variables, and annual refresh cadence let Mordor deliver a balanced baseline clients can rely on with confidence.


Key Questions Answered in the Report
How large is the digital printing market in 2026?
The digital printing market size reached USD 36.95 billion in 2026 and is set to climb to USD 53.32 billion by 2031.
What CAGR is expected for digital printing through 2031?
The market is forecast to expand at a 7.61% CAGR over the 2026-2031 period.
Which printing process is growing the fastest?
Inkjet is advancing at an 8.44% CAGR, helped by single-pass lines that match offset quality on multiple substrates.
Why is Asia Pacific leading adoption?
High e-commerce volumes, investment in corrugated inkjet presses, and textile micro-factory growth give Asia Pacific 38.73% of 2025 revenue with an 8.32% growth outlook.
What is the biggest restraint on smaller printers?
High capital costs of industrial presses and facility upgrades, often topping USD 2.5 million, hinder smaller firms from entering digital production.
Page last updated on:


