
Market Overview
| Study Period | 2020 - 2031 |
|---|---|
| Market Size (2026) | USD 594.24 Billion |
| Market Size (2031) | USD 704.07 Billion |
| Growth Rate (2026 - 2031) | 3.45 % |
| Fastest Growing Market | Asia Pacific |
| Largest Market | Asia Pacific |
| Market Concentration | Low |
Major Players *Disclaimer: Major Players sorted in no particular order Image © Mordor Intelligence. Reuse requires attribution under CC BY 4.0. | |
Commercial Printing Market Analysis by Mordor Intelligence
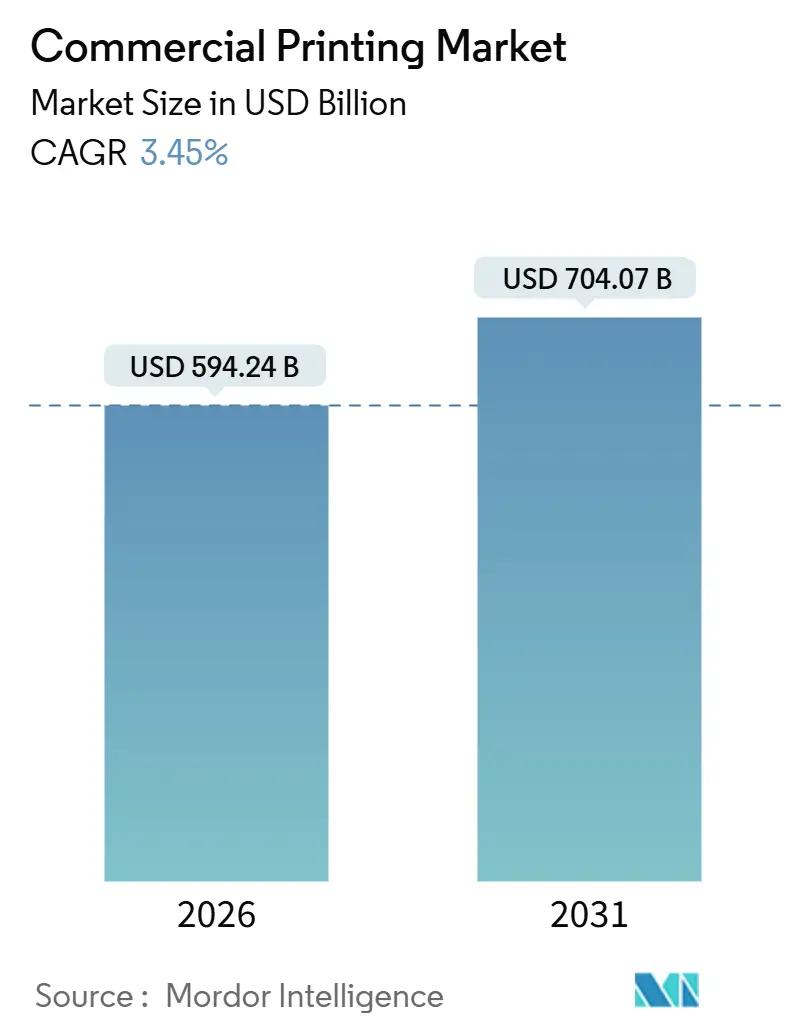
The commercial printing market reached USD 594.24 billion in 2026 and is projected to attain USD 704.07 billion by 2031, advancing at a 3.45% CAGR during the forecast period. This trajectory reflects a transition from long offset print runs to agile, short-run projects that unlock higher gross margins. E-commerce growth, regulatory serialization requirements, and SKU proliferation are compressing lead times while forcing print service providers to embrace variable-data workflows. As a result, digital inkjet, direct-to-shape, and hybrid flexographic systems are displacing legacy equipment even in high-volume environments. Brand owners are simultaneously demanding eco-friendly substrates and embedded electronics that enhance traceability, which is widening the technology gap between innovators and laggards. Competitive intensity is rising as multinational converters integrate upstream assets to secure raw materials, while digital specialists orchestrate distributed capacity through cloud platforms, driving a new equilibrium across the commercial printing market.
Key Report Takeaways
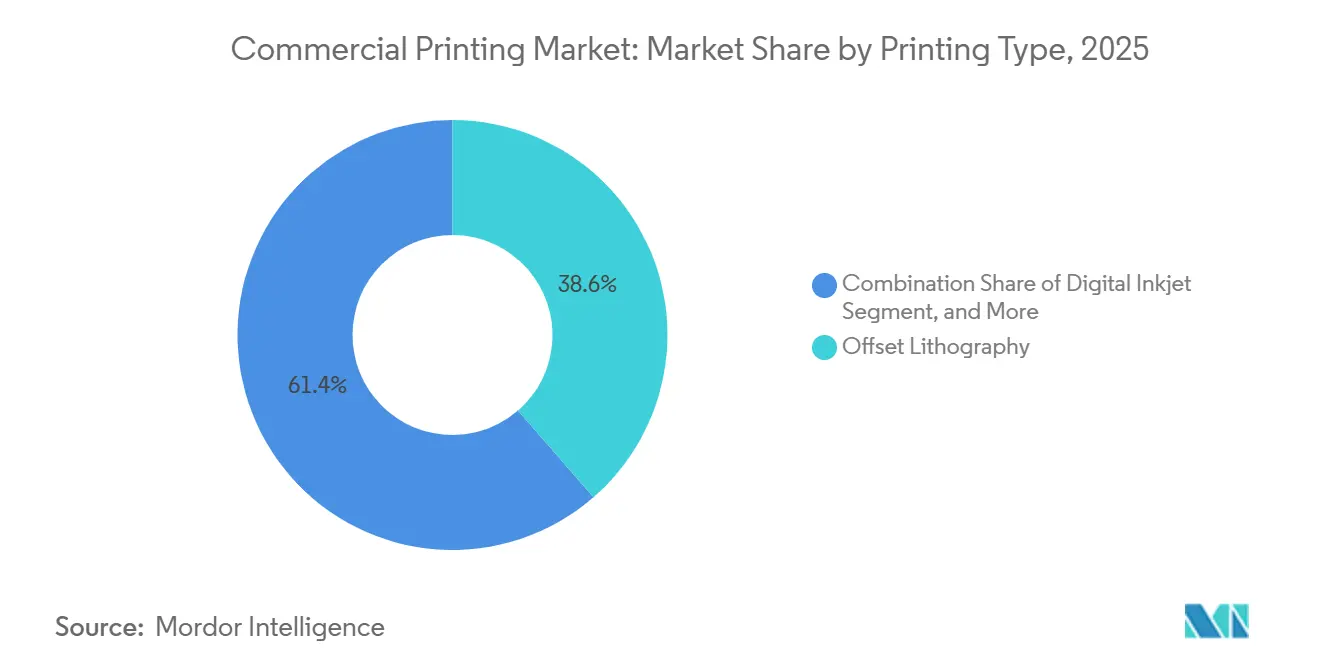
- By printing type, offset lithography led with 38.62% of the commercial printing market share in 2025, while digital inkjet is forecast to register a 4.11% CAGR through 2031.
- By application, packaging accounted for 45.74% of the commercial printing market in 2025 and is projected to expand at a 4.54% CAGR.
- By print material, paper and cardboard retained 61.74% of the 2025 revenue of the commercial printing market, whereas plastic and synthetic substrates are poised to grow at a 4.88% CAGR to 2031.
- By format, large-format printing accounted for 41.74% of the commercial printing market's 2025 global sales, but direct-to-object workflows are advancing at a 4.42% CAGR over the same period.
- By geography, Asia-Pacific accounted for 38.73% of the 2025 commercial printing market turnover and is expected to grow at a 4.55% CAGR, outpacing other regions.
Note: Market size and forecast figures in this report are generated using Mordor Intelligence’s proprietary estimation framework, updated with the latest available data and insights as of January 2026.
Market Trends and Insights
Drivers Impact Analysis of Commercial Printing Market*
| Driver | (~) % Impact on CAGR Forecast | Geographic Relevance | Impact Timeline |
|---|---|---|---|
| Explosive growth in on-demand packaging print runs | +1.2% | Global, concentrated in Asia-Pacific and North America e-commerce hubs | Short term (≤ 2 years) |
| Rising adoption of variable-data printing for personalised marketing | +0.8% | North America and Europe, expanding to urban Asia-Pacific | Medium term (2-4 years) |
| Sustained demand for promotional print from retail and CPG brands | +0.5% | Global, strongest in Europe and North America retail sectors | Medium term (2-4 years) |
| Transition toward eco-friendly substrates and vegetable-based inks | +0.6% | Europe leading, followed by North America, emerging push in Asia-Pacific | Long term (≥ 4 years) |
| Integration of printed electronics into packaging and labels | +0.7% | Global, early adoption in pharmaceuticals and luxury goods | Medium term (2-4 years) |
| Emergence of micro-factory print-as-a-service hubs | +0.4% | Urban centers in Asia-Pacific and select North America metros | Long term (≥ 4 years) |
| Source: Mordor Intelligence | |||
Explosive Growth in On-Demand Packaging Print Runs
E-commerce platforms now prioritize shorter packaging runs that turn around in days rather than weeks, a dynamic favoring high-speed digital inkjet over plate-based offset.[1] Amazon’s frustration-free guidelines and similar mandates from regional marketplaces lowered the economic threshold at which digital presses become cheaper per unit, especially for batches under 5,000 units. Converters that invested in single-pass PageWide lines reported order-to-ship cycles shrinking from ten days to forty-eight hours. The same trend is evident in Asia-Pacific fulfillment networks, where Alibaba and Flipkart route SKU-specific artwork to localized print hubs to trim freight and carbon footprints.[2] As volumes fragment, production analytics confirm higher gross margins due to minimized makeready waste and premium per-box pricing that brands absorb in exchange for speed.
Rising Adoption of Variable-Data Printing for Personalised Marketing
Direct-mail and catalog marketers are reviving print budgets because variable-data campaigns generate measurable lift in response rates versus static pieces.[3] The United States Postal Service cited a stabilization of direct-mail volumes in 2025, driven by financial-services and insurance firms that shifted budgets back to print to escape digital clutter. Printers installing varioPRINT iX and color-inkjet web presses process billions of individualized impressions annually, demonstrating throughput that rivals conventional offset while eliminating plate costs. Although Europe’s GDPR requires explicit consent for personalized outreach, brands mitigate the risk by leveraging first-party loyalty data and QR-enabled catalogs that merge physical and augmented-reality experiences, thereby positioning print as an attribution-rich touchpoint in omnichannel funnels.
Sustained Demand for Promotional Print from Retail and CPG Brands
Retailers and consumer-goods manufacturers continue to allocate budget to tactile signage, in-store displays, and shelf-edge labels that drive impulse purchases despite the migration of broader advertising dollars to digital screens. Brand managers observe that point-of-purchase materials boost category lift when paired with mobile coupons, leading to increased call-outs for multi-substrate campaigns that blend paperboard standees with rigid foam signage. Wide-format UV inkjet presses that apply spot varnish and metallic inks in a single pass enable fast design refreshes tied to seasonal promotions, preserving print’s strategic relevance. The resilience of promotional graphics is particularly strong in Europe where brick-and-mortar grocery formats remain dominant, supporting steady capacity utilization at large-format operations.
Transition Toward Eco-Friendly Substrates and Vegetable-Based Inks
Extended producer-responsibility fees in the European Union and corporate net-zero targets compelled converters to introduce soy-based, water-based, and UV-curable low-VOC formulations that meet ISO 12647 color standards. Brand owners prefer substrates certified by the Forest Stewardship Council or carrying compostability labels under ASTM D6868. While bio-derived inputs still command price premiums, early adopters secure long-term contracts with sustainability-focused retailers eager to decarbonize supply chains. Equipment manufacturers responded by releasing flexographic and digital presses with lower energy profiles and inline catalytic oxidizers that capture solvent emissions, creating an ecosystem in which greener materials and process efficiency reinforce each other over a multiyear horizon.
Restraints Impact Analysis of Commercial Printing Market*
| Restraint | (~) % Impact on CAGR Forecast | Geographic Relevance | Impact Timeline |
|---|---|---|---|
| Ongoing shift of advertising spend to digital media channels | -0.9% | Global, most acute in North America and Europe | Short term (≤ 2 years) |
| Volatile prices of paper, ink and energy inputs | -0.6% | Global, acute in Europe and Asia-Pacific | Short term (≤ 2 years) |
| Stringent VOC and chemical-use regulations on conventional inks | -0.4% | Europe and North America leading, emerging in Asia-Pacific | Medium term (2-4 years) |
| Shortage of semiconductor components for new digital presses | -0.3% | Global, with recovery underway | Short term (≤ 2 years) |
| Source: Mordor Intelligence | |||
Ongoing Shift of Advertising Spend to Digital Media Channels
Programmatic video, social platforms, and connected-TV inventory captured 72% of United States ad spend in 2025, accelerating the contraction of publication and newspaper print demand. Publishers idled web-offset lines as revenues fell, and several European magazine titles ceased print editions entirely. Although direct mail proved resilient, the broader erosion of print advertising shrinks the overall addressable base for commercial printers that specialize in publication work. To offset revenue losses, many have diversified into packaging and large-format graphics, but legacy fixed costs still weigh on margins, especially where market pricing remains commoditized.
Volatile Prices of Paper, Ink and Energy Inputs
Global pulp shortages, natural-gas price spikes, and pigment supply interruptions raised raw-material costs by double digits in 2024 and 2025. Converters with cost-plus contracts passed through some increases, yet fixed-price agreements left smaller operators exposed. The squeeze was most acute in Europe where winter energy tariffs reached record highs, prompting short-run stoppages and accelerated migration from heatset to energy-efficient inkjet lines. In Asia-Pacific, reliance on imported pulp created currency-driven inflation that eroded working capital. The volatility incentivizes vertical integration, as shown by WestRock’s ownership of containerboard mills that now cover 70% of its internal corrugated demand, providing a hedge against external shocks.
*Our forecasts treat driver/restraint impacts as directional, not additive. The impact forecasts reflect baseline growth, mix effects, and variable interactions.
Commercial Printing Market Segment Analysis
By Printing Type:
Digital Inkjet Gains Share Despite Offset DominanceOffset lithography commanded 38.62% of commercial printing market share in 2025, a position rooted in scale economies at volumes above 10,000 impressions. Digital inkjet, however, is forecast to grow at a 4.11% CAGR, shrinking the differential through higher speed, lower makeready waste, and tight integration with web-to-print portals. Canon varioPRINT installations, for instance, achieve offset-comparable quality on coated stocks while delivering variable data on every sheet, enabling printers to monetize personalization without incurring plate charges. Flexographic printing maintains an edge in flexible packaging due to its compatibility with water-based inks, but hybrid presses that merge inkjet heads with flexo decks are blurring boundaries. Gravure remains viable for ultra-high-volume catalog work and decorative laminates where cylinder life amortizes costs across millions of meters, yet its share will likely erode as subscription publications decline. The competitive inflection point appears most imminent in label and corrugated applications where single-pass inkjet lines now print 200 meters per minute, a throughput that reshapes total cost of ownership assumptions and tilts procurement in favor of digital.
In parallel, print service providers are retrofitting legacy offset sites with digital retrofits to preserve sunk real estate investments while leveraging cloud-based workflow suites that batch orders by substrate and finish. This operational model allows lean staffing and extended uptime because file prep, imposition, and color management ride on automated rules-based engines. Financiers view inkjet’s predictable cost per page and modular upgrade path as lower risk than capex-heavy offset replacements, reinforcing adoption momentum across the commercial printing market.

By Application:
Packaging Outpaces PublishingPackaging represented 45.74% of global revenue in 2025, and its 4.54% CAGR positions it as the principal driver of the commercial printing market size through 2031. E-commerce acceleration, anti-counterfeiting mandates, and shelf-ready display requirements compel consumer-goods brands to allocate larger budgets to corrugated, folding carton, and flexible formats. Meanwhile, publishing segments confront secular declines as readers migrate to screens, causing corporate advertisers to redirect spend. Book printing has remained a notable exception because print-on-demand economics allow perpetual availability of long-tail titles without inventory risk, yet unit prices are under pressure from e-book competition. Corporate transactional print, such as statements and checks, benefits from regulatory obligations that still favor paper trails, providing a stable albeit mature revenue stream. Advertising collateral, including point-of-sale displays, remains uneven, but premium large-format graphics for experiential retail continue to command high margins.
The commercial printing market share for flexible packaging is rising fastest within the broader packaging category as stand-up pouches replace rigid containers in snacks, pet food, and personal-care products. These film structures facilitate lightweight shipping and 360-degree graphics, which in turn demand presses capable of metallics, tactile varnish, and variable coding. Direct-to-shape beverage bottle projects illustrate the path toward label-free branding, demonstrating how design freedom dovetails with material reduction mandates.
By Print Material:
Plastic And Synthetic Substrates Gain On Sustainability PushPaper and cardboard retained 61.74% of sales in 2025, yet the forecast shows plastic and synthetic alternatives advancing at a 4.88% CAGR, reflecting flexible packaging’s ascent. Polyethylene and polypropylene films laminated with barrier coatings enable extended shelf life and reduced grammage, fitting both environmental and logistical objectives. The European Packaging and Packaging Waste Directive now penalizes multi-material laminates, prompting a shift to mono-material high-barrier polyethylene, which remains recyclable within existing EU streams. Simultaneously, paper-based materials coated with dispersion barriers are carving out niches where millimeters of polymer used to dominate. Cold-foil, holographic film, and other specialty substrates retain their foothold in luxury cosmetics and spirits because tactile finishes justify higher unit economics. For industrial parts and electronics housings, UV-curable acrylics printed onto synthetic panels replace adhesive labels, providing durability and compliance with international safety standards.
Brand commitments to compostable or recycled content impose stringent printability requirements that only state-of-the-art inkjet heads and pinning systems can satisfy. Printers that optimize drying profiles and invest in inline spectrophotometers uphold color targets across diverse surfaces, preserving brand equity while achieving environmental milestones.

By Format:
Direct-To-Object Printing Expands Beyond LabelsLarge-format signage delivered 41.74% of 2025 revenue, yet direct-to-object workflows exhibit a 4.42% CAGR that signals an upcoming inflection point. Beverage companies such as Coca-Cola employed aluminum bottle campaigns that used 360-degree graphics to foster collector appeal without shrink sleeves. Cosmetics firms, automotive OEMs, and consumer-electronics brands similarly specify direct-print decoration on curved or irregular geometries to eliminate label waste and elevate perceived value. The commercial printing market size for direct-to-object applications is set to widen as ultraviolet-LED curing solutions deliver adhesion on glass, plastic, and coated metals while consuming less energy than mercury-vapor lamps. On the small-format end, checks and secure certificates remain mandatory in government and banking workflows, anchoring a baseline of demand amidst declining office print volumes. Consequently, printers with diversified format portfolios mitigate cyclical swings and capture upside from emerging industrial decoration needs.
Hybrid machines that combine object rotation devices with multi-axis inkjet heads push productivity past early prototypes, enabling 1,000-unit promotional runs at per-piece economics once reserved for tens of thousands. As retailers expand limited-edition campaigns, demand for these capabilities percolates down to mid-tier printers, multiplying installed base growth.
Geography Analysis
APAC Commercial Printing Market
Asia-Pacific controlled 38.73% of global sales in 2025 and is forecast to rise at a 4.55% CAGR through 2031, bolstered by consumer-class expansion, rising regulatory standards, and near-shoring of packaging lines. China aligns its dual-circulation policy with domestic print capacity, leading enterprises such as Jinjia Group to deploy high-speed flexographic systems that replace imported cartons. India’s implementation of unified goods and service taxes and tighter food-package labeling drives investments in digital inkjet lines optimized for multi-language layouts. Japan’s highly urban population benefits from Raksul’s cloud platform that dispatches jobs to partner presses capable of same-day output, a model now emulated in Seoul and Taipei.
North America and Europe Commercial Printing Market
North America claims a mature yet resilient share of the commercial printing market with nearshoring trends accelerating investment in corrugated and folding carton plants. WestRock and International Paper upgraded mills in Georgia and Texas to support beverage and e-commerce shippers seeking rapid box replenishment, a pivot that stabilizes regional print volumes even as newspaper circulation declines. European operators navigate higher energy costs and stringent emission rules but win contracts from sustainability-driven CPGs by offering low-VOC ink sets and green energy certificates. Germany’s consolidation wave trimmed capacity among mid-sized offset houses, funneling volume to digital forwarding entities like Onlineprinters that centralize file handling and outsource production to affiliated sites.
South America and MEA Commercial Printing Market
South America, the Middle East and Africa, and select Southeast Asian markets display heterogeneous momentum linked to macroeconomic stability, currency fluctuations, and infrastructure robustness. The United Arab Emirates advanced food-security initiatives by nurturing domestic flexible-packaging output, exemplified by Hotpack Global’s new lines that run extended-color-gamut flexo units for halal food exporters. Brazil grapples with currency pressures that inflate imported ink prices, yet demand persists for flexible pouches as FMCG producers downsize pack sizes to preserve affordability. South Africa wrestled with grid instability, driving converters to invest in rooftop solar arrays that guarantee uptime and reduce carbon disclosures.
Overall, regional divergence creates a patchwork of growth vectors, with Asia-Pacific commanding the largest commercial printing market size increase in absolute terms, while North America and Europe transition revenue mixes toward packaging and industrial decoration.

Regulatory Landscape
Regulation is increasingly centered on packaging sustainability, chemical safety, and traceability, which is shaping commercial-print specifications for labels, cartons, and flexible packs. In Europe, extended producer responsibility (EPR) schemes and packaging-waste rules are pushing converters toward clearer on-pack labeling, more structured recycled-content claims management, and material choices that preserve print performance on recyclable structures. A key inflection point is the EU Packaging and Packaging Waste Regulation, Regulation (EU) 2025/40, which applies from August 2026 and introduces mandatory sustainability and labeling requirements for packaging placed on the EU market. This change is requiring brand owners and print service providers to tighten compliance workflows for artwork control, ink selection, and substrate qualification.
In North America, food-contact compliance is also tightening for printed packaging, which raises the value of migration testing and documentation across commercial-print supply chains. The US FDA finalized a systematic process for post-market assessment of food chemicals in May 2026, increasing scrutiny for legacy materials used in food-contact applications. At the same time, FDA updates affecting coated paper and paperboard, including lower migration limits for certain BPA alternatives with enforcement beginning in July 2026, raise the compliance burden for printers and converters supplying food and beverage brands, especially where packaging uses coated stocks and low-odor, low-migration ink systems.
Value Chain Analysis
The commercial printing value chain begins with upstream inputs such as pulp and paper, polymer resins and films, aluminum and foils, pigments, solvents, binders, and specialty additives, supported by energy and logistics. Material supply is concentrated among integrated mills and petrochemical-linked producers, while ink and coating formulators and plate, cylinder, and die suppliers translate raw materials into press-ready consumables. Equipment OEMs (offset, flexo, and digital inkjet), software providers (web-to-print, prepress automation, color management), and finishing suppliers (lamination, coating, cutting, binding) support production, after which print service providers and packaging converters deliver to brand owners through direct contracts or procurement platforms.
Midstream operations are increasingly defined by short-run variability and compliance-driven versioning, which favors digital and hybrid pressrooms that can update language, hazard content, or serialized codes late in the process. In regulated end markets, traceability mandates (notably pharmaceuticals under EU FMD and the US DSCSA) reinforce standardized serialized DataMatrix and alphanumeric coding, pulling coders, vision inspection, and workflow integration deeper into production. On the supply side, logistics disruption and feedstock volatility can propagate into ink and film availability; tensions affecting shipping corridors such as the Strait of Hormuz have been cited as a driver of longer routings and higher freight and insurance costs. This dynamic encourages converters to carry higher inventory buffers and pursue longer-term sourcing agreements.
Competitive Landscape
Global revenue concentration remains fragmented, with the top ten enterprises capturing a notable share of aggregate turnover. The WestRock-Smurfit Kappa merger formed a USD 34 billion powerhouse spanning containerboard to consumer cartons, allowing integrated planning from pulp mill to print finishing, which lowers unit cost and secures raw-material supply. Such vertical combinations force mid-tier converters to either specialize or seek consolidation partners to maintain pricing leverage. Digital transformation draws a strategic divide as multinational incumbents roll out Industry 4.0 platforms that centralize prepress, inventory, and predictive maintenance, whereas asset-light disruptors like Raksul orchestrate 3,000 partner sites via API to convert orders into nearest-plant output, trimming delivery windows to same-day in Tokyo and Osaka.
Technology diversification is accelerating. Toppan leverages gravure heritage to pioneer printed RFID antennas, adding functionality beyond graphics. Xerox advances printed photovoltaic research, opening prospective revenue streams in IoT sensors. In the personalized photo niche, Shutterfly and Blurb leverage batch-of-one economics and intuitive design interfaces to bypass traditional retail channels. Across the board, adherence to ISO 12647 and G7 profiling has become a cost of entry for multinational brand contracts, pushing laggards out of global supply lists. Printers investing in inline spectrophotometry and closed-loop calibration achieve color delta-E thresholds under two, a requirement that mainstream brands embed in procurement audits.
Capital allocation now increasingly favors modular inkjet platforms that can be field-upgraded, a model supported by financial institutions that appreciate annuity-type service revenues. Combined with predictive analytics that streamline consumable replenishment, such architecture enhances gross margin stability. As functional printing converges with electronics and biotech, incumbent print houses that master conductive inks and micro-patterning stand to redefine value propositions beyond visual communication.
Commercial Printing Industry Leaders
-
Cenveo Worldwide Limited
-
R.R. Donnelley & Sons Company
-
Toppan Inc.
-
ACME Printing Company, Inc.
-
Vistaprint B.V.
- *Disclaimer: Major Players sorted in no particular order

Commercial Printing Market Companies Covered in this Report
- Dai Nippon Printing Co., Ltd.
- Toppan Inc.
- R.R. Donnelley and Sons Company
- Quad/Graphics Inc.
- TC Transcontinental Inc.
- Cenveo Worldwide Limited
- Cimpress plc
- Deluxe Corporation
- Shutterfly LLC
- LSC Communications LLC
- Mondi plc
- Printpack Inc.
- Multi-Color Corporation
- ACME Printing Company, Inc.
- O'Neil Printing Inc.
- Xerox Holdings Corporation (Print Services)
- WestRock Company (Print and Packaging)
- Berry Global Group, Inc. (Graphics Services)
- Seiko Epson Corporation (Commercial Inkjet Systems)
- HP Inc. (PageWide Industrial)
- Taylor Corporation
- Vistaprint B.V.
- Blurb, Inc.
- AlphaGraphics, Inc.
- Raksul Inc.
Market Opportunities and Future Outlook
Opportunity is concentrated at the intersection of packaging growth, SKU proliferation, and tighter compliance requirements, where printers can bundle variable-data, late-stage customization, and documented material compliance into higher-value service contracts. Packaging already accounted for 45.74% of global commercial printing revenue in 2025, and the operational shift toward short runs and faster turnaround is elevating demand for automated prepress, cloud-connected job onboarding, and hybrid press configurations. This approach keeps base coverage economical while reserving digital stations for versioning, serialization, and QR-enabled engagement. A concrete signal of this investment cycle is RRD's conversion of its Austell, Georgia facility into a digital hub with HP Indigo 120K and PageWide Advantage 2200 installations and robotic material handling (announced February 2025), aligning with broader adoption of variable workflows for on-demand packaging and personalized campaigns.
Materials and sustainability transitions also create room for printers that can qualify inks and processes across changing substrates, particularly as packaging legislation continues to push redesign toward recyclable mono-materials and compostable formats. Expansion announcements in adjacent packaging-material capacity point to the scale of substrate change commercial printers need to support, including Pakka Limiteds announced INR 750 crore compostable packaging investment in Ayodhya (April 2026) and Amcors announced packaging facility expansion in China (July 2026). Smart packaging and information-carrying print, including QR, NFC, and printed RFID antennas, is becoming more accessible as enabling components become cheaper, supporting opportunities for functional and track-and-trace offerings alongside traditional graphics.
Recent Industry Developments in Commercial Printing Market
- July 2026: Toppan Merrill expanded its Quinn platform to support shareholder communications drafting, filing, and distribution. The upgrade strengthens digital-first workflow orchestration around regulated communications, complementing print fulfillment and reinforcing hybrid service delivery for enterprise clients.
- February 2025: RRD announced the digital transition of its Austell, Georgia facility, installing an HP Indigo 120K Digital Press and an HP PageWide Advantage 2200 line, and deploying autonomous mobile robots for material handling. The move increases capacity for short-run, variable, print-on-demand production while lowering manual handling and improving turnaround time consistency.
- December 2024: TOPPAN Holdings entered into an agreement to acquire Sonocos Thermoformed and Flexible Packaging business for about USD 1.8 billion. The deal adds scale in flexible packaging and related printing capabilities, strengthening TOPPANs ability to serve brand owners seeking sustainable packaging formats across multiple regions.
Commercial Printing Market Report Scope and Research Methodology
Market Definition and Coverage
This market covers paid commercial printing work delivered as physical printed output, including common jobs like marketing collateral, business communications, catalogs, and other print products produced for organizations.
Scope exclusions: Home or office desktop printing and purely digital fulfillment activities that do not produce a physical print are excluded.
Segments Covered in This Report
- By Printing Type
- Offset Lithography
- Digital Inkjet
- Flexographic
- Screen
- Gravure
- Other Printing Types
- By Application
- Packaging
- Advertising
- Publishing
- Books
- Magazines
- Newspapers
- Other Publishing
- Corporate and Transactional Printing
- Other Applications
- By Print Material
- Paper and Cardboard
- Plastic and Synthetic Substrates
- Fabric and Textiles
- Metal and Foils
- Other Print Materials
- By Format
- Large-Format Printing
- Small-Format Printing
- Direct-to-Object Printing
- By Geography
- North America
- United States
- Canada
- Mexico
- South America
- Brazil
- Argentina
- Rest of South America
- Europe
- Germany
- United Kingdom
- France
- Italy
- Spain
- Rest of Europe
- Asia-Pacific
- China
- Japan
- India
- South Korea
- ASEAN
- Rest of Asia-Pacific
- Middle East and Africa
- Middle East
- Saudi Arabia
- United Arab Emirates
- Rest of Middle East
- Africa
- South Africa
- Nigeria
- Rest of Africa
- Middle East
- North America
Data Sources, Market Sizing, and Validation
Desk Research
Desk research was used to frame the industry and lock the key data series that move commercial printing demand and pricing. We relied on public, non-paywalled sources such as the US Census Bureau manufacturing and services statistics, Eurostat structural business indicators, UN Comtrade trade flows for printed products, and central bank inflation and exchange-rate series for currency normalization.
To connect printing activity with end-market pull, we also reviewed sources such as postal and direct mail statistics, advertising spend releases from major trade bodies, paper and pulp industry publications, and sustainability rules and labeling requirements published by regulators. Company filings, investor presentations, and reputable press were then used to sanity-check capacity shifts, plant utilization commentary, and the technology mix. In a few places, paid subscriptions for company financials and news intelligence, import-export shipment visibility, and patent databases were used to cross-check signals. These examples are illustrative, and many other sources were also consulted for data collection, validation, and clarification.
Primary Interviews and Surveys
Primary work focused on validating what the desk sources could not show clearly, especially the revenue mix by print type, the pace of digital substitution, and typical price moves by job and run length. We spoke with printers, distributors and print brokers, packaging and publishing buyers, and equipment and consumable stakeholders across major geographies to check assumptions on utilization, turnaround times, and pass-through of input costs against real operating conditions.
Distribution of primary research fieldwork respondents
| Company type | Respondent position | Region |
|---|---|---|
| Top tier: 38% | CXOs: 12% | APAC: 48% |
| Mid tier: 45% | Functional/Unit leaders: 31% | EMEA: 33% |
| Smaller Players: 17% | Managers: 57% | Americas: 19% |
Market-Sizing & Forecasting
The core model uses a top-down build where national output and services revenue proxies are reconstructed by region and then adjusted using print demand indicators and printing intensity. We then corroborated the totals using selective bottom-up checks like sampled printer revenue run-rates, observed print volumes multiplied by typical average selling prices for common job types, and channel conversations on order books to correct for over or under-counting.
Inputs tracked in the model include commercial advertising and direct mail activity, publishing print run trends, packaging and label demand spillover into commercial print houses, paper and ink cost progression, and the shift in technology mix between offset and digital that changes average job values. Where local data gaps exist, peer market ratios and utilization benchmarks were applied, then re-tested through interviews so the regional splits stay realistic.
For forecasting, scenario analysis was used and anchored on expected changes in ad spend, print mail volumes, and the pace of digitization by application. The final growth path was kept consistent with how respondents described their forward pipeline and pricing discipline, rather than relying on a single trend line.
Data Validation & Update Cycle
Outputs were checked against independent signals such as paper consumption trends tied to printing grades, publishing shipment indicators, and regional printing services revenue patterns. If a country result moved too far from these signals, assumptions on utilization, ASP movement, or currency timing were reviewed and then re-tested with follow-up calls.
Before sign-off, the model and logic go through multiple analyst reviews so that unit consistency, year-over-year movements, and regional sums match expectations. Reports are refreshed annually, and interim updates are made when material events occur, such as large facility closures, policy shifts that affect mail and labeling, or abrupt input cost spikes. Right before delivery, we perform a final data pass to ensure clients receive the most current view available.
Mordor Intelligence's Commercial Printing Market Estimate Compared With Other Published Estimates
Published market sizes for commercial printing often vary because each publisher draws the line differently around what counts as commercial output, and because the base year and currency conversion timing are not always aligned. Differences can also come from how fast price changes are assumed to flow through, especially when paper and ink costs are volatile.
The largest gaps usually show up when packaging printing, in-plant corporate print rooms, or adjacent label work is either fully included or only partially counted, and when digital printing is treated as equipment sales instead of service revenue. The spread also grows when forecasts lean optimistic or conservative without being checked against utilization and order-book signals, and when historical years are not re-stated after major macro changes and input-cost resets, a discipline applied by Mordor Intelligence.
Benchmark comparison
| Source | Market Size | Gaps in Research Methodology |
|---|---|---|
| Mordor Intelligence | USD 594.24 B (2026) | |
| Global Consultancy A | USD 510.33 B (2025) | Uses an earlier base year and a different application mapping that can understate segments where printing revenue sits inside broader packaging and publishing service lines, and the currency timing can also differ across regions. |
| Industry Publisher B | USD 838.26 B (2025) | Likely counts a wider scope that blends commercial print with larger packaging and label printing value pools, and the higher starting point can also reflect a more aggressive inclusion of in-plant and adjacent services. |
The table shows that scope choices and year alignment explain most of the range, more than the growth math itself. By tying the model to observable demand indicators and then pressure-testing ASP and utilization assumptions with interview feedback, the estimate stays traceable to clear inputs and repeatable steps, even when market definitions differ across publishers.
Key Questions Answered in the Report
What is the projected global commercial printing revenue by 2031?
The sector is expected to reach USD 704.07 billion by 2031, rising at a 3.45% CAGR from 2026 to 2031.
Which printing technology is expanding fastest through 2031?
Digital inkjet leads with a 4.11% CAGR, driven by variable-data workflows and short-run packaging needs.
Why are packaging applications attracting the most investment?
E-commerce fulfillment, anti-counterfeiting rules, and SKU proliferation are pushing packaging revenues up at a 4.54% CAGR.
Which region offers the highest growth potential for printers?
Asia-Pacific is forecast to advance at a 4.55% CAGR thanks to rising middle-class consumption and stricter labeling mandates.
How are converters managing raw-material price volatility?
Many are vertically integrating into containerboard, pulp, and ink production to secure supply and hedge cost swings.