
Functional Printing Market Size and Share
Market Overview
| Study Period | 2020 - 2031 |
|---|---|
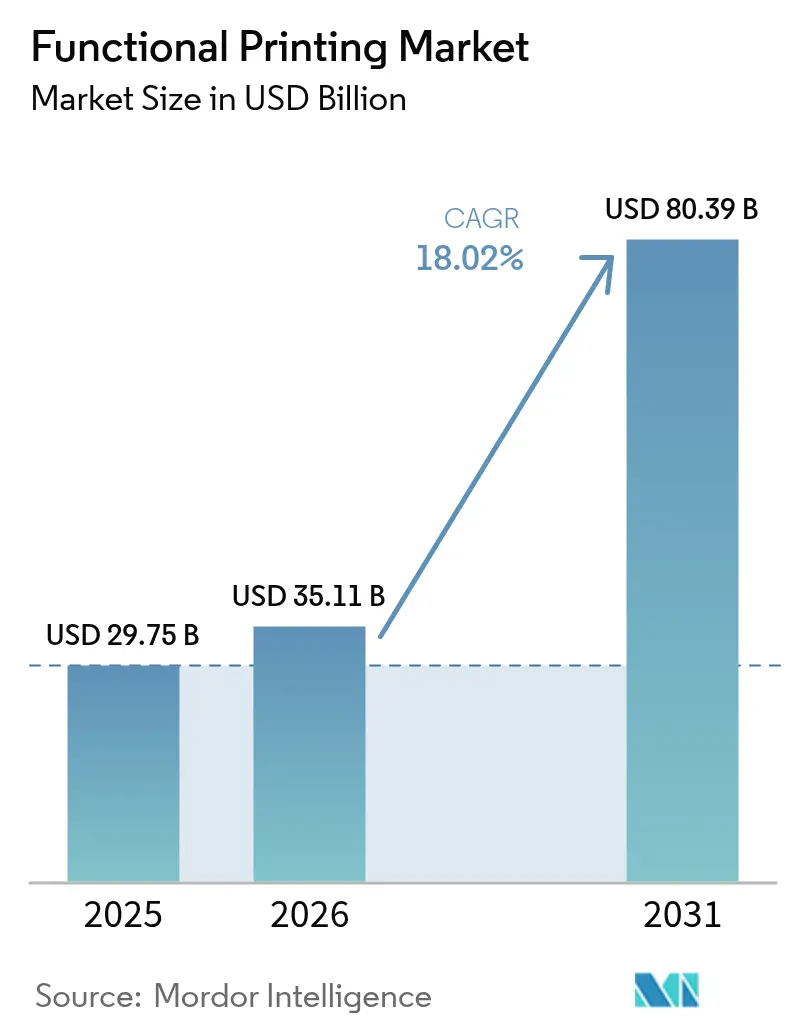
| Market Size (2026) | USD 35.11 Billion |
| Market Size (2031) | USD 80.39 Billion |
| Growth Rate (2026 - 2031) | 18.02 % |
| Fastest Growing Market | Asia Pacific |
| Largest Market | North America |
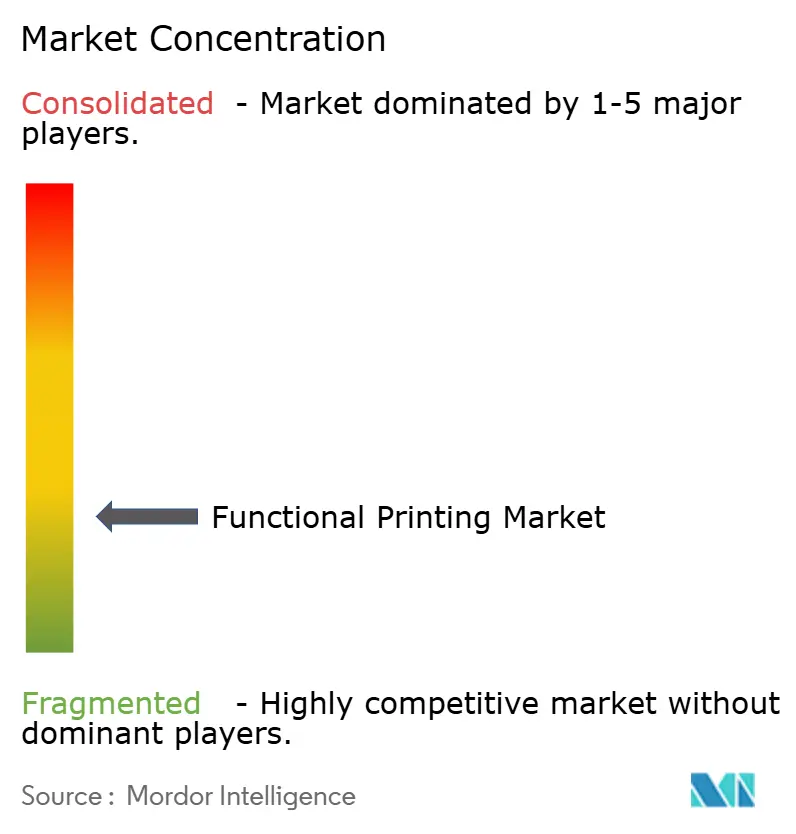
| Market Concentration | Low |
Major Players *Disclaimer: Major Players sorted in no particular order Image © Mordor Intelligence. Reuse requires attribution under CC BY 4.0. | |
Functional Printing Market Analysis by Mordor Intelligence
functional printing market size in 2026 is estimated at USD 35.11 billion, growing from 2025 value of USD 29.75 billion with 2031 projections showing USD 80.39 billion, growing at 18.02% CAGR over 2026-2031. At this trajectory the functional printing market size is positioned to more than double within five years, largely because advances in conductive ink chemistry have pushed achievable line widths below 10 µm while keeping material costs within reach for mass production. Demand accelerates across automotive, packaging, and medical devices where flexible form factors, lightweight assemblies, and low-temperature processing give printed electronics a cost advantage over traditional silicon technology. Manufacturers are increasingly shifting to roll-to-roll equipment that supports high-volume regional production, which reduces capital intensity and shortens supply chains for emerging products such as diagnostic patches and smart labels. Heightened investment flows into silver nanowire production and inkjet process optimization indicate that scale economics are moving steadily in favor of printed solutions for sensors, antennas, and power management films. Market risks remain around precious-metal feedstock volatility and evolving waste-management rules that could shift preferred substrate choices toward recyclable papers or ceramics.
Key Report Takeaways
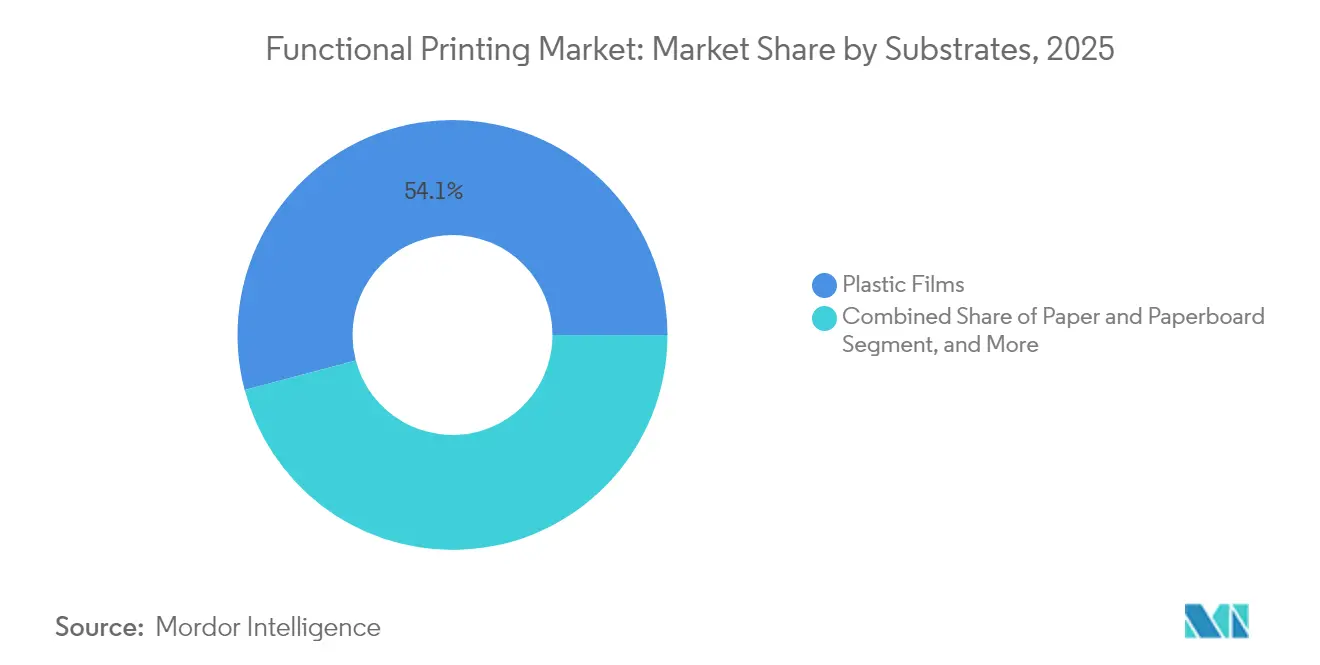
- By substrate, plastic films led with 54.12% of functional printing market share in 2025.
- By ink type, the functional printing market size for nanoparticle-based inks is advancing at 22.12% CAGR between 2026-2031.
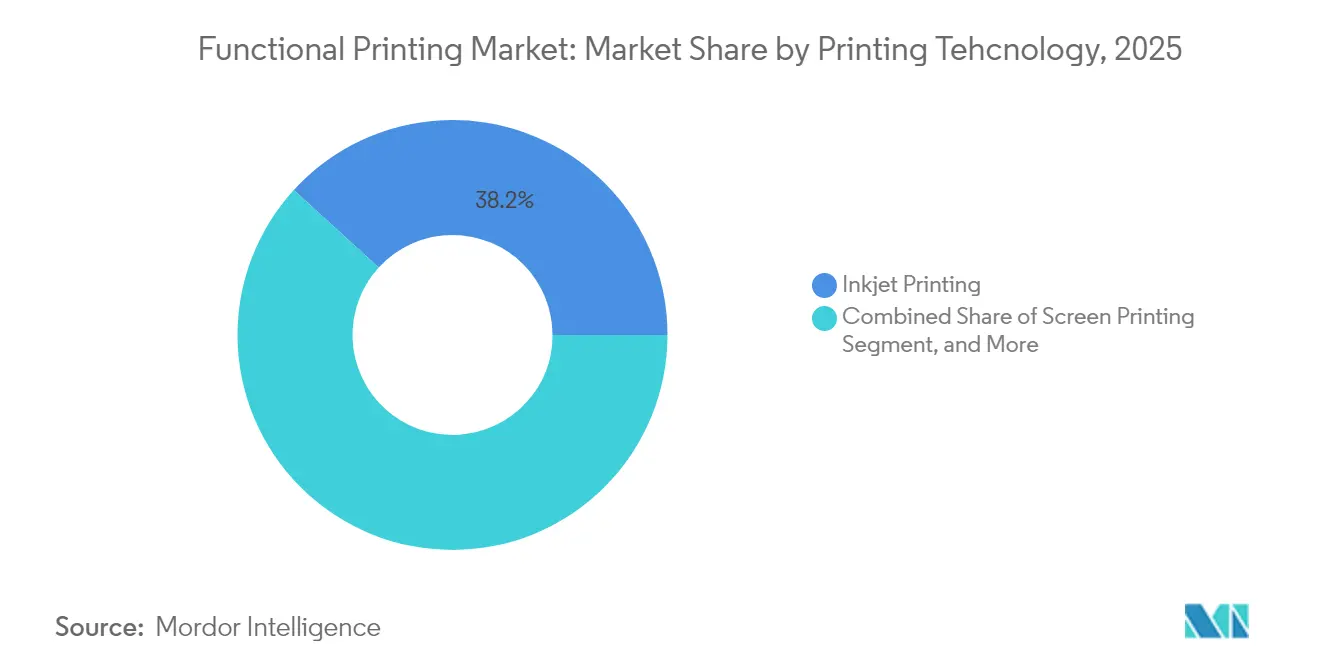
- By printing technology, inkjet captured 38.21% of the functional printing market share in 2025.
- By application, the functional printing market size for RFID/NFC tags shows the fastest 19.96% CAGR between 2026-2031.
- By geography, North America commanded 32.12% functional printing market share in 2025.
Note: Market size and forecast figures in this report are generated using Mordor Intelligence’s proprietary estimation framework, updated with the latest available data and insights as of 2026.
Market Trends and Insights
Drivers Impact Analysis of Functional Printing Market*
| Driver | (~) % Impact on CAGR Forecast | Geographic Relevance | Impact Timeline |
|---|---|---|---|
| Demand for low-cost, high-speed electronic production | +3.2% | Global, with concentration in Asia-Pacific manufacturing hubs | Medium term (2-4 years) |
| Rapid adoption of flexible and wearable electronics | +4.1% | North America & EU for innovation, APAC for manufacturing scale | Short term (≤ 2 years) |
| Advances in conductive and dielectric ink chemistry | +2.8% | Global, led by research centers in US, Germany, Japan | Long term (≥ 4 years) |
| IoT-driven smart packaging volumes | +3.5% | Global, with early adoption in food & pharmaceutical sectors | Medium term (2-4 years) |
| Roll-to-roll 3D structural electronics in e-mobility | +2.9% | Europe & China automotive corridors, expanding to North America | Long term (≥ 4 years) |
| On-skin diagnostic patches for tele-health | +1.9% | North America & EU regulatory approval, APAC manufacturing | Medium term (2-4 years) |
| Source: Mordor Intelligence | |||
Demand for Low-Cost, High-Speed Electronic Production
Cost pressure across the consumer and automotive sectors prompts OEMs to replace photolithography with roll-processed functional circuits that require no cleanroom infrastructure. Automotive battery-management systems now integrate printed temperature and current sensors that cut electronics cost by up to 60% while meeting non-critical accuracy thresholds. Regional fabs equipped with roll-to-roll lines can localize production in under six months, allowing quicker response to design iterations than traditional silicon foundries. This flexibility helps Asian contract manufacturers win new projects for smart packaging inserts and Bluetooth antennas by bundling design support with low-margin, high-volume output. As performance ceilings rise through better ink sintering, the functional printing market gains share in mid-range electronics previously reserved for rigid PCBs.
Rapid Adoption of Flexible and Wearable Electronics
Digitized healthcare embraces on-skin devices that flex naturally with body movement, an area where rigid silicon substrates underperform. Northwestern University’s skin health patch captures hydration and pH data without user discomfort. European cardiology clinics are piloting printed ECG stickers that achieve 96-hour wear without irritation, improving patient compliance. High-yield printing of stretchable circuits enables mass adoption because each unit ships fully functional from the press, reducing costly assembly steps. Asian manufacturers capitalize on scale economics to ship tens of millions of glucose-monitoring patches annually, feeding a global installed base that drives recurring demand for ancillary cloud-based analytics.
Advances in Conductive and Dielectric Ink Chemistry
Breakthroughs in silver nanowire dispersion and copper-oxide reduction lower sheet resistance while trimming precious-metal content by 70% . Carbon-based inks using eco-friendly binders allow strain gauges on biodegradable substrates without sacrificing conductivity[1]Source: J.O. Akindoyo et al., “Eco-Friendly Carbon-Based Conductive Ink,” sciencedirect.com . Dielectric formulations now cure below 120 °C, compatible with temperature-sensitive PET films. Multi-layer prints with alternating conductive and insulating layers create complex circuits inside single press runs, pushing functional printing market applications into RF ID modules and high-frequency antennas.
IoT-Driven Smart Packaging Volumes
The European Digital Product Passport mandate compels consumer-goods firms to embed traceability in packaging, spurring demand for printed RFID tags that cost far less than silicon counterparts. Food logistics chains add printed temperature and humidity sensors to track perishables through cold storage, cutting spoilage rates by double digits. Qualcomm’s integration of RAIN-RFID readers in smartphones provides a ready interface for interactive labels, opening marketing pathways that favor adoption of intelligent packaging. Asian converters running wide-web inkjet lines win contracts on volume pricing, further accelerating functional printing market penetration.
Restraints Impact Analysis of Functional Printing Market*
| Restraint | (~)% Impact on CAGR Forecast | Geographic Relevance | Impact Timeline |
|---|---|---|---|
| Performance gap vs. silicon electronics | -2.1% | Global, particularly in high-performance applications | Long term (≥ 4 years) |
| Lack of global manufacturing standards | -1.4% | Global, with varying regional regulatory frameworks | Medium term (2-4 years) |
| Silver nanoparticle supply volatility | -1.8% | Global supply chains, concentrated in mining regions | Short term (≤ 2 years) |
| E-waste rules targeting non-recyclable substrates | -1.2% | EU leading, expanding to other developed markets | Long term (≥ 4 years) |
| Source: Mordor Intelligence | |||
Performance Gap vs. Silicon Electronics
Printed IGZO transistors still lag silicon mobility benchmarks, limiting uptake in computing and high-speed telecom devices. Silicon carbide’s 2700 °C melting point dwarfs printed electronics’ thermal ceiling below 200 °C, excluding printed circuits from harsh-temperature automotive zones. Mission-critical aerospace and medical implants remain tethered to proven silicon because long-term drift in polymer inks risks field failures. This ceiling confines the functional printing market to segments where flexibility or price trumps ultimate performance.
Lack of Global Manufacturing Standards
Quality norms for printed circuits reside in fragmented IPC or regional guidelines, raising variability across supply chains. Medical regulators require process documentation that smaller contract printers struggle to supply, slowing approvals for wearable diagnostics. Automotive tier-one suppliers impose proprietary standards, forcing each printer to clear multiple audits, which inflates qualification costs. The standards gap affects global roll-outs, particularly for components that cross borders before final assembly.
*Our forecasts treat driver/restraint impacts as directional, not additive. The impact forecasts reflect baseline growth, mix effects, and variable interactions.
Functional Printing Market Segment Analysis
By Substrates:
Glass Ceramics Drive Premium ApplicationsGlass and ceramic substrates are projected to grow at 21.98% CAGR, outpacing the wider functional printing market through 2031. Their thermal stability and optical clarity suit automotive HUD displays and high-temperature pressure sensors. Plastic films retained 54.12% functional printing market share in 2025 by supporting ultrafast, low-cost roll-to-roll lines that supply smart labels and consumer wearables. Despite higher handling costs, glass improves dimensional stability at micron pitches, enabling multilayer OLED backplanes that plastic cannot achieve with sufficient yield.
Manufacturers optimize each substrate choice around curing profiles; PET allows photo-sintered silver within seconds, while ceramic routes use thermal sintering to achieve high conductivity without substrate warping. Paper and nanocellulose boards gain traction for disposable biodevice patches, aligning with circular-economy regulations. Metal foils remain niche for EMI shielding and high-current bus lines where their conductivity offsets added weight. Substrate diversification gives OEMs a palette to match performance with sustainability targets driving balanced growth across segments of the functional printing market.



By Inks:
Nanoparticle Formulations Reshape PerformanceConductive inks captured 64.89% of revenue in 2025 and remain the bedrock of most printed circuits. Yet nanoparticle-based functional inks are forecast to escalate at 22.12% CAGR, underscoring their prowess in reducing line resistance without elevating curing temperature. Silver nanoparticle pastes now reach 10^5 S/m conductivity after photonic sintering, a figure once reserved for bulk metal.Copper inks pare material spend but demand inert-atmosphere curing stations to prevent oxidation, prompting hybrid printing lines that switch atmospheres mid-run.
Dielectric inks evolve alongside conductors; low-loss organosilicate formulations permit GHz-range antennas on thin PET, replacing etched FR-4 in low-power IoT nodes. Photovoltaic and thermoelectric ink systems widen functional printing market addressable use-cases by letting manufacturers coat large solar or energy-harvest layers in minutes. As chemistry innovation accelerates, ink suppliers differentiate on flake geometry, binder biology, and sintering compatibility, deepening collaborative R&D with printer-OEMs.
By Printing Technology:
Inkjet Dominance AcceleratesInkjet captured 38.21% market share in 2025 and maintains the fastest 20.88% CAGR. Its drop-on-demand architecture minimizes ink waste and supports variable data without tooling changes, perfect for individualized smart-label runs . In contrast, screen printing upholds dominance in solar metallization lines where paste thickness, not line width, determines cell efficiency. Aerosol jet systems occupy high-value terrain, spraying circuitry on curved automotive housings and medical catheters where planar processes fail.
Multiphoton 3D printers open pathways for stacked organic electronics on a single build platform, integrating sensors, circuits, and encapsulation in one shot. Gravure and flexography remain go-to solutions for high-speed packaging codes, printing millions of RFID antennas daily. Because no single method rules all, equipment makers now offer hybrid presses combining inkjet for fine lines, slot-die for coatings, and laser trimming for yield control, broadening adoption across diverse functional printing market applications.
By Application:
RFID Tags Outpace Display GrowthDisplay backplanes accounted for 25.21% revenue in 2025 thanks to sustained demand from e-readers and automotive clusters. However, RFID/NFC tags are projected to grow at 19.96% CAGR, overtaking displays as the prime growth engine. The leap stems from mandates on supply-chain transparency and retail inventory accuracy, where each shipment may require multiple low-cost identifiers. E-paper labels piggyback on this rollout, bringing dynamic pricing to supermarkets without the high power draw of LED signage.
Sensor modules account for rising unit volumes in agriculture and infrastructure monitoring, with printed humidity, strain, and gas detectors embedded directly onto walls or bridges during construction. Thin-film batteries printed adjacent to those sensors provide integrated power, turning standalone labels into autonomous nodes. Photovoltaic films enhance off-grid deployments, yet efficiency limitations keep them in supplemental rather than primary energy roles. Collectively, expanding use cases reinforce a positive feedback loop of higher volumes and lower unit costs across the functional printing market.
Geography Analysis
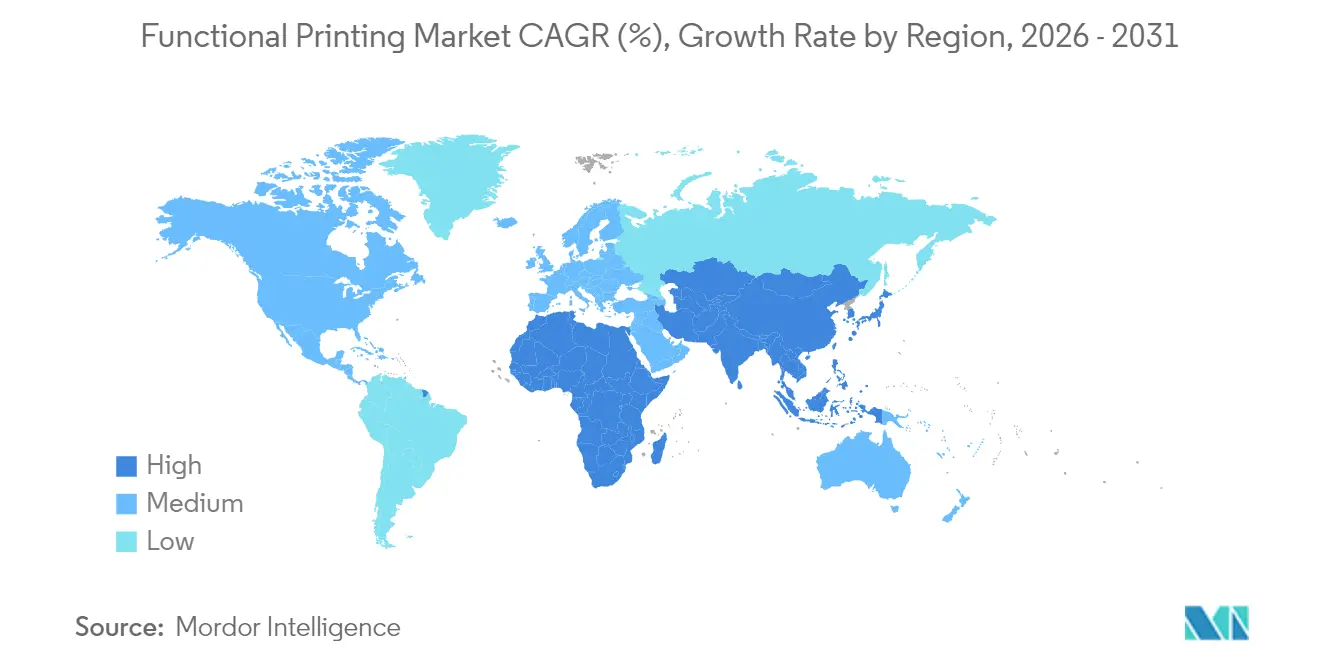
North America and APAC Functional Printing Market
North America maintained leadership with 32.12% share in 2025 on the back of defense avionics and advanced automotive interiors that specify cutting-edge printed films. The functional printing market size for North America is slated to grow steadily on high equipment replacement cycles in flexible PCB lines. Asia-Pacific, meanwhile, is forecast for the quickest 21.09% CAGR, buoyed by Chinese and Japanese incentives that reimburse capital outlays for roll-to-roll production. Elephantech’s USD 20.1 million Series E demonstrates domestic appetite for sustainable printed PCBs.
EMEA and South America Functional Printing Market
European suppliers focus on premium segments such as medical wearables and automotive lidar housings, leveraging stringent regulatory hurdles as a competitive moat. Initiatives like the Reform Project aim to secure a local supply chain for critical inks and substrates, mitigating geopolitical risk. The Middle East and Africa invest in printed solar foils for off-grid lighting, while South American agribusiness deploys low-cost soil-moisture labels to optimize irrigation. These divergent priorities underline why regional specialization rather than one-size-fits-all solutions will drive functional printing market adoption.

Regulatory Landscape
Regulation (EU) 2025/40 on Packaging and Packaging Waste (PPWR) enters into application on August 12, 2026. The framework tightens rules on packaging design, with PFAS restrictions in food-contact packaging and increased documentation requirements around packaging minimization and recyclability. These changes are pushing converters and ink suppliers toward more formal compliance packages for functional layers used in smart labels, RFID/NFC tags, and sensor-enabled packs.
Switzerland's revised Ordinance (SR 817.023.21) took effect February 1, 2026, requiring a Declaration of Compliance for printing ink layers across marketing stages (except retail), reinforced by updated guidance from SVI. EuPIA issued an April 2026 information note on PFAS and printing inks to support limit-value interpretation and accelerate adoption of Statements of Composition and traceability across the supply chain.
Competitive Landscape
The functional printing market remains moderately fragmented. Top incumbents integrate vertically across ink formulation, substrate coating, and downstream assembly to secure margin and shorten development cycles. DuPont’s purchase of C3Nano’s silver-nanowire business in August 2024 strengthened its hold over transparent conductive films used in touch panels and EMI shielding. TOPPAN leverages semiconductor-grade clean processing to deliver coreless interposers that directly compete with traditional IC substrates, expanding its reach into high-density interconnects.[4]Source: TOPPAN Security, “Acquisition of dzcard Group,” holdings.toppan.com
Dracula Technologies brings printed energy-harvest layers to passive IoT labels, while Sakuu partners with SK On to commercialize solvent-free printed batteries that bypass conventional wet-slurry lines. Licensing deals flourish as equipment OEMs embed proprietary sintering modules inside turnkey presses, helping ink developers extend reach without heavy capex. Patent filings concentrate on alloyed nanoparticle blends and rapid photonic curing parameters, signaling technology-based moats rather than scale-only competition.
Price competition intensifies in commodity RFID antennas, where Asian converters run fully amortized gravure presses at razor-thin margins. In contrast, biomedical sensor suppliers command premium pricing on account of regulatory validation and data-integrity requirements. Tier-one automotive contracts increasingly bundle lifetime service and software analytics, shifting rivalry from hardware sales to ecosystem ownership. Overall, the balance of power tilts toward firms that combine proprietary chemistry with end-use application knowledge, anchoring value creation in the functional printing market.
Functional Printing Industry Leaders
Avery Dennison Corporation
BASF SE
Altana AG
Mark Andy Inc.
AGFA-Gevaert Corporation
- *Disclaimer: Major Players sorted in no particular order
Functional Printing Market Companies Covered in this Report
- Avery Dennison Corp.
- BASF SE
- Blue Spark Technologies
- E Ink Holdings Inc.
- Eastman Kodak Co.
- Enfucell Oy
- GSI Technologies LLC
- Isorg SA
- Mark Andy Inc.
- ALTANA AG
- Agfa-Gevaert NV
- Ceradrop – MGI Group
- DuPont de Nemours Inc.
- Samsung Electronics (Printed Solutions)
- LG Display Co.
- Molex LLC
- Thinfilm Electronics ASA
- Toppan Forms Co.
- Toyo Ink SC Holdings
- Optomec Inc.
- Xaar PLC
- Xennia Technology Ltd.
- Kateeva Inc.
- NovaCentrix
- Cambrios Advanced Materials
- Nano Dimension Ltd.

Market Opportunities and Future Outlook
Packaging-driven functional printing is gaining traction where compliance and recyclability requirements can be met through functional layer substitution rather than complex structures. With the PPWR application date approaching, brand owners are looking to simplify packaging formats and reduce problematic chemistries, which supports demand for inks and coatings that deliver multiple functions in fewer layers. Roadmaps from Siegwerk highlight CIRKIT OXYBAR WHITE (oxygen barrier integrated into the white ink layer) in June 2026, and UniLEAF acrylic-free, water-based flexo ink for paper and board in April 2026, pointing to a focus on barrier performance, lower material complexity, and design-for-recycling alignment.
Converter investments in high-performance printing capacity are supporting commercialization paths for smart and functional packs across labels and cartons, particularly where short to medium runs and variable data are needed for traceability and interactive packaging. Amcor's April 2026 investment in a high-performance flexographic printing line in Hardenberg, Netherlands, adds 6,000 tonnes of annual capacity, and the March 2026 deployment of the Gallus Five hybrid press at Artes Etichette shows how hybrid and upgraded platforms are being used to reduce setup waste while maintaining industrial throughput. Together, these moves support opportunities for printed RFID/NFC, smart-label sensors, and fiber-based barrier packaging that aligns with recycling schemes.
Recent Industry Developments in Functional Printing Market
- April 2026: Amcor announced a high-performance flexographic printing line installation in Hardenberg, Netherlands, adding 6,000 tonnes of annual capacity. The announcement signals a shift toward scalable print-on-demand in barrier and smart-pack substrates. It also reflects continued investment in capabilities that support integrated functionality at scale.
- June 2025: Avery Dennison announced an industry-first RFID label recognized by the Association of Plastic Recyclers (APR) for compatibility with the North American PET recycling stream. The update targets design-for-recycling constraints and supports broader item-level RFID adoption.
- August 2024: DuPont completed acquisition of C3Nano's silver-nanowire business, expanding its portfolio of conductive films used in touch panels and EMI shielding. The transaction strengthens vertical integration in functional inks and films.


Functional Printing Market Report Scope and Research Methodology
Market Definition and Coverage
For this study, functional printing is defined as printing processes that deposit conductive, dielectric, or other functional materials onto a substrate so the printed layer performs an electronic or sensing function, not just graphics.
Scope exclusions: We exclude conventional graphic-only printing and decorative label printing where no functional electrical, optical, or sensing performance is delivered.
Segments Covered in This Report
- By Substrates
- Paper and Paperboard
- Plastic Films
- Glass and Ceramics
- Metal Foils and Flex-metals
- By Inks
- Conductive Inks
- Dielectric and Insulating Inks
- Semiconductive and PV Inks
- Nanoparticle-based Functional Inks
- By Printing Technology
- Inkjet Printing
- Drop-on-Demand Inkjet
- Continuous Inkjet
- Screen Printing
- Gravure Printing
- Flexography Printing
- Aerosol Jet Printing
- Other Printing Technology
- Inkjet Printing
- By Application
- Sensors
- Temperature and Humidity Sensors
- Pressure and Force Sensors
- Biosensors and Wearables
- Displays
- E-paper Displays
- OLED Displays
- OLED Lighting Panels
- Flexible Thin-film Batteries
- Photovoltaic
- Organic PV
- Perovskite PV
- RFID and NFC Tags
- Other Application
- Sensors
- By Geography
- North America
- United States
- Canada
- Mexico
- Europe
- Germany
- United Kingdom
- France
- Italy
- Spain
- Russia
- Rest of Europe
- Asia-Pacific
- China
- Japan
- South Korea
- India
- ASEAN
- Australia
- Rest of Asia-Pacific
- Middle East and Africa
- Middle East
- GCC
- Turkey
- Rest of Middle East
- Africa
- South Africa
- Egypt
- Nigeria
- Rest of Africa
- Middle East
- South America
- Brazil
- Argentina
- Rest of South America
- North America
Data Sources, Market Sizing, and Validation
Desk Research
Desk research was used to build the base structure of the market and to anchor assumptions that are hard to confirm from company materials alone. We relied on public sources such as customs and trade statistics, patent databases, peer reviewed journals on printed electronics and materials, and standards or guidance from electronics and packaging bodies.
To keep the model practical, we also used sources such as annual reports, investor presentations, press releases, and association websites to understand product launches, capacity additions, and adoption signals across RFID, sensors, and display related use cases. In addition, paid subscriptions for company financials and intelligence, news and financials, and patent coverage were used to cross-check timelines, ownership structures, and technology pathways. The desk research sources listed are illustrative only, and other public and paid sources were also referred to for data collection, validation, and clarification.
Primary Interviews and Surveys
Primary work focused on validating what portion of printed electronics demand is actually addressed through functional printing processes, and how quickly adoption is moving in each major end market. We spoke with a mix of material suppliers, printing equipment participants, converters, and downstream adopters across APAC, EMEA, and the Americas, so gaps from desk research could be closed and assumptions could be stress-tested before finalizing totals.
Distribution of primary research fieldwork respondents
| Company type | Respondent position | Region |
|---|---|---|
| Top tier: 32% | CXOs: 12% | APAC: 46% |
| Mid tier: 52% | Functional/Unit leaders: 31% | EMEA: 35% |
| Smaller Players: 16% | Managers: 57% | Americas: 19% |
Market-Sizing & Forecasting
Sizing starts from a top-down demand pool build using printed electronics adoption signals, and then the total is reconstructed by mapping application demand into printable functional layers and typical value capture in the process chain. To keep it grounded, the model leans on inputs such as printed area growth by application, penetration of RFID and sensor formats, conductive ink and substrate cost movements, the shift toward roll-to-roll manufacturing, and regional manufacturing intensity.
Once the first pass is built, selective bottom-up approximations are used as a check. These include sampled ASP x volume logic for key use cases, channel checks with converters, and sanity checks based on supplier revenue exposure to functional inks, substrates, and related process services. If a sub-segment has limited visibility, the gap is handled through proxy indicators like installation activity, adoption rates shared by interviewees, and conservative uptake curves that are then revisited during validation.
For forecasting, we used scenario analysis supported by a simple multivariate regression view on the most stable drivers, such as electronics production outlook, packaging digitization, and the pace of sensor adoption in industrial and healthcare use cases. Assumption ranges were reviewed with primary experts so short-term volatility in material pricing does not get mistaken for long-term demand change.
Data Validation & Update Cycle
Outputs are checked through triangulation across independent signals, and then variances are investigated before numbers are locked. We compare modeled totals against related indicators like printed electronics shipment trends, application-level adoption commentary, and regional manufacturing activity, and then internal analyst reviews focus on outliers and sudden step changes.
If a major variance shows up, we re-contact sources to confirm whether it is a real market shift or a data timing issue, for example delayed program rollouts or a pricing reset in conductive materials. The report is refreshed annually, and interim updates are made when material events occur. Before delivery, a fresh pass is completed so clients receive the latest updated view.
Mordor Intelligence's Functional Printing Market Estimate Compared With Other Published Estimates
Published market sizes for functional printing can look far apart, even when they appear to cover similar technology. The differences usually come from what is counted as functional value, how fast adoption is assumed in the main end uses, and how pricing is handled for inks, substrates, and printed layers.
Some estimates also fold in finished device value for items like sensors, displays, or RFID inlays, and they may carry forward aggressive uptake assumptions that are not checked against near-term deployments. Those add-ons sit outside the counted market here, and Mordor Intelligence restricts the calculation to printed functional layers and related process value, with ink and substrate ASPs refreshed using recent material pricing and converter feedback.
Benchmark comparison
| Source | Market Size | Gaps in Research Methodology |
|---|---|---|
| Mordor Intelligence | USD 29.75 B (2025) | |
| Trade Journal A | USD 21.12 B (2025) | Uses a narrower build that emphasizes a limited set of applications and a shorter list of printing methods, and it applies more conservative adoption expectations outside core electronics use cases. |
| Global Consultancy B | USD 30.19 B (2025) | Likely applies a broader inclusion that blends in more printed electronics and device-level value, and it can also assume faster scaling in later years, which increases the implied average value captured per application. |
Overall, the spread is mainly explained by scope choices and how quickly adoption is assumed in RFID, sensors, and display related use cases, followed by differences in how ink and substrate pricing is rolled forward. By tying the number to repeatable demand indicators and then cross-checking with supplier and converter feedback, the sizing stays traceable and easier to reproduce year after year.


Key Questions Answered in the Report
What is the projected value of the functional printing market by 2031?
The market is forecast to reach USD 80.39 billion by 2031, growing at an 18.02% CAGR.
Which region is expected to grow most rapidly?
Asia-Pacific is set to expand at 21.09% CAGR, outpacing all other geographies because of manufacturing incentives and strong electronics supply chains.
Why is inkjet printing gaining such a large share?
Inkjet combines fine-line resolution with minimal material waste, helping it secure 38.21% revenue share in 2025 while posting the highest 20.88% CAGR.
How significant are conductive inks within the market?
Conductive formulations held 64.89% of 2025 revenue, underpinning most printed circuits and antennas.
What factors currently restrain wider adoption of printed electronics?
Electrical performance gaps versus silicon devices, fragmented manufacturing standards, and silver price volatility all apply downward pressure on growth, together shaving up to 6.5 percentage points off potential CAGR.
Which application segment shows the fastest growth?
RFID and NFC tags lead with a 19.96% CAGR, propelled by supply-chain digitization mandates and expanding smartphone reader infrastructure.
Page last updated on:





