
Market Overview
| Study Period | 2020 - 2031 |
|---|---|
| Market Size (2026) | USD 6.19 Billion |
| Market Size (2031) | USD 8.71 Billion |
| Growth Rate (2026 - 2031) | 7.06 % |
| Fastest Growing Market | Asia Pacific |
| Largest Market | North America |
| Market Concentration | Medium |
Major Players
*Disclaimer: Major Players sorted in no particular order Image © Mordor Intelligence. Reuse requires attribution under CC BY 4.0. |
|
Thermal Imaging Systems Market Analysis by Mordor Intelligence
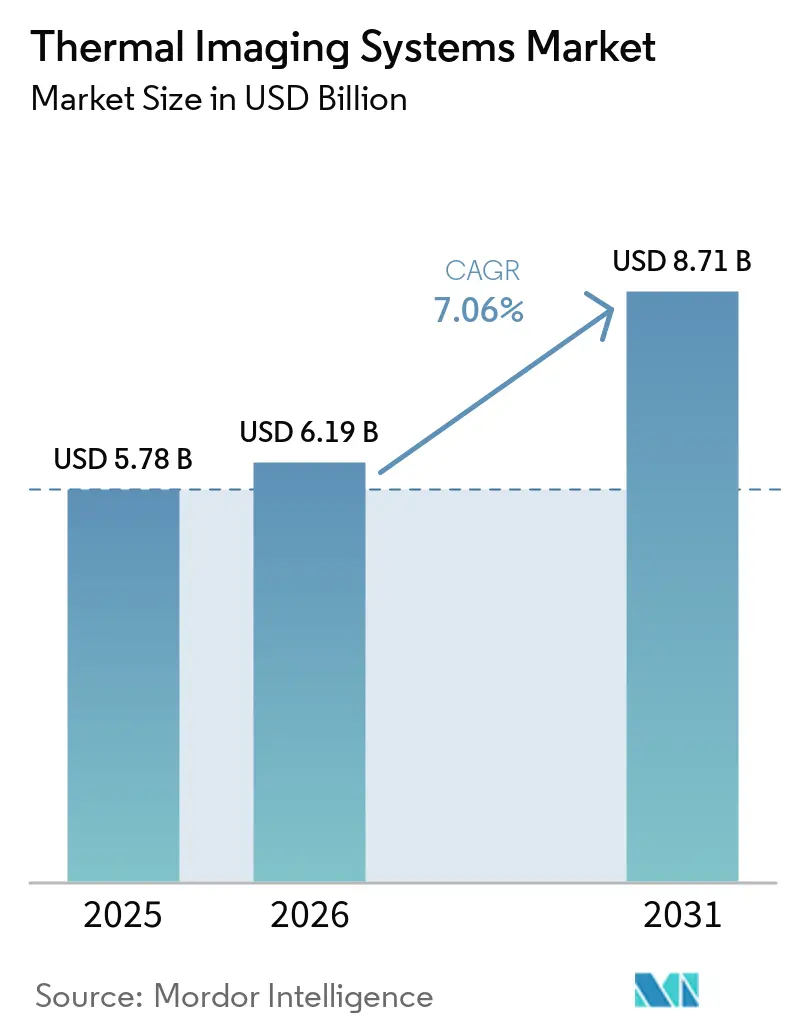
The thermal imaging systems market size is expected to grow from USD 5.78 billion in 2025 to USD 6.19 billion in 2026 and is forecast to reach USD 8.71 billion by 2031 at 7.06% CAGR over 2026-2031. Accelerating defense modernization, expanding industrial automation, and mandated automotive safety features are converging to keep demand elevated. Standardization around NFPA-70B thermography is stimulating steady procurement cycles in manufacturing and utilities, while uncooled long-wave infrared (LWIR) price declines are widening accessibility. In parallel, vehicle makers are integrating night-vision cameras into Advanced Driver-Assistance Systems (ADAS) to comply with pending pedestrian-protection rules. The momentum is reinforced by Indo-Pacific ISR budgets, with military programs in the United States and Australia placing multi-year orders for next-generation FLIR sensors.
Key Report Takeaways
- By application, security and surveillance commanded 37.62% of 2025 thermal imaging systems market share, while automotive ADAS is forecast to post a 7.66% CAGR to 2031.
- By form factor, hand-held units led with 45.78% revenue share in 2025; integrated OEM modules are projected to register a 7.13% CAGR through 2031.
- By technology, uncooled LWIR retained 71.92% of 2025 thermal imaging systems market size; short-wave infrared (SWIR) is expected to be the fastest-growing segment at 7.38% CAGR.
- By component, complete cameras generated 53.67% of 2025 sales, yet software analytics is positioned for the highest 8.62% CAGR by 2031.
- By end-user, defense accounted for 35.12% of 2025 revenue, though automotive is forecast to expand at an 7.86% CAGR during 2026-2031.
Note: Market size and forecast figures in this report are generated using Mordor Intelligence’s proprietary estimation framework, updated with the latest available data and insights as of 2026.
Market Trends and Insights
Drivers Impact Analysis of Thermal Imaging Systems Market*
| Driver | (~) % Impact on CAGR Forecast | Geographic Relevance | Impact Timeline |
|---|---|---|---|
| Falling price of uncooled micro-bolometers | +1.2% | Global, strongest in APAC & emerging markets | Medium term (2-4 years) |
| Growing defense ISR budgets in Indo-Pacific | +1.8% | APAC core, spill-over to North America | Long term (≥ 4 years) |
| Mandatory NFPA-70B thermography | +0.9% | North America & EU, adoption in industrial hubs | Short term (≤ 2 years) |
| Vehicle OEM push for cost-effective ADAS night-vision | +1.4% | Global manufacturing centers, led by EU & APAC | Medium term (2-4 years) |
| AI-enabled predictive maintenance in smart factories | +0.8% | Germany, Japan, South Korea, China | Medium term (2-4 years) |
| Climate-driven wildfire monitoring demand | +0.5% | North America West Coast, Australia, Mediterranean | Long term (≥ 4 years) |
| Source: Mordor Intelligence | |||
Falling Price of Uncooled Micro-Bolometers
Cost curves for uncooled detectors continue to decline, enlarging addressable opportunities beyond defense and heavy industry. Scale economies, simplified fabrication, and alternative chalcogenide optics from firms such as LightPath are mitigating historic germanium bottlenecks. Smartphone OEMs are piloting thermal add-ons, and fleet operators are specifying thermographic inspections under corporate ESG programs. The broader commercial reach strengthens pricing power for analytics software that converts raw images into actionable insights.
Growing Defense ISR Budgets in Indo-Pacific
Regional security competition is stimulating long-range surveillance procurements. The United States’ Pacific Deterrence Initiative allocates USD 9.9 billion for advanced sensors, while Australia’s AUD 50 billion (USD 34.7 billion) defense roadmap earmarks funds for multispectral imaging platforms. [1]Department of Defense, "Pacific Deterrence Initiative FY 2025," comptroller.defense.govCombined with SBIR grants supporting dual-band FLIR arrays, the pipeline sustains multi-year volume visibility for detector foundries and optics suppliers.
Mandatory NFPA-70B Thermography for Electrical Safety
The 2024 edition of NFPA-70B moves thermography from a recommended to a required practice in preventive maintenance, compelling factories, data centers, and utilities to equip electrical technicians with calibrated imagers.[2]Mike Amundsen, “What are the Reporting Requirements for Thermography According to NFPA 70B 2023,” IRInfo, irinfo.orgInspection frequency clauses promote recurring hardware refresh cycles and subscription analytics, fortifying mid-single-digit replacement demand even in mature markets.
Vehicle OEM Push for Cost-Effective ADAS Night-Vision
Upcoming pedestrian automatic emergency-braking mandates are accelerating the inclusion of thermal sensors alongside radar and LiDAR in Level 2-plus platforms. Lens suppliers such as Ophir Optics have scaled automotive-grade infrared glass to meet stringent reliability standards. Tier-1s are selecting narrow-field modules with on-chip AI to minimize central ECU loads, a move that supports incremental detector ASP uplift within the cost-constrained passenger-car value chain.
Restraints Impact Analysis of Thermal Imaging Systems Market*
| Restraint | (~) % Impact on CAGR Forecast | Geographic Relevance | Impact Timeline |
|---|---|---|---|
| Export-control regimes (ITAR & EAR) | -0.7% | Global, strongest on US exporters | Long term (≥ 4 years) |
| High cap-ex for cooled MWIR cameras | -0.4% | Defense & aerospace globally | Medium term (2-4 years) |
| Supply-chain choke points in germanium optics | -0.6% | Precision optics worldwide | Short term (≤ 2 years) |
| Cyber-security risks in networked cameras | -0.3% | Connected infrastructure globally | Medium term (2-4 years) |
| Source: Mordor Intelligence | |||
Export-Control Regimes (ITAR & EAR)
Evolving US export rules mandate licenses for many dual-use focal-plane arrays and optics kits, elongating sales cycles and limiting addressable international revenue.[3]U.S. Department of Commerce, “15 CFR § 743.3 – Thermal imaging camera reporting,” Cornell Law School, law.cornell.edu Recent proposals would pull previously uncontrolled commercial imagers into license categories, prompting OEMs to accelerate non-US supply-chain localization. The policy uncertainty introduces compliance costs that particularly burden small-volume niche innovators.
High Cap-Ex for Cooled MWIR Cameras
Cooled mid-wave solutions deliver superior sensitivity and long-range detection yet require integrated cryocoolers, driving unit prices beyond the budgets of many civilian buyers. Capital intensity continues to confine adoption to defense, aerospace, and select petrochemical sites where performance justifies cost.
*Our forecasts treat driver/restraint impacts as directional, not additive. The impact forecasts reflect baseline growth, mix effects, and variable interactions.
Thermal Imaging Systems Market Segment Analysis
By Application:
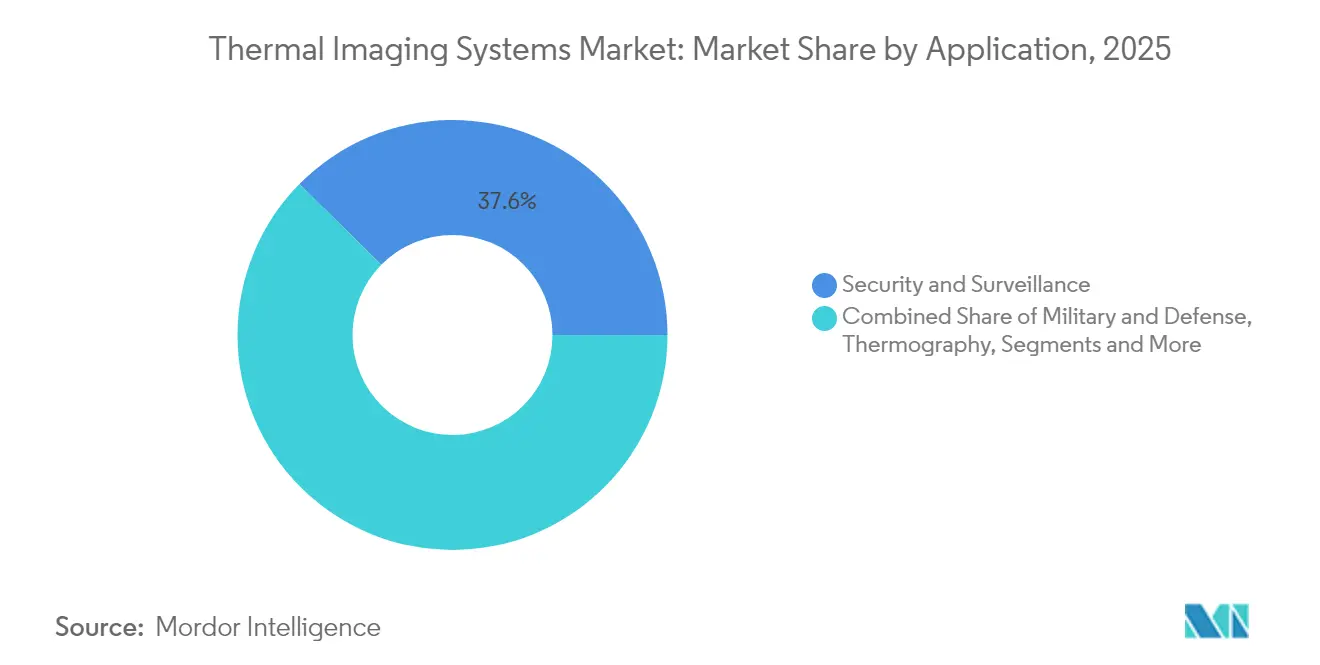
Security Dominance Amid ADAS AccelerationSecurity and surveillance held 37.62% of 2025 revenue, reinforcing the foundational role of perimeter protection in the thermal imaging systems market. Increasing border-control spending and critical infrastructure hardening sustain procurement of fixed and pan-tilt-zoom cameras, while AI-driven analytics cut operator workload. Automotive ADAS, the fastest-growing application at a 7.66% CAGR, capitalizes on regulatory nudges for pedestrian safety and automated emergency braking. OEM design cycles that once specified infrared as optional are now embedding compact modules into higher-volume trims, broadening annual shipment baselines.
Demand diversification is evident in thermography services as factories comply with NFPA-70B, creating annuity-style inspection revenue. Firefighting agencies are equipping frontline responders with thermal monoculars and thermal scanners, leveraging satellite-driven hotspot alerts for rapid deployment. Emerging mobile apps pairing smartphones with clip-on micro-bolometers signal the consumerization phase of the thermal imaging systems market.



By Form Factor:
Handheld Leadership Challenged by OEM IntegrationHand-held imagers captured 45.78% of 2025 revenue, favored for versatility across preventive maintenance, law enforcement, and first-responder scenarios. The convenience of battery-operated units sustains significant replacement demand, especially as detector resolution improves. Integrated OEM modules, however, are set to outpace at a 7.13% CAGR, underpinning the expansion of the thermal imaging systems market size inside vehicles, drones, and smart appliances. Fixed-mount solutions remain indispensable in perimeter security and process monitoring where 24/7 coverage is mandatory.
Military procurement emphasizes Size, Weight, Power, and Cost (SWaP-C) gains, driving proprietary shutterless calibration and edge AI to compress payload footprints. Flexible infrared sensors in development promise future wearables, although commercialization is still several design iterations away.
By Technology:
Uncooled LWIR Dominance Faces SWIR ChallengeUncooled LWIR retained 71.92% of 2025 thermal imaging systems market share thanks to favorable economics and broad spectral suitability. SWIR’s projected 7.38% CAGR rests on its ability to pierce smoke, haze, and glass, positioning it for airborne surveillance, industrial analytics, and mining. Cooled MWIR stays essential for missile tracking and border surveillance where extreme sensitivity is non-negotiable despite higher lifecycle cost.
Defense R&D investments in dual-band focal-plane arrays are blurring traditional boundaries, enabling combined LWIR-MWIR payloads that shorten target identification times. Commercial interest in multispectral fusion is accelerating as security integrators seek to curb nuisance alarms in critical infrastructure.
By Component:
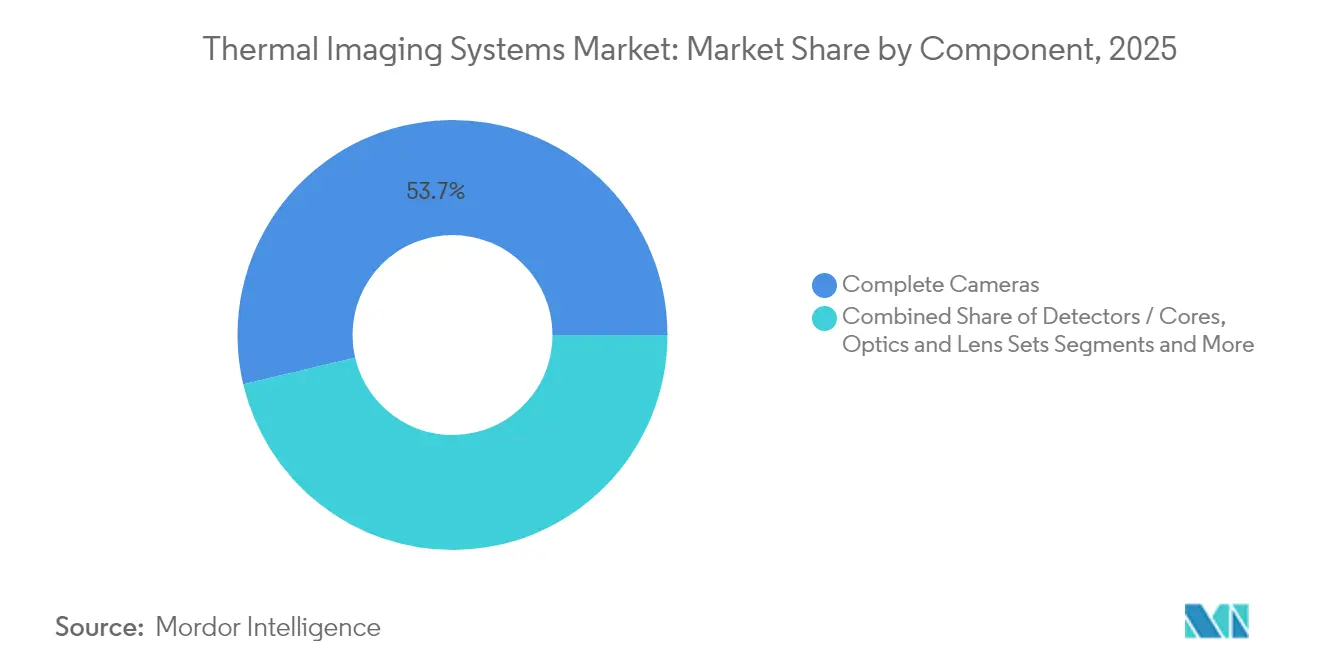
Software Analytics Drive Value CreationComplete cameras generated 53.67% of 2025 sales, but revenue gravity is shifting toward software platforms that convert imagery into prescriptive maintenance or threat alerts. Analytics subscriptions are forecast for an 8.62% CAGR as plant managers prioritize OPEX over CAPEX. Optics and lens sets must evolve to meet higher pixel densities, while detector manufacturers invest in wafer-level packaging to cut costs.
Edge computing inside cameras minimizes cloud round-trip latency, and post-quantum encryption initiatives are becoming table stakes for critical-infrastructure bids. Camera makers bundling secure firmware, AI toolchains, and continuous updates are capturing premium margins in the thermal imaging systems market.
By End-User Industry:
Defense Leadership Amid Automotive SurgeDefense commanded 35.12% of 2025 sales, a role unlikely to weaken given ISR funding trajectories. Still, automotive ADAS, at an 7.86% CAGR, supplies the steepest volume ramp and broadens the customer mix within the thermal imaging systems industry. Industrial verticals use thermography to pre-empt downtime, while commercial real-estate security modernizes with coordinated visible-thermal analytics. Medical fever screening remains niche but steady as hospitals maintain elevated hygiene protocols.
Wildfire management agencies partner with satellite operators to secure sovereign imagery, while insurance firms encourage factory upgrades to lower fire-related payouts. These diverse demand vectors insulate suppliers from single-vertical volatility and underpin healthy top-line visibility.
Geography Analysis
North America Thermal Imaging Systems Market
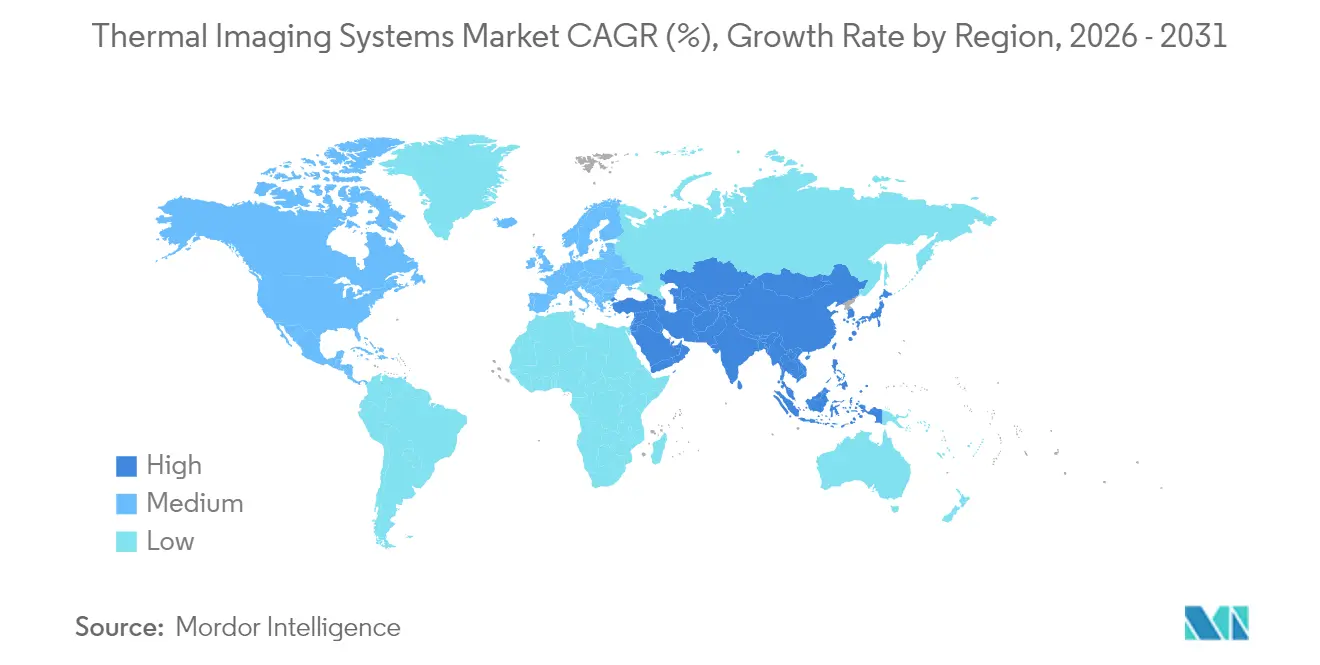
North America led with 41.02% of 2025 spending, reflecting defense allocations such as the US Army’s USD 117.5 million order for third-generation FLIR sensors. NFPA-70B compliance further bolsters industrial uptake, and automotive Tier-1s are piloting night-vision programs for 2027 model years. Cybersecurity directives from CISA drive premium demand for hardened firmware, enabling US-based vendors to maintain pricing discipline.
APAC Thermal Imaging Systems Market
Asia-Pacific is projected to log the highest 8.08% CAGR as Japan, South Korea, India, and Australia diversify ISR fleets and expand vehicle exports. China’s share shift from 15% to 63% in thermography during 2019-2020 illustrates the manufacturing scale at play. Indigenous sensor ecosystems are maturing, yet export controls restrict access to state-of-the-art US technology, fueling regional R&D investment.
EMEA and South America Thermal Imaging Systems Market
Europe posts steady growth, buoyed by defense optronics orders and automotive safety regulations. HENSOLDT’s 34% revenue surge in its Optronics segment underscores resilient procurement. Middle East and Africa register firm demand for perimeter surveillance, with Teledyne FLIR shipping multi-sensor pods to Saudi Arabia. South America remains emergent, but industrial maintenance and public-safety budgets point to incremental upside.

Regulatory Landscape
Thermal imaging systems that meet higher performance thresholds remain constrained by export-control regimes, particularly the United States Export Administration Regulations (EAR), which impose reporting and licensing obligations for certain thermal camera classifications (for example, under 15 CFR 743.3 and related controls). Enforcement has also become a practical compliance driver for suppliers and integrators using global channels. In February 2026, the U.S. Department of Commerce Bureau of Industry and Security (BIS) issued a final order imposing a USD 1 million civil penalty on Teledyne FLIR LLC tied to alleged EAR violations involving thermal cameras, underscoring the need for rigorous classification, licensing, and de minimis calculations across multinational supply chains.
On the safety and performance side, standards and procurement programs are tightening specifications for public-safety use cases. NFPA 1801:2021 (referenced through fire-service standards updates) is supporting more consistent performance baselines for fire-service thermal imagers, with a noted transition deadline in June 2026 for certification continuity in affected programs. In parallel, ISO work on fire-detection applications has progressed, with ISO/FDIS 7240-33 (thermal imaging fire detectors) reaching formal approval status in March 2026, signaling continued standardization that affects product validation, documentation, and acceptance testing for manufacturers selling into regulated fire and safety deployments.
Value Chain Analysis
The thermal imaging systems value chain starts with raw materials and specialized components, then moves through detector and camera-core fabrication, optics manufacturing, camera assembly, software and analytics, and finally distribution through defense primes, industrial automation integrators, and security and public-safety channels. Upstream, microbolometer wafers (commonly VOx or a-Si) and cooled detector ecosystems depend on semiconductor processing capacity and packaging know-how, while optics suppliers manage infrared lens materials and coatings. Component constraints remain a risk, since thermal optics have historically been exposed to germanium availability and price volatility, and suppliers have responded by investing in alternative materials such as chalcogenide glass (notably via LightPath) to reduce reliance on constrained inputs.
Midstream capacity moves and partnerships increasingly shape lead times and cost curves for OEMs. In December 2024, Obsidian Sensors announced a manufacturing partnership with Japan Display Incorporated (JDI) to produce 12-micron pitch, SXGA-resolution microbolometers at JDI's Gen 4.5 fab in Ishikawa, Japan, targeting a 2026 production launch. Downstream, differentiated value is shifting toward software and analytics (edge inference, predictive maintenance, and secure firmware updates), while defense-grade systems add an extra compliance layer (export controls, end-user screening, and documentation) that affects routing, localization decisions, and distributor and integrator selection by major OEMs.
Competitive Landscape
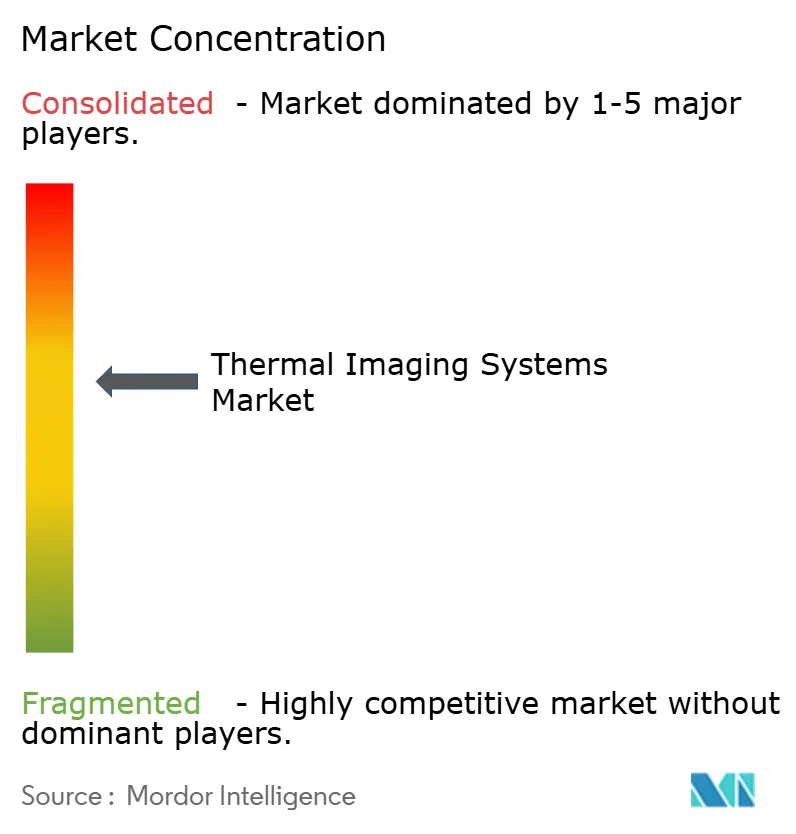
The thermal imaging systems market features moderate concentration, with diversified conglomerates, focused defense contractors, and specialized optics suppliers contending for share. Teledyne’s USD 770 million 2025 acquisition spree underscores a strategy of technology breadth and vertical integration. Leonardo DRS leveraged record Q1 2025 bookings of USD 1 billion to scale dual-use product lines.
Players differentiate through proprietary detectors, ruggedized optics, and AI-enabled analytics. Partnerships with automotive Tier-1s help capture ADAS pipelines, while OEMs court industrial integrators to embed analytics into factory MES platforms. Material-science innovation, notably alternative chalcogenide lenses, offers a hedge against germanium risks. Start-ups that focus on wildfire monitoring or cloud-native predictive maintenance force incumbents to balance defense backlogs with commercial agility.
Three strategic patterns dominate: 1) acquisition-driven portfolio expansion to address white-space verticals; 2) dual-use technology transfer from defense to commercial sectors; and 3) investment in secure, upgradable software stacks to lock in lifecycle revenue. The result is a competitive field where brand reputation, export-licensing expertise, and R&D velocity remain decisive.
Thermal Imaging Systems Industry Leaders
-
Opgal Optronic Industries Ltd.
-
Fluke Corporation
-
Testo Inc.
-
Seek Thermal Inc.
-
Teledyne FLIR
- *Disclaimer: Major Players sorted in no particular order
Thermal Imaging Systems Market Companies Covered in this Report
- Teledyne FLIR
- Opgal Optronic Industries
- Fluke Corporation
- Seek Thermal
- Axis Communications
- Leonardo DRS
- Raytheon Technologies
- L3Harris Technologies
- Lockheed Martin
- Testo SE and Co. KGaA
- Bullard
- Hikmicro (Hikvision)
- Guide Sensmart
- Excelitas (Xenics)
- BAE Systems
- HT Italia
- Trijicon
- Zhejiang Dali
- Pelco
- Yantai IRay

Market Opportunities and Future Outlook
Industrial automation and predictive maintenance create whitespace for long-life, always-on thermal monitoring aimed at factory uptime requirements, where demand can shift toward higher-duty-cycle cameras and analytics subscriptions. Product roadmaps in 2026 show alignment with this need, highlighted by the February 2026 launch of the FLIR A6450 long-life cooled MWIR camera, positioned for 24/7 industrial automation with a stated 27,000-hour operational life, and the June 2026 integration partnership between FLIR and edevis to embed A6450 cameras into automated non-destructive testing workflows for structural defect detection. Together, higher-endurance hardware and workflow integration support opportunities in automated inspection cells, continuous process monitoring, and advanced NDT when thermography is embedded rather than used as a periodic handheld inspection.
A second opportunity cluster involves scaling detector availability and industrializing supply for high-volume programs (including drones, counter-drone, and security), alongside deeper edge-AI functionality. Capacity expansion signals are visible in Europe, with LYNRED completing a CAMPUS cleanroom expansion in June 2026 (from 4,000 to 8,000 square meters) and associated scale targets for bolometers, while Exosens has communicated plans to double cooled infrared camera production capacity in 2026 for surveillance and counter-drone demand. At the platform layer, the June 2026 launch of Overview AI's OVX Thermal smart camera family supports an edge capture and interpretation path for real-time decisions on production lines. Standards activity also supports addressable use cases, including ISO/FDIS 7240-33 reaching the final approval phase in 2026 and updates such as ASTM E3216-26 for building-system thermography, which can reduce buyer friction and broaden procurement beyond early adopters.
Recent Industry Developments in Thermal Imaging Systems Market
- July 2026: Teledyne FLIR Defense partnered with STORM to integrate the Black Recon capability into STORM's Rapid Adapt and Deploy System (RADS), broadening how thermal-enabled reconnaissance can be deployed across vehicle platforms. The integration focus supports faster fielding and interoperability for customers that prioritize modular payloads and rapid configuration changes.
- March 2025: Teledyne FLIR Defense secured a contract with Middle East Task Company to supply a Lightweight Vehicle Surveillance System integrating the TacFLIR 380HD to the Saudi military, with deliveries planned by end-2025. The award reinforces demand for vehicle-mounted EO/IR and thermal payload integration in perimeter security and mobile surveillance roles.
- July 2024: The US Army placed a USD 117.5 million low-rate production order with Raytheon for third-generation FLIR sensors featuring dual-band arrays. The program highlights continued investment in higher-performance thermal sensing for defense modernization and supports multi-year pull-through for detectors, optics, and ruggedized system integration.


Thermal Imaging Systems Market Report Scope and Research Methodology
Market Definition and Coverage
This market captures revenue generated from thermal imaging systems that detect infrared radiation and convert it into usable images for viewing, measurement, and decision-making across commercial and defense-related uses. It includes handheld and fixed-mounted systems sold into different applications and geographies.
Scope exclusions: We exclude standard visible-light cameras, simple temperature sensors that do not create thermal images, and purely aftermarket repair labor that is not part of a product or system sale.
Segments Covered in This Report
-
By Application
- Security and Surveillance
- Military and Defense
- Thermography / Inspection
- Firefighting
- Personal Vision Systems
- Smartphones and Tablets
- Automotive ADAS
- Maritime and Aerospace
-
By Form Factor
- Hand-held Imaging Devices
- Fixed-mount (Rotary / Non-rotary)
- Integrated OEM Modules
-
By Technology
- Uncooled LWIR
- Cooled MWIR
- SWIR and Multispectral
-
By Component
- Detectors / Cores
- Complete Cameras
- Optics and Lens Sets
- Software and Analytics
-
By End-user Industry
- Defense and Homeland Security
- Industrial
- Commercial
- Medical
- Public Safety
-
By Geography
-
North America
- United States
- Canada
- Mexico
-
South America
- Brazil
- Argentina
- Rest of South America
-
Europe
- Germany
- United Kingdom
- France
- Italy
- Spain
- Russia
- Rest of Europe
-
Asia Pacific
- China
- Japan
- South Korea
- India
- Australia and NZ
- ASEAN (Break-up)
- Rest of Asia Pacific
-
Middle East and Africa
-
Middle East
- Saudi Arabia
- UAE
- Turkey
- Rest of Middle East
-
Africa
- South Africa
- Nigeria
- Rest of Africa
-
Middle East
-
North America
Data Sources, Market Sizing, and Validation
Desk Research
Desk research starts with public, checkable signals that show where demand is coming from and how supply is evolving. We lean on sources such as US export and import statistics, procurement and tender portals, defense budget documents, and standards and safety guidance published by agencies that touch inspection and surveillance.
To keep assumptions grounded, we also use company annual reports, investor presentations, product catalogs, and reputable press coverage to understand shipments, pricing bands, and typical use cases. In some cases, paid subscriptions for company financials and news, patent databases, and shipment-level trade databases are used to speed up cross-checks for product mix changes and regional flows. These examples are not exhaustive, and many other public and supporting sources were also referred to for data collection, validation, and research clarification.
Primary Interviews and Surveys
Primary work is used to test what we built from desk research and to close gaps that public data does not explain well, such as practical ASP movement, adoption timing, and channel margins. We speak with a mix of manufacturers, distributors, integrators, and large buyers across major regions so assumptions can be challenged and then corrected before finalizing the model.
Distribution of primary research fieldwork respondents
| Company type | Respondent position | Region |
|---|---|---|
| Top tier: 29% | CXOs: 15% | APAC: 44% |
| Mid tier: 50% | Functional/Unit leaders: 32% | EMEA: 34% |
| Smaller Players: 21% | Managers: 53% | Americas: 22% |
Market-Sizing & Forecasting
Market sizing is constructed using top-down and bottom-up logic, with the top-down path built from demand pools that can be tracked year to year. For thermal imaging, this means reconciling adoption in key end uses like surveillance and security, industrial thermography, and defense vision systems, and then translating those demand signals into annual revenue.
In the model, inputs include unit demand direction by use case, typical device replacement cycles, the split between handheld and fixed systems, cooled versus uncooled mix shifts, and average selling price bands by performance tier. When the market shows step changes, such as new procurement waves or broader industrial inspection adoption, those shifts are reflected through scenario analysis that is reviewed with experts for plausibility. Results are then corroborated using selective bottom-up approximations like sampled price x volume checks and supplier and channel feedback, and any coverage gaps are filled using conservative assumptions that are later pressure-tested in interviews.
Data Validation & Update Cycle
Outputs are validated through triangulation across independent signals, including trade flows, budget or tender activity, and company-reported business performance cues. If a regional total or ASP trend looks unusual, the drivers are rechecked, outliers are investigated, and follow-up calls are triggered to confirm whether it is a real market movement or a modeling artifact.
Before sign-off, the work is reviewed in multiple steps so calculation logic, units, and conversions are consistent across years. Reports are refreshed annually, and interim updates are made when material events change demand or supply assumptions. Right before delivery, a final analyst pass is completed so clients receive the latest updated view.
Mordor Intelligence's Thermal Imaging Systems Market Size Measured Against Other Published Estimates
Published market sizes for thermal imaging often do not match because the counted scope is not the same, and the pricing and mix assumptions move totals quickly. Differences also come from the year used as the starting point and whether values are reported as factory-gate revenues or later in the channel.
Some estimates bundle broader thermal sensing and related optics, and they also apply aggressive price progression as volumes scale. In Mordor Intelligence, the count is limited to thermal imaging systems revenues that produce infrared images, and we keep ASP movement tied to observed product mix and replacement behavior rather than a single blanket decline rate.
Benchmark comparison
| Source | Market Size | Gaps in Research Methodology |
|---|---|---|
| Mordor Intelligence | USD 5.78 B (2025) | |
| Industry Publisher A | USD 5.10 B (2025) | Uses a narrower captured revenue pool that can undercount higher-value defense and fixed-mounted deployments, and the channel pricing basis is not clearly stated. |
| Market Publisher B | USD 6.88 B (2025) | Covers a broader thermal imaging scope that can pull in adjacent technologies and software value, and it may assume faster ASP expansion that lifts the headline total. |
The spread mainly comes from what is treated as in-scope hardware and how ASP and mix are carried forward into the base year. By tying the sizing steps to trackable demand indicators and then validating the totals with practical channel checks, we keep the estimate repeatable and easier to audit across regions and use cases.


Key Questions Answered in the Report
What is the current value of the thermal imaging systems market?
The market is valued at USD 6.19 billion in 2026 and is projected to reach USD 8.71 billion by 2031, growing at a 7.06% CAGR.
Which application segment is expanding fastest?
Automotive ADAS is forecast to post the highest 7.66% CAGR through 2031 as vehicle makers add night-vision capabilities.
Why is NFPA-70B significant for thermal imaging adoption?
The 2024 revision makes thermography mandatory for electrical preventive maintenance, triggering recurring demand for calibrated cameras and analytics software.
Which technology holds the largest share?
Uncooled LWIR accounts for 71.92% of 2025 revenue due to cost advantages and broad suitability across applications.
What regions are growing quickest?
Asia-Pacific is projected for an 8.08% CAGR through 2031, driven by defense modernization and expanding automotive production.
How are vendors addressing supply-chain risk in germanium optics?
Suppliers are investing in chalcogenide glass and wafer-level packaging to reduce reliance on germanium and stabilize lead times.
Page last updated on:


 Your data is secure and never sold or shared.


