Distributed Temperature Sensing Market Size and Share
Market Overview
| Study Period | 2019 - 2030 |
|---|---|
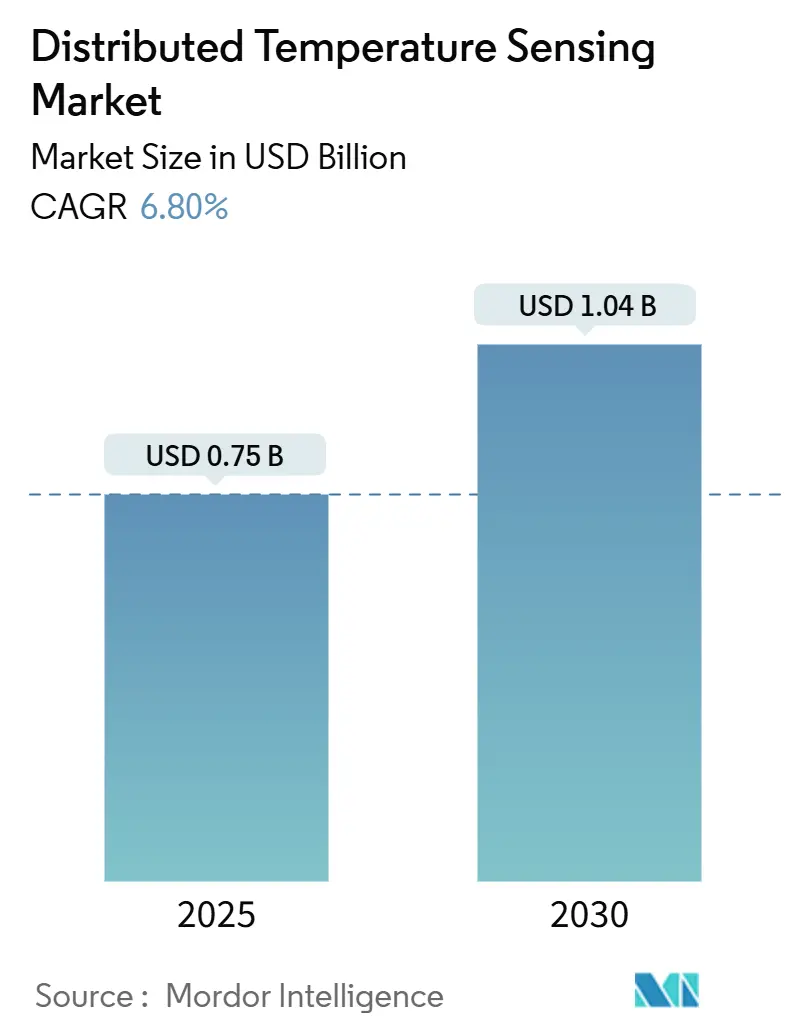
| Market Size (2025) | USD 0.75 Billion |
| Market Size (2030) | USD 1.04 Billion |
| Growth Rate (2025 - 2030) | 6.80% CAGR |
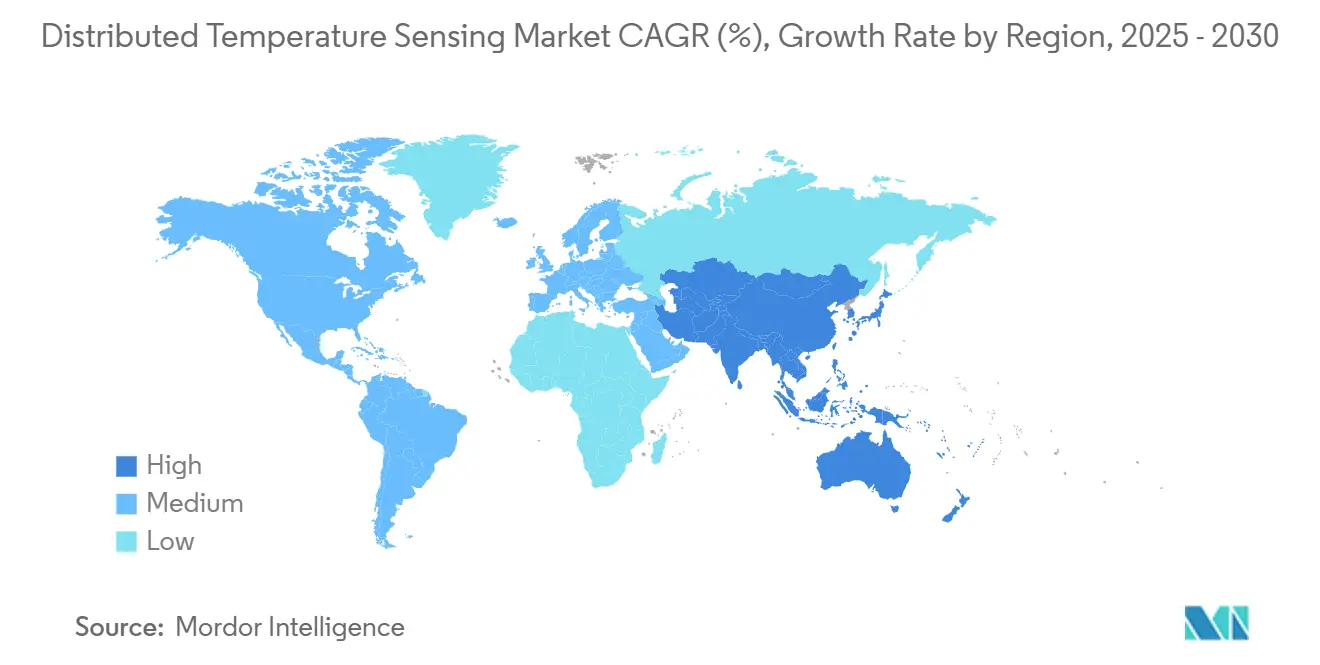
| Fastest Growing Market | Asia Pacific |
| Largest Market | North America |
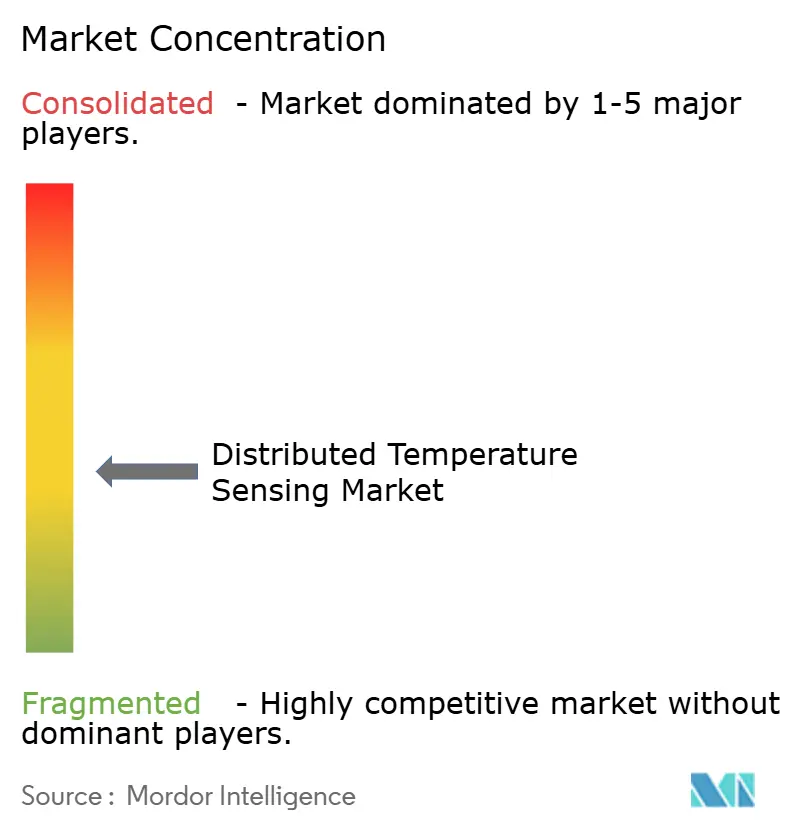
| Market Concentration | Medium |
Major Players *Disclaimer: Major Players sorted in no particular order Image © Mordor Intelligence. Reuse requires attribution under CC BY 4.0. | |
Distributed Temperature Sensing Market Analysis by Mordor Intelligence
The Distributed Temperature Sensing Market size is estimated at USD 0.75 billion in 2025, and is expected to reach USD 1.04 billion by 2030, at a CAGR of 6.80% during the forecast period (2025-2030). The expansion reflects the widening use of fiber-optic temperature profiles to protect critical infrastructure, avert unplanned shutdowns, and improve energy efficiency, especially in oil and gas wells, power grids, and long-distance pipelines. Digital-first operating models, tougher safety regulations, and the shift toward predictive maintenance have reinforced the value proposition of distributed temperature sensing systems that cover tens to hundreds of kilometers in a single pass. [1]U.S. Environmental Protection Agency, “Fiber Optic Distributed Temperature Sensing,” epa.gov North America leads adoption due to its mature hydrocarbon assets and grid-modernization budgets, while Asia-Pacific shows the fastest uptake as industrialization and infrastructure spending accelerate. Single-mode fiber remains the default choice for most projects because of its low attenuation and 100 km+ reach, whereas multi-mode fiber gains ground in short-haul industrial automation. On the hardware front, OTDR instruments retain the largest installed base, yet coherent OTDR variants are growing rapidly as users seek finer resolution and self-calibration. Oil and gas production continues to be the largest revenue contributor, but environmental and geotechnical monitoring is expanding quickly on the back of climate-compliance mandates.
Key Report Takeaways
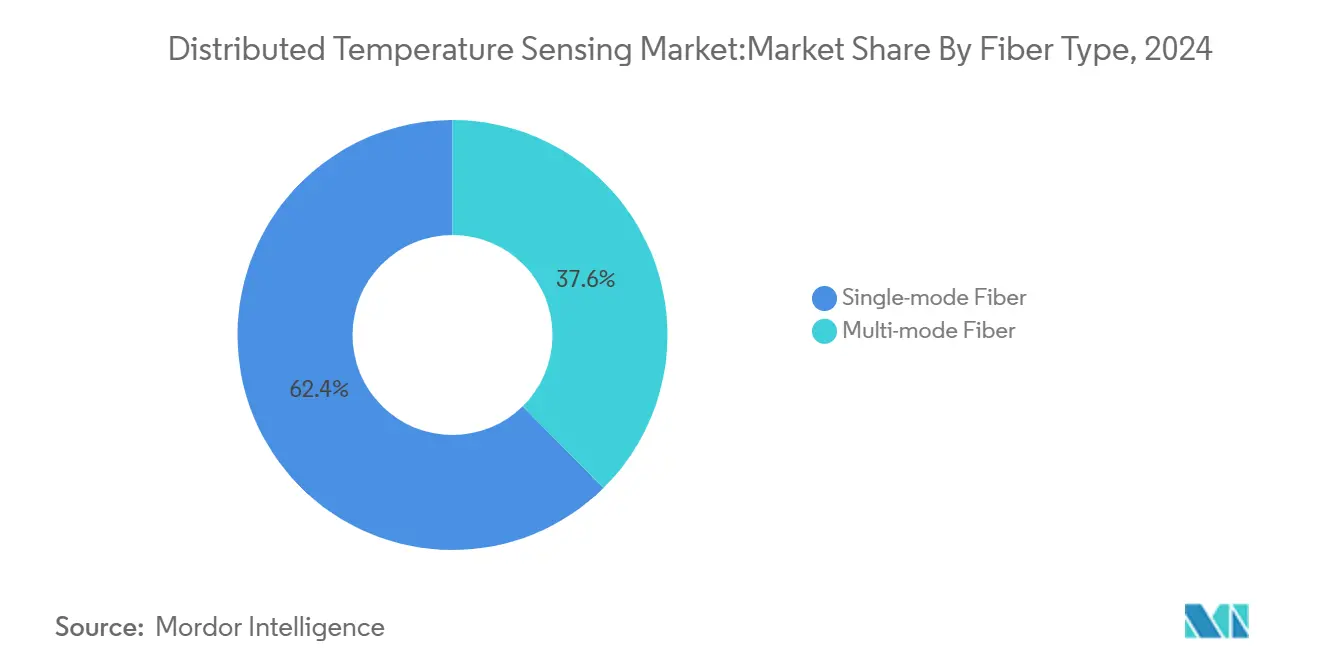
- By fiber type, single-mode fiber held 62.4% of the distributed temperature sensing market share in 2024, while multi-mode fiber is projected to deliver an 8.4% CAGR through 2030.
- By operating principle, OTDR-based DTS commanded 47.3% revenue share of the distributed temperature sensing market size in 2024; coherent OTDR is forecast to expand at an 8.0% CAGR to 2030.
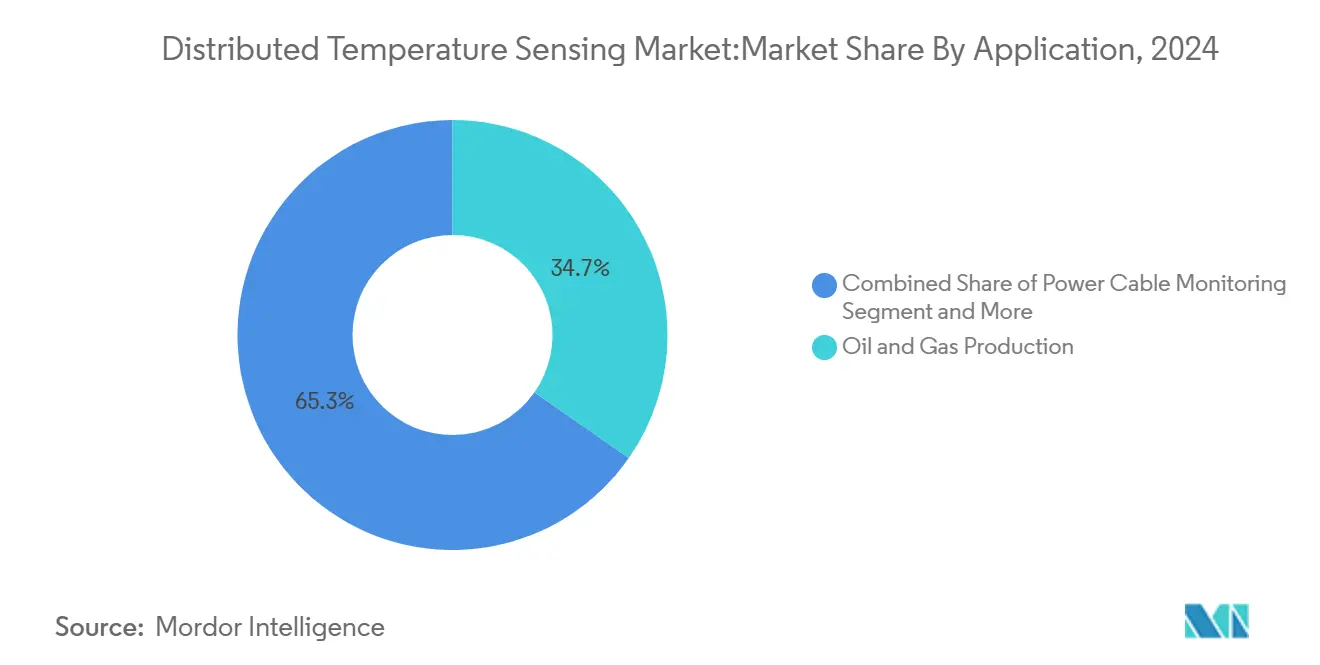
- By application, oil and gas production captured 34.7% of the distributed temperature sensing market share in 2024; environmental and geotechnical monitoring is the fastest-growing segment at 7.5% CAGR.
- By end-user industry, oil and gas accounted for 39.3% of the distributed temperature sensing market size in 2024; environmental and geoscience activities are poised to grow at a 7.6% CAGR.
- By installation environment, downhole deployments represented 66.3% revenue share of the distributed temperature sensing market in 2024, while subsea/offshore installs are set for a 7.9% CAGR to 2030.
- By geography, North America led with 35.26% of dthe istributed temperature sensing market share in 2024; Asia-Pacific is expected to post an 8.2% CAGR between 2025-2030.
Global Distributed Temperature Sensing Market Trends and Insights
Drivers Impact Analysis*
| Driver | (~) % Impact on CAGR Forecast | Geographic Relevance | Impact Timeline |
|---|---|---|---|
| Trustworthiness of DTS in severe environments | +1.2% | Global, North America, Middle East | Medium term (2-4 years) |
| Growing need for labor safety at hazardous sites | +0.9% | Global, APAC, North America | Short term (≤ 2 years) |
| Rising applications in the oil and gas industry | +1.5% | North America, Middle East, South America | Medium term (2-4 years) |
| AI-driven predictive maintenance integration | +0.8% | North America, EU, APAC | Long term (≥ 4 years) |
| Urban underground power-grid modernization | +0.7% | APAC, North America, EU | Long term (≥ 4 years) |
| Geothermal well monitoring requirements | +0.4% | North America, EU, with emerging opportunities in APAC | Long term (≥ 4 years) |
| Source: Mordor Intelligence | |||
Trustworthiness of DTS in severe environments
DTS strings withstand temperatures above 300 °C and pressures up to 15,000 psi, enabling continuous monitoring in steam-assisted gravity drainage wells and geothermal projects. Petrobras demonstrated steam-front mapping at 300 °C that improved injection efficiency and prevented steam breakthrough, validating reliability under extreme conditions. Intrinsic safety stems from the absence of electrical power at measurement points, eliminating ignition risks in volatile zones such as underground coal mines where spontaneous combustion is a threat. Fiber runs exceeding 60 km achieve ±1 °C accuracy and 1 m spatial resolution, giving operators confidence to shift from point sensors to continuous profiles. Such field evidence strengthens the distributed temperature sensing market outlook for harsh-environment deployments.
Growing need for labor safety at hazardous sites
Mining, petrochemicals, and ammonia production increasingly mandate real-time fiber-optic temperature surveillance to protect workers from explosions and toxic leaks. DTS detects 1 °C changes within seconds, flagging corrosion-induced leaks before escalation. The technology also reveals roof instability and methane build-up, allowing early evacuation. Regulatory agencies cite continuous monitoring to reduce man-hours spent in dangerous zones, a policy push that widens the distributed temperature sensing market footprint. Integration with strobe alarms and automated ventilation further underlines the role of fiber-optic data in modern safety protocols.
Rising applications in oil and gas industry
Steam-flood operators leverage downhole DTS traces to refine injection rates and highlight bypassed oil, boosting thermal recovery economics. DTS-based wax detection flags temperature signatures that correlate with deposition, enabling solvent schedules that cut remediation costs. Ultra-long-range systems exceeding 300 km support deep-water tiebacks and remote subsea manifolds. Coupled with intelligent completions and reservoir simulators, the technology helps increase ultimate recovery, a prime driver of the distributed temperature sensing market through 2030.
AI-driven predictive maintenance integration
Edge processors now filter billions of trace sets, lowering backhaul bandwidth and delivering near-instant anomaly alerts. Machine-learning models blending distributed acoustic and temperature data achieved R² 0.96 in pressure estimation, illustrating cross-domain analytics potential. AI-enabled drilling tools lifted digital revenue at SLB by 17%, underscoring commercial appetite for predictive workflows. [2]SLB, “First-Quarter 2025 Results,” slb.com These developments position the distributed temperature sensing market to capitalize on cloud-native maintenance platforms.
Restraints Impact Analysis*
| Restraint | (~) % Impact on CAGR Forecast | Geographic Relevance | Impact Timeline |
|---|---|---|---|
| Optical cable susceptibility to physical damage | -0.8% | Global harsh environments | Short term (≤ 2 years) |
| High capital and operational costs of DTS systems | -1.1% | Global, emerging markets | Medium term (2-4 years) |
| Data-management complexity and skills gap | -0.6% | Global, concentrated in regions with limited technical expertise | Medium term (2-4 years) |
| Hydrogen-induced fiber degradation risk | -0.4% | Oil and Gas regions, particularly high-temperature applications | Long term (≥ 4 years) |
| Source: Mordor Intelligence | |||
Optical cable susceptibility to physical damage
Fiber strands risk crushing, abrasion, and chemical attack during installation in mines, subsea umbilicals, and dynamic conveyor belts. Exposure may attenuate backscatter signals, degrading accuracy and causing costly downtime. Protective armoring, tighter bend radii, and specialized jacketing mitigate but do not remove the vulnerability. Replacement in remote wells or offshore fields is expensive and logistically complex, limiting rapid rollout across marginal assets and tempering distributed temperature sensing market expansion in the short term.
High capital and operational costs of DTS systems
Turnkey deployments cost USD 100,000–500,000, depending on well depth or pipeline length. Offshore variants need optical repeaters and pressure housings, further raising outlays. Skilled engineers must calibrate, process, and interpret high-frequency datasets, creating fixed staffing costs. Although manufacturers have begun standardizing modules and cloud dashboards, cost remains a deterrent for small operators and emerging-market users, capping the distributed temperature sensing market’s near-term addressable base.
*Our forecasts treat driver/restraint impacts as directional, not additive. The impact forecasts reflect baseline growth, mix effects, and variable interactions.
Segment Analysis
By Fiber Type: Long-distance demands sustain single-mode leadership
Single-mode fiber secured 62.4% distributed temperature sensing market share in 2024 due to attenuation below 0.2 dB/km and effective monitoring ranges above 100 km. The segment’s dominance is anchored in offshore pipelines, interstate power cables, and steam-assisted gravity drainage wells, where extended reach outweighs incremental cost. Multi-mode designs grow at 8.4% CAGR as industrial users favor lower-cost 2–5 km loops for furnace profiling and building automation. New hydrogen-resistant coatings shield silica cores from embrittlement, broadening single-mode deployment inside 300 °C wells and sour-gas fields.
Demand for multi-mode assemblies rises in refineries and chemical parks that need dense sensor spacing without long hauls. Recent factory improvements in graded-index preforms narrowed signal dispersion, closing the performance gap. Vendors bundle interchangeable connector kits so technicians can swap between fiber types on the same interrogator, easing cross-plant standardization. These trends underpin resilient growth across both variants and help the distributed temperature sensing market meet divergent distance and budget criteria.


By Operating Principle: OTDR retains scale while coherent OTDR accelerates
OTDR units supplied 47.3% of the distributed temperature sensing market size in 2024, reflecting decades of field experience, kilometer-scale coverage, and meter-class spatial resolution. Coherent OTDR platforms post an 8.0% CAGR owing to dual-laser schemes that self-correct for polarization and ambient drift, reducing manual recalibration cycles. OFDR devices serve niche roles—such as laboratory reactors—where sub-centimeter mapping is mandatory but the range is modest.
OTDR continues to command bulk orders for downhole completions because interrogators survive high vibration and elevated temperature. Coherent OTDR’s tighter signal-to-noise ratio excels in geothermal wells and power-cable joints where subtle anomalies precede faults. Native machine-learning libraries inside modern interrogators automatically grade trace anomalies, shrinking interpretation time and bolstering the distributed temperature sensing market’s attractiveness to operators with limited in-house data teams.
By Application: Oil and gas uses remain principal revenue engine
Oil and gas production comprised 34.7% of the distributed temperature sensing market share in 2024—a legacy of early adoption for reservoir monitoring, thermal flood control, and leak detection. Steam-quality mapping, wax build-up alerts, and hydrate watchlists deliver clear dollar savings, sustaining capital budgets for new wells. Environmental and geotechnical monitoring enjoys a 7.5% CAGR, buoyed by climate regulation that requires 24/7 data on groundwater interfaces, embankment stability, and glacier melt.
Power-cable operators deploy DTS to pre-empt hotspots and schedule dynamic line ratings, thus lifting transmission capacity without costly conductor upgrades. Pipeline owners use fiber heat signatures to localize leaks within 1 m and verify flow assurance additives. Tunnel managers integrate DTS strands into ceiling liners for early fire recognition. This broadening field of use cases diversifies revenue streams and increases the resilience of the distributed temperature sensing market against single-sector cyclicality.

By End-user Industry: Hydrocarbon majors lead, environmental agencies ramp up
Oil and gas enterprises accounted for 39.3% of the distributed temperature sensing market size in 2024, following multi-year programs to fiber-optically instrument wells, flowlines, and FPSOs. [3]SLB, “First-Quarter 2025 Results,” slb.com Geological survey bodies and water authorities represent the fastest vector at 7.6% CAGR as they roll out basin-scale heat-flux networks to gauge aquifer sustainability. Utilities add DTS in transformers, underground vaults, and submarine interconnectors to meet reliability standards and manage renewable intermittency.
Manufacturing plants retrofit fibers along kiln walls to even out temperature profiles and cut fuel consumption. Mining groups thread cables along conveyor paths, stopes, and tailings dams to detect fire, belt slippage, or dam seepage before incidents escalate. The diversity of verticals reduces revenue volatility and underpins steady distributed temperature sensing industry maturity.
By Installation Environment: Downhole remains core, subsea surges
Downhole strings delivered 66.3% revenue share of the distributed temperature sensing market in 2024 because operators rely on fiber data to balance injection, choke flow, and artificial-lift settings. High-strength encapsulation and elevated hydrogen resistance unlock lifetimes exceeding 5 years even in 250 °C wells. Subsea and offshore projects rise at 7.9% CAGR; 300 km-range interrogators reduce the need for subsea electrical feedthroughs and support long tiebacks where workovers are uneconomical. [4]Gyger Flavien et al., “Ultra Long Range DTS for Deep Offshore,” asme.org
Pipeline corridors—both terrestrial and submarine—adopt bury-along fibers to pinpoint leaks, prevent third-party interference, and monitor hydrate inhibitors. Surface installations inside data centers, stadiums, and heritage tunnels use short fiber loops for micro-zone fire detection without active electronics, aligning with new building codes. Together, these environments provide a balanced growth portfolio for the distributed temperature sensing market through 2030.
Geography Analysis
North America held 35.26 of % distributed temperature sensing market share in 2024 on the strength of Canadian oil sands, U.S. shale basins, and an aging electric grid that demands continuous thermal diagnostics. More than 17 million ft of fiber have been installed in over 1,500 wells, giving operators rich precedent for additional rollouts. Federal methane rules and wildfire-prevention efforts further elevate adoption in pipelines and transmission corridors. Venture funding for edge analytics firms gains momentum, integrating localized computing with field interrogators.
Asia-Pacific is projected to grow at 8.2% CAGR until 2030 as China, India, and Southeast Asian nations accelerate industrial expansion and safety compliance. Beijing’s AI infrastructure push encourages smart-city fiber grids that share conduits with DTS strings, enabling heat-map services for water, power, and transit assets. Japan’s repurposing of the 120 km Muroto submarine cable into a DAS/DTS array exemplifies regional ingenuity in leveraging legacy infrastructure. India’s manufacturing corridor modernizes chemical plants with fiber leak-detection networks backed by cloud analytics.
Europe exhibits steady mid-single-digit growth tied to renewable-integration projects, district heating loops, and stricter environmental audits. Shallow geothermal schemes in southern China, documented with whole-lifecycle cost models, provide a transferable blueprint for EU heat-pump markets. Germany’s GAIA-X framework and the UK’s AI Opportunities Action Plan promote secure, federated data spaces that favor fiber-optic monitoring. The Middle East focuses on hydrogen-ready pipeline builds and carbon-capture clusters, both fertile ground for long-range DTS feeds that handle elevated temperatures and corrosive gases.

Competitive Landscape
The distributed temperature sensing market remains moderately fragmented with a mix of oilfield service majors and fiber specialists. Schlumberger, Halliburton, and Yokogawa harness global service infrastructures to bundle DTS with production chemistry, logging, and control systems. AP Sensing, Silixa, Omnisens, and Luna Innovations concentrate on high-specification interrogators and analytics that address niche gaps such as ultra-long reach or centimeter-scale resolution. SLB’s 17% digital-revenue jump illustrates how platform-driven service models amplify hardware sales.
Strategic collaborations increase: SLB joined with Shell to unify Petrel subsurface models, while NKT upgraded in-house cable sensing to deliver real-time ampacity data. AI partnerships reshape differentiation; coherent OTDR vendors integrate anomaly-classification engines that cut manual trace review time by 70%. Consolidation is evident: Luna Innovations explored mergers or asset sales amid adviser guidance from Evercore, signaling appetite for scale or complementary IP. White-space potential lies in smart infrastructure, where fiber sensing merges with city-wide telemetry and low-carbon district energy networks. Vendors that harmonize edge analytics, cyber-secure cloud links, and open APIs are poised to widen their share in the distributed temperature sensing market by 2030.
Distributed Temperature Sensing Industry Leaders
Schlumberger Limited
Halliburton Company
Yokogawa Electric Corporation
Weatherford International PLC
Sumitomo Electric Industries Ltd.
- *Disclaimer: Major Players sorted in no particular order

Recent Industry Developments
- April 2025: SLB partnered with Shell to globalize Petrel subsurface software and co-develop AI seismic interpretation modules.
- March 2025: SLB won a multi-well ultra-deepwater drilling contract from Woodside Energy for the Trion project offshore Mexico, deploying AI-enabled drilling and fiber monitoring.
- January 2025: Luna Innovations reported strong bookings and engaged advisors to evaluate strategic options, including potential M&A.
- August 2024: Luna Innovations named Kevin Ilcisin as CEO and secured a USD 15 million term loan, supplementing a USD 50 million investment.
- August 2024: NKT upgraded DTS functions for early hotspot detection and dynamic cable overload management.


Research Methodology Framework and Report Scope
Market Definitions and Key Coverage
Our study treats the distributed temperature sensing (DTS) market as all hardware systems that use continuous fiber-optic cables coupled with interrogator units to deliver real-time temperature profiles over distances typically ranging from a few meters to more than fifty kilometers. The counted revenues cover complete, factory-integrated DTS units shipped for use in oil and gas wells, pipelines, high-voltage power cables, data-center aisles, mines, tunnels, and similar infrastructure.
Scope exclusion: stand-alone spot temperature probes, handheld infrared cameras, and aftermarket optical interrogators sold without sensing fiber remain outside the modeled market.
Segmentation Overview
- By Fiber Type
- Single-mode Fiber
- Multi-mode Fiber
- By Operating Principle
- OTDR-based DTS
- OFDR-based DTS
- C-OTDR
- By Application
- Oil and Gas Production
- Power Cable Monitoring
- Process and Pipeline Monitoring
- Fire Detection and Security
- Environmental and Geotechnical Monitoring
- Structural Health Monitoring
- By End-user Industry
- Oil and Gas
- Power and Utilities
- Manufacturing and Process Industries
- Mining and Metals
- Environmental and Geoscience
- Infrastructure and Construction
- Other End-user Industries
- By Installation Environment
- Downhole
- Pipeline
- Subsea/Offshore
- Surface/Infrastructure
- By Geography
- North America
- United States
- Canada
- Mexico
- South America
- Brazil
- Argentina
- Chile
- Rest of South America
- Europe
- United Kingdom
- Germany
- France
- Italy
- Spain
- Russia
- Rest of Europe
- Asia-Pacific
- China
- India
- Japan
- South Korea
- Singapore
- Malaysia
- Australia
- Rest of Asia-Pacific
- Middle East and Africa
- Middle East
- Saudi Arabia
- United Arab Emirates
- Turkey
- Rest of Middle East
- Africa
- South Africa
- Nigeria
- Rest of Africa
- Middle East
- North America
Detailed Research Methodology and Data Validation
Primary Research
Analysts held structured discussions with well-completion engineers, transmission-grid asset managers, fiber-optic component suppliers, and tunnel-safety inspectors across North America, Europe, the Gulf, and East Asia. Interviews clarified typical system prices, channel counts, and replacement cycles, and they challenged early desk estimates before we locked the baseline.
Desk Research
We first gathered publicly available benchmarks from authorities such as the US Energy Information Administration, International Association of Oil & Gas Producers, IEEE Power Cable Committee, International Telecommunication Union fiber deployment statistics, and patents indexed on Questel. Company 10-Ks, safety case filings, and engineering papers in journals like Sensors added life-cycle cost and accuracy data. Subscription platforms our team accesses, including D&B Hoovers and Dow Jones Factiva, supplied financial splits, product launches, and contract awards. These references illustrate rather than exhaust the universe of secondary inputs consulted.
Market-Sizing & Forecasting
We applied a top-down build that converts kilometers of active oil and gas wells, high-voltage cable route length, pipeline mileage, and hyperscale data-center white space into addressable sensing demand, which is then reconciled with selective bottom-up checks such as sampled average selling price multiplied by supplier shipment volumes. Key variables in the model include new well completions, power-grid capex, kilometers of newly buried fiber, average DTS channel price, and data-center floor growth. Forecasts employ multivariate regression blended with scenario analysis to capture oil-price swings and grid spending cycles. Where bottom-up samples are sparse, we gap fill using regional penetration ratios vetted through expert calls.
Data Validation & Update Cycle
Outputs pass variance scans against import data, accident records, and vendor earnings. A senior analyst reviews anomalies, and models refresh each year, with interim updates triggered by disruptive events such as major pipeline regulations or optical-fiber price shocks.
Why Mordor's Distributed Temperature Sensing Baseline Merits Trust
Published figures often diverge because firms vary scope, currency treatment, and refresh rhythm. By aligning definitions to shipped, fully integrated DTS systems and by revisiting our model every twelve months, Mordor Intelligence minimizes those gaps.
Key divergence drivers include whether pipeline-leak detection retrofits are counted, the assumed 2025 average system price, and if multipoint fiber Bragg grating arrays are mixed with true DTS. Our approach keeps those elements explicit, while others sometimes blend them or use outdated capex proxies.
Benchmark comparison
| Market Size | Anonymized source | Primary gap driver |
|---|---|---|
| USD 750 million | Mordor Intelligence | - |
| USD 774.5 million | Global Consultancy A | Treats retrofit interrogators as new systems; limited primary validation |
| USD 958 million | Industry Association B | Applies single global ASP, ignores regional price dispersion |
| USD 1,129.8 million | Trade Journal C | Bundles point sensors and DTS, inflating totals |
In sum, the disciplined scoping, multi-layer validation, and timely refresh cycle practiced by Mordor Intelligence give decision-makers a balanced baseline they can trace to clear variables and replicate with confidence.


Key Questions Answered in the Report
What is driving demand in the distributed temperature sensing market after 2025?
Stronger safety regulations, digital maintenance strategies, and the extension of fiber monitoring to geothermal, power-grid, and smart-city assets underpin the 6.8% CAGR expected through 2030.
Which application contributes the largest revenue?
Oil and gas production remains dominant, accounting for 34.7% distributed temperature sensing market share in 2024, due to its reliance on downhole thermal profiling.
Why is single-mode fiber preferred in long-distance projects?
Single-mode lines exhibit low attenuation, enabling accurate readings over 100 km and securing 62.4% distributed temperature sensing market share within the fiber-type segment.
How are AI tools influencing the distributed temperature sensing industry?
Edge analytics and machine-learning models detect anomalies faster, cut bandwidth needs, and helped SLB raise digital revenue by 17%, accelerating predictive-maintenance adoption.
Which region is poised for the fastest growth?
Asia-Pacific is forecast to post an 8.2% CAGR from 2025-2030 as industrialization, smart-city programs, and safety mandates push fiber-optic monitoring across diverse infrastructure.
What remains the biggest hurdle to broader deployment?
High upfront and operational costs—often USD 100,000–500,000 per system—limit uptake among smaller operators despite ongoing efforts to standardize and automate data processing.
Page last updated on:


