Power System Analysis Software Market Size and Share
Market Overview
| Study Period | 2019 - 2030 |
|---|---|
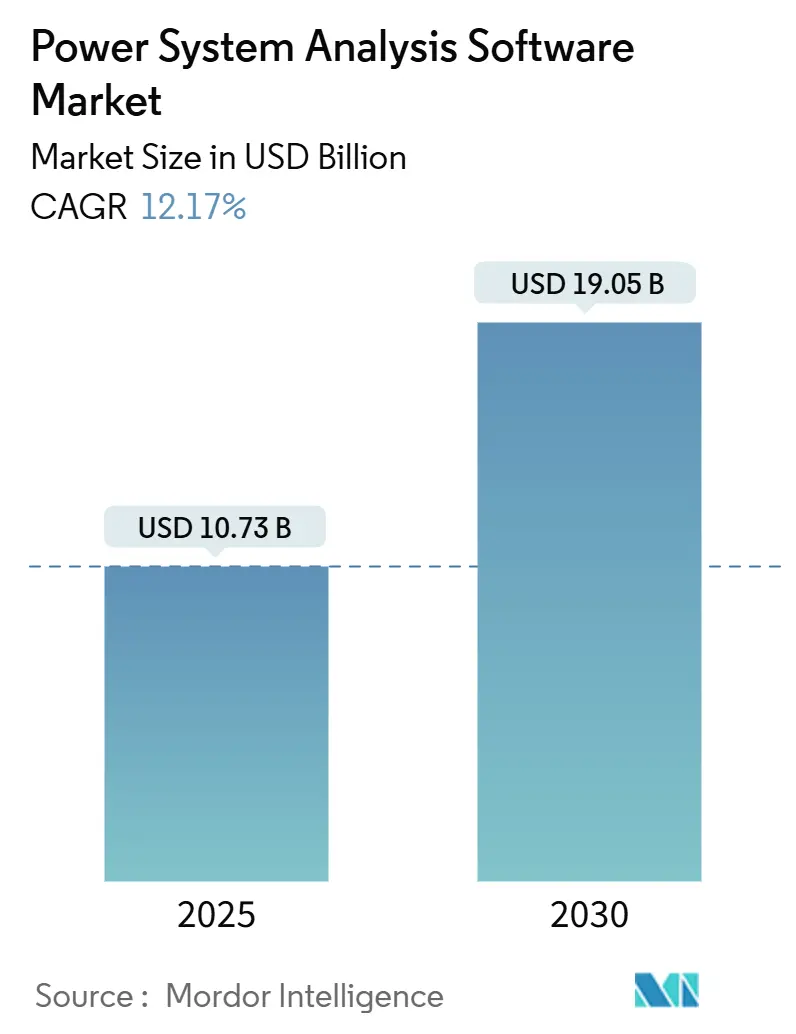
| Market Size (2025) | USD 10.73 Billion |
| Market Size (2030) | USD 19.05 Billion |
| Growth Rate (2025 - 2030) | 12.17% CAGR |
| Fastest Growing Market | Asia Pacific |
| Largest Market | Europe |
| Market Concentration | Medium |
Major Players *Disclaimer: Major Players sorted in no particular order Image © Mordor Intelligence. Reuse requires attribution under CC BY 4.0. | |
Power System Analysis Software Market Analysis by Mordor Intelligence
The power system analysis software market size reaches USD 10.73 billion in 2025 and is forecast to expand to USD 19.05 billion by 2030, translating to a solid 12.17% CAGR for the period. This trajectory is propelled by grid-modernization mandates, AI-driven digital-twin integrations, and rising cybersecurity requirements that demand unified engineering and cyber-physical modeling solutions. Utilities rely on the software to simulate renewable penetrations already topping 50%, manage bidirectional distributions laden with distributed energy resources (DER), and comply with evolving reliability standards. Market leaders differentiate by embedding real-time simulation, cloud scalability, and protection-coordination automation inside a single platform, enabling faster study cycles, lower total cost of ownership, and reduced operational risk. Regulatory catalysts such as FERC Order 881 and NERC CIP guidelines turn compliance deadlines into budget-protected software investments, while export-control rules and data-sovereignty clauses shape procurement preferences across continents.
Key Report Takeaways
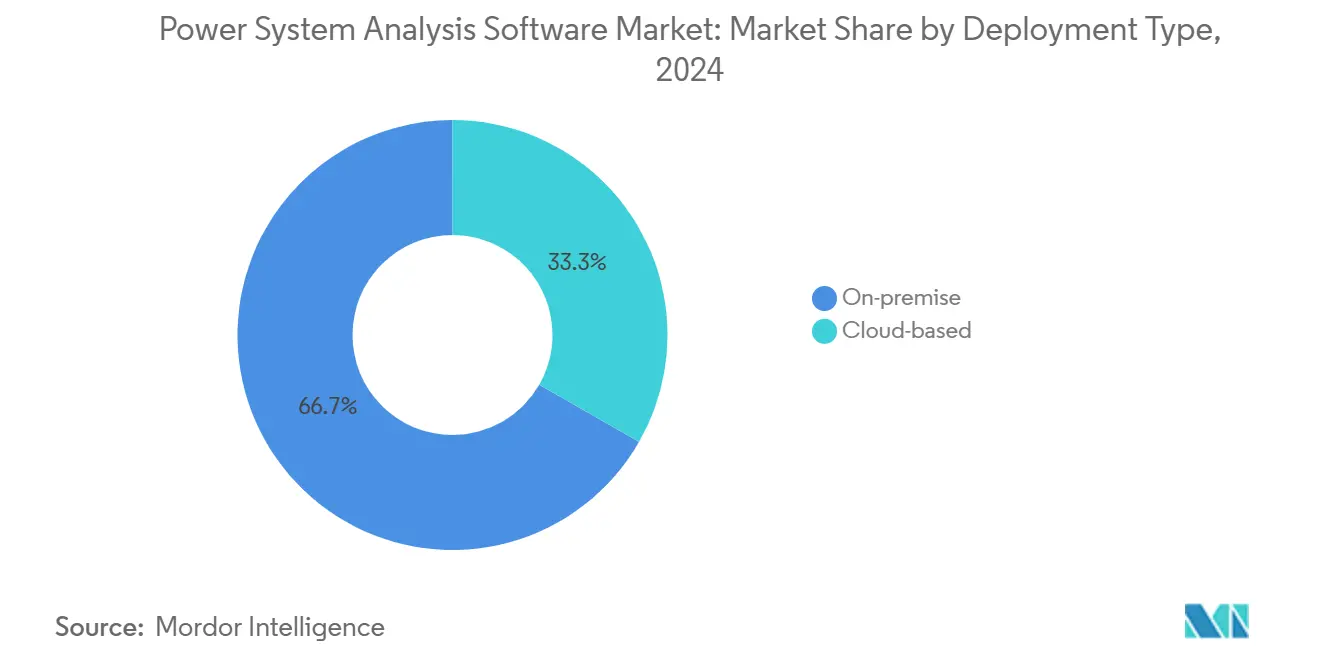
- By deployment type, on-premise solutions held 66.73% of the power system analysis software market size in 2024, whereas cloud platforms are climbing at a 14.36% CAGR to 2030.
- By module type, load-flow and power-flow analysis commanded 27.82% of 2024 revenues; short-circuit analysis posts the fastest growth at a 12.58% CAGR to 2030.
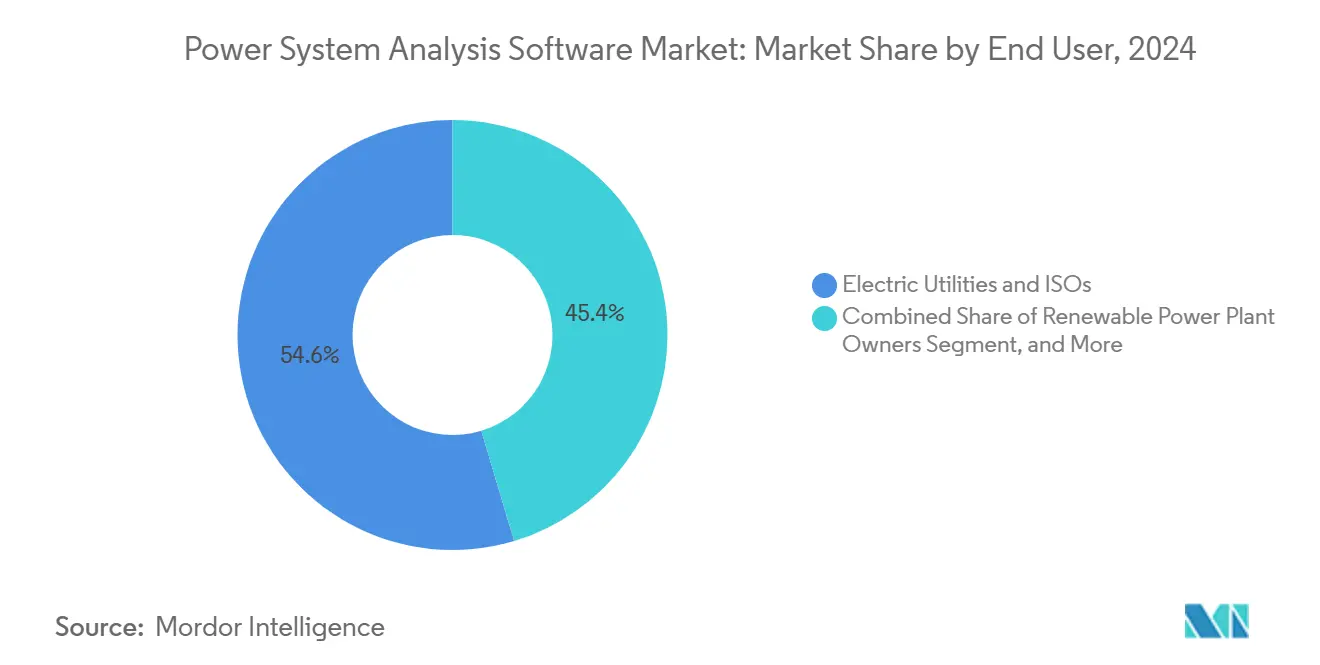
- By end user, electric utilities and ISOs accounted for 54.63% of 2024 revenues; renewable power plant owners expand at a 12.64% CAGR through 2030.
- By application, transmission and distribution planning represented 39.97% of 2024 deployments; renewable integration studies register the highest growth at a 12.94% CAGR to 2030.
- By geography, Europe captured 31.38% of the power system analysis software market share in 2024; Asia-Pacific is advancing at a 13.19% CAGR through 2030.
Global Power System Analysis Software Market Trends and Insights
Drivers Impact Analysis*
| Driver | (~) % Impact on CAGR Forecast | Geographic Relevance | Impact Timeline |
|---|---|---|---|
| Grid-modernization programs | +2.8% | North America and Europe | Medium term (2-4 years) |
| Variable renewables demand advanced stability | +3.1% | Global, concentrated in Asia-Pacific and Europe | Long term (≥ 4 years) |
| Distributed energy resources proliferation | +2.4% | North America and Asia-Pacific core, spill-over to MEA | Medium term (2-4 years) |
| Cybersecurity mandates for critical infrastructure | +1.9% | Global, led by North America | Short term (≤ 2 years) |
| AI-enhanced digital-twin integrations | +1.6% | North America and Europe | Long term (≥ 4 years) |
| Monetizing network models as a service | +0.9% | North America and Europe | Long term (≥ 4 years) |
| Source: Mordor Intelligence | |||
Accelerating Grid-Modernization Programs Drive Software Demand
North American utilities plan USD 96 billion in grid-modernization spending through 2028, directing significant allocations to advanced power-flow, short-circuit, and protection-coordination studies that ensure asset upgrades integrate reliably. National Grid’s USD 1.3 billion Massachusetts program exemplifies investments in real-time distribution management systems reliant on robust load-flow engines for voltage-var optimization and contingency mitigation. FERC Order 881 pushes ambient-adjusted ratings, triggering purchases of dynamic thermal-modeling modules. Similar mandates under the European Clean Energy Package make the trend global and durable.
Variable Renewables Complexity Demands Advanced Stability Studies
Renewables already exceed 40% of annual generation in several markets, introducing inverter-based dynamics that legacy software cannot resolve. [1]National Renewable Energy Laboratory, “Grid-Scale Energy Storage Technologies and Applications,” nrel.gov Offshore wind projects surpassing 1 GW require detailed electromagnetic-transient simulations to validate HVDC links and grid-forming inverter behavior across interconnected zones. Hybrid solar-wind-storage assets add multi-timescale control loops, amplifying the need for integrated harmonic, sub-synchronous resonance, and frequency-response analyses within one user environment. Vendors embedding these high-fidelity solvers gain a competitive edge as utilities prioritize stability over cost.
Distributed Energy Resources Transform Distribution System Analysis
Global DER capacity reaches 387 GW in 2024, forcing utilities to model bidirectional power flows, voltage excursions, and complex protection schemes in networks designed for one-way delivery. [2]Siemens AG, “PSS SINCAL – Power System Analysis Software,” siemens.com Advanced distribution management now hinges on software that can simulate thousands of rooftop PV inverters, vehicle chargers, and battery systems in sub-second resolution. FERC Order 2222 accelerates virtual power-plant aggregation studies, reinforcing demand for cloud-native platforms with scalable compute partitions capable of hourly dispatch optimization.
Cybersecurity Mandates Reshape Critical-Infrastructure Modeling
NERC CIP-015-1 obligates North American grid operators to evaluate cyber vulnerabilities alongside physical contingencies, blending traditional electrical studies with threat-scenario simulations. [3]North American Electric Reliability Corporation, “CIP-015-1 – Interconnection Security and Monitoring,” nerc.com The White House Energy Modernization plan requires cyber-impact assessments in every federal grid investment, prompting utilities to seek software that can quantify the stability impact of data-integrity attacks and communication delays. Vendors integrating packet-level network models with power-flow solvers meet these evolving compliance checks.
Restraints Impact Analysis*
| Restraint | (~) % Impact on CAGR Forecast | Geographic Relevance | Impact Timeline |
|---|---|---|---|
| High license costs and steep learning curves | -1.8% | Global, especially smaller utilities | Short term (≤ 2 years) |
| Data-quality issues from legacy SCADA/EMS | -1.4% | Global, mature grids with aging assets | Medium term (2-4 years) |
| IT-OT convergence bottlenecks | -1.2% | North America and Europe | Medium term (2-4 years) |
| Export-control rules limiting model exchange | -0.7% | Global, heightened US-China friction | Long term (≥ 4 years) |
| Source: Mordor Intelligence | |||
High License Costs Create Adoption Barriers
Enterprise seats priced between USD 50,000 and USD 500,000 tighten capital budgets for municipal utilities that analyze systems episodically, forcing them to outsource or defer studies. The total cost of ownership climbs further with annual maintenance averaging 20-25% of initial spend. Lengthy training cycles stretch scarce engineering resources, delaying project delivery. Cloud subscription models promise relief, yet concerns over data residency and compliance with critical-infrastructure rules slow migration.
IT-OT Convergence Bottlenecks Slow Implementation
Utilities report 18-24-month timelines to integrate new analysis platforms with legacy SCADA data due to non-standard protocols and cybersecurity hardening. Scarcity of personnel skilled in both protective-relay settings and secure cloud orchestration compounds delays. Where integration lags, operators keep manual workflows that undermine real-time situational awareness and limit the ROI of analytics investments.
*Our forecasts treat driver/restraint impacts as directional, not additive. The impact forecasts reflect baseline growth, mix effects, and variable interactions.
Segment Analysis
By Deployment Type: Cloud Migration Accelerates Despite Security Concerns
The power system analysis software market size for on-premise deployments stands at USD 7.16 billion in 2025, reflecting 66.73% revenue share, yet its CAGR trails at 9.3% as utilities pivot to flexible compute models. Cloud subscriptions grow from USD 3.57 billion in 2025 at a 14.36% clip, signaling a structural shift propelled by elastic simulation workloads and reduced hardware refresh cycles. Large investor-owned utilities pilot hybrid architectures—using cloud for planning studies and on-premise for real-time protection coordination—to balance latency, sovereignty, and compliance needs. Early adopters cite 30% savings in total cost of ownership after eliminating redundant high-performance clusters. Risk perceptions ease as leading platforms obtain SOC 2 Type II and ISO 27001 certifications and meet NERC CIP segmentation guidance. Smaller cooperatives gain parity, accessing enterprise-grade solvers without the capital outlay once required to purchase perpetual licenses. Yet data-localization laws in India and cross-border transfer limits in the European Union mean global vendors must deploy regional nodes or partner with sovereign-cloud providers, adding complexity to service-level agreements.
A parallel advantage surfaces in compute-intensive electromagnetic-transient analyses, where cloud instances running thousands of cores compress week-long stability studies into overnight jobs. This acceleration shortens interconnection-queue timelines for renewable developers, improving project economics and grid-readiness scores. Vendors that optimize licensing to charge per CPU-hour or per simulation scenario broaden addressable segments, particularly among engineering, procurement, and construction (EPC) firms that require sporadic access during project peaks. The shift also enables continuous software updates, ensuring modules stay current with IEEE standard revisions without manual patch management.


By Module Type: Short-Circuit Analysis Gains Momentum
Load-flow and power-flow engines remain the backbone, contributing 27.82% of 2024 revenues, equating to USD 2.98 billion of the power system analysis software market size. However, short-circuit modules, at USD 1.91 billion in 2025, outpace the base with a 12.58% CAGR. Updated IEEE 1584-2018 arc-flash tables oblige utilities to reevaluate protective-device coordination and personal protective equipment (PPE) classes every five years, transforming safety compliance into a predictable license-renewal cycle. Vendors integrating fault models directly with 3D substation layouts and BIM repositories reduce duplicate data entry, making compliance workflows faster and less error-prone.
Broader module suites increasingly incorporate harmonic, flicker, electromagnetic-transient, and cyber-penetration analyses. Demand for harmonic solvers grows in grids with large solar inverters and electric-vehicle chargers, where power-quality excursions can curtail feed-in levels. Real-time digital-twin links allow operators to feed SCADA streams into study cases every 15 minutes, automatically recalibrating protection settings when topology changes. These high-automation features raise switching costs, anchoring customers to multi-module ecosystems and eroding the business case for point solutions.
By End User: Renewable Developers Drive Growth
Electric utilities and ISOs anchor the market with 54.63% revenue share worth USD 5.86 billion in 2025. Yet renewable power plant owners are the fastest risers, growing at 12.64% as hybrid portfolios and merchant storage assets compel sophisticated interconnection and stability modeling. Developers of 500 MW solar-plus-storage complexes simulate frequency-response curves, battery degradation, and curtailment risk in one platform, helping financiers underwrite merchant revenues with tighter P50/P90 projections.
Industrial plants, particularly semiconductor fabs and gigafactories, require motor-starting and arc-flash studies to qualify for insurance and regulatory approvals, supporting a steady mid-single-digit growth rate. Commercial data-center operators become a noteworthy niche, as 100 MW hyperscale campuses integrate on-site generation, synchronous condensers, and large-scale UPS systems that demand integrated load-flow and short-circuit studies to maintain uptime SLAs. EPC firms leverage subscription licenses during design phases and pass costs through to project owners, expanding vendor footprints in emerging markets without direct sales footprints.

By Application: Renewable Integration Studies Surge
Transmission and distribution planning, representing 39.97% of 2024 deployments, remains the single largest use case by volume, yet renewable integration and grid-impact studies grow faster, achieving a 12.94% CAGR. State regulators in the United States now require utilities to file proactive hosting-capacity maps when solar penetration exceeds 15% feeder load, creating recurring analysis cycles. Offshore wind tenders mandate full electromagnetic-transient assessments of export cables and grid-forming converters, pushing specialty study hours upward. Smart-grid and micro-grid design segments advance as commercial campuses seek resilience solutions; here, real-time digital simulators feed operator training systems that mirror the live SCADA environment, providing muscle-memory drills for blackout recovery.
Generation-expansion planners shift from gas-turbine builds to portfolio optimization across storage chemistries, demand response, and hydrogen-ready peakers. Software integrating production-costing engines with market-clearing algorithms gives resource planners a single pane of glass for economic dispatch and nodal congestion forecasts. Operator-training simulators also benefit from cloud elastic compute, enabling concurrent sessions for regional reliability coordinators preparing for extreme-weather events.
Geography Analysis
Europe’s 31.38% revenue share in 2024 underscores its mature yet technologically demanding customer base. National grid operators frequently carry out cross-border power-flow optimizations and frequency-containment reserve analyses, requiring multi-language, multi-code support. The region’s REPowerEU plan accelerates hydrogen-ready pipeline conversions, increasing short-circuit current levels and necessitating recalibrated protection settings. Utilities deploy real-time stability monitors that merge synchrophasor data with digital-twin models, illustrating how advanced analytics have become operational staples, not future aspirations.
Asia-Pacific posts the fastest 13.19% CAGR through 2030, propelled by China’s ultra-high-voltage build-out, India’s rooftop-solar boom, and Southeast Asia’s industrial electrification. National codes vary significantly, from Japan’s stringent momentary voltage drop thresholds to Australia’s dynamic-inertia requirements, elevating demand for configurable study templates. Vendors with local language support, regional cloud data centers, and pre-certified grid-code libraries capture market share quickly. Government funding for smart-grid pilots, such as Japan’s Asia-Pacific Power Summit initiatives, further accelerates deployments.
North America maintains solid single-digit growth anchored in grid-modernization spending exceeding USD 100 billion and robust cybersecurity enforcement. Data-center load spikes in Virginia and Texas force utilities to run probabilistic contingency studies at weekly intervals, boosting solver-hour consumption. California’s resource-adequacy reforms drive adoption of probabilistic resource-adequacy modules that couple meteorological scenarios with plant-availability distributions, a functionality now bundled in several flagship suites. The Middle East and Africa, while smaller, see double-digit growth as Gulf utilities integrate 700 MW-scale solar parks and Africa electrifies remote regions with micro-grids requiring resilient islanding algorithms.


Competitive Landscape
The power system analysis software market features moderate concentration; the top five vendors-Siemens, ABB, Schneider Electric, DIgSILENT, and PowerWorld-hold just under half of the total 2024 revenues. Industrial conglomerates cross-sell software with hardware products such as relays, SCADA gear, and transformers, enabling bundled procurement cycles. Niche specialists defend share through deep solvers: DIgSILENT’s electromagnetic-transient engine or ETAP’s protective-device library. Private equity acquisitions, notably the USD 1.2 billion buyout of Energy Exemplar, indicate rising valuations for platforms that blend capacity-expansion and power-flow analytics into holistic planning ecosystems.
Strategic moves in 2025 revolve around AI augmentation. Hitachi Energy launched Nostradamus AI, combining machine-learning fault prediction with classical load-flow, promising 25% faster scenario evaluations. Siemens Energy’s purchase of Reactive Technologies adds real-time inertia measurement-critical for grids dominated by inverter-based resources. ABB’s acquisition of Power Grid Engineering secures protection-coordination expertise, helping meet North American safety mandates. Cloud alliances proliferate; Schneider Electric partners with Microsoft Azure to target mid-tier users hesitant to invest in on-premise high-performance clusters.
Startups pursue “model-as-a-service,” offering API-accessible stability runs packaged per simulation. Patent filings for AI-enhanced optimization algorithms climb 47% in 2024, showing substantial R&D momentum. Yet barriers remain steep: vendors need ISO-certified processes, regional data centers, and 24/7 support desks to win utility contracts. Competitive advantage increasingly derives from solution breadth, proven cybersecurity posture, and time-to-insight metrics. Market consolidation is likely to continue as incumbents buy specialist solvers to pre-empt disruption.
Power System Analysis Software Industry Leaders
Siemens AG
General Electric Company
ABB Ltd
Schneider Electric SE
Eaton Corporation plc
- *Disclaimer: Major Players sorted in no particular order


Recent Industry Developments
- August 2025: EasyPower released Version 2025 with enhanced short-circuit calculations for unbalanced networks and 64-bit architecture support, integrated with Revit 2025
- July 2025: Blackstone and Vista Equity Partners completed the USD 1.2 billion acquisition of Energy Exemplar, merging PLEXOS market-modeling with power-flow analytics for end-to-end energy planning
- June 2025: ABB acquired Power Grid Engineering for USD 285 million, adding HVDC and protection-coordination expertise to its portfolio
- May 2025: Hitachi Energy launched Nostradamus AI platform for predictive grid optimization


Global Power System Analysis Software Market Report Scope
| On-premise |
| Cloud-based |
| Load-flow and Power-flow Analysis |
| Short-circuit Analysis |
| Harmonics and Flicker Analysis |
| Arc-flash and Protection-coordination |
| Other Module / Tool Type |
| Electric Utilities and ISOs |
| Industrial and Manufacturing Plants |
| Renewable Power Plant Owners |
| Commercial and Data-center Operators |
| Engineering, Procurement and Construction (EPC) Firms |
| Transmission and Distribution Planning |
| Generation Expansion Planning |
| Renewable Integration and Grid-impact Studies |
| Smart-grid and Micro-grid Design |
| Real-time Digital Simulation and Operator Training |
| North America | United States | |
| Canada | ||
| Mexico | ||
| Europe | Germany | |
| United Kingdom | ||
| France | ||
| Russia | ||
| Rest of Europe | ||
| Asia-Pacific | China | |
| Japan | ||
| India | ||
| South Korea | ||
| Australia | ||
| Rest of Asia-Pacific | ||
| Middle East and Africa | Middle East | Saudi Arabia |
| United Arab Emirates | ||
| Rest of Middle East | ||
| Africa | South Africa | |
| Egypt | ||
| Rest of Africa | ||
| South America | Brazil | |
| Argentina | ||
| Rest of South America | ||
| By Deployment Type | On-premise | ||
| Cloud-based | |||
| By Module / Tool Type | Load-flow and Power-flow Analysis | ||
| Short-circuit Analysis | |||
| Harmonics and Flicker Analysis | |||
| Arc-flash and Protection-coordination | |||
| Other Module / Tool Type | |||
| By End User | Electric Utilities and ISOs | ||
| Industrial and Manufacturing Plants | |||
| Renewable Power Plant Owners | |||
| Commercial and Data-center Operators | |||
| Engineering, Procurement and Construction (EPC) Firms | |||
| By Application | Transmission and Distribution Planning | ||
| Generation Expansion Planning | |||
| Renewable Integration and Grid-impact Studies | |||
| Smart-grid and Micro-grid Design | |||
| Real-time Digital Simulation and Operator Training | |||
| By Geography | North America | United States | |
| Canada | |||
| Mexico | |||
| Europe | Germany | ||
| United Kingdom | |||
| France | |||
| Russia | |||
| Rest of Europe | |||
| Asia-Pacific | China | ||
| Japan | |||
| India | |||
| South Korea | |||
| Australia | |||
| Rest of Asia-Pacific | |||
| Middle East and Africa | Middle East | Saudi Arabia | |
| United Arab Emirates | |||
| Rest of Middle East | |||
| Africa | South Africa | ||
| Egypt | |||
| Rest of Africa | |||
| South America | Brazil | ||
| Argentina | |||
| Rest of South America | |||


Key Questions Answered in the Report
What is the projected value of the power system analysis software market in 2030?
The market is forecast to reach USD 19.05 billion by 2030.
Which region shows the fastest growth for power system analysis platforms?
Asia-Pacific leads with a 13.19% CAGR through 2030, fueled by large-scale renewable deployments and grid-modernization programs.
Why are short-circuit analysis modules gaining share?
Updated IEEE 1584-2018 arc-flash rules and heightened safety enforcement spur utilities to invest in modern short-circuit and protection-coordination tools.
How are cloud deployments changing procurement models?
Cloud platforms shift spending from capital to operating budgets, cut hardware refresh cycles, and grant smaller utilities access to high-performance solvers.
Which end-user segment is expanding quickest?
Renewable power plant owners, especially those developing hybrid solar-wind-storage assets, are growing at 12.64% as they require complex interconnection studies.
How do cybersecurity mandates influence software features?
Standards such as NERC CIP-015-1 drive demand for integrated cyber-physical modeling that simulates the grid impact of network attacks and data-integrity breaches.
Page last updated on:


