
Market Overview
| Study Period | 2020 - 2031 |
|---|---|
| Market Size (2026) | USD 8.19 Billion |
| Market Size (2031) | USD 11.55 Billion |
| Growth Rate (2026 - 2031) | 7.10 % |
| Fastest Growing Market | Asia Pacific |
| Largest Market | North America |
| Market Concentration | Medium |
Major Players *Disclaimer: Major Players sorted in no particular order Image © Mordor Intelligence. Reuse requires attribution under CC BY 4.0. | |
Evaporative Cooling Market Analysis by Mordor Intelligence
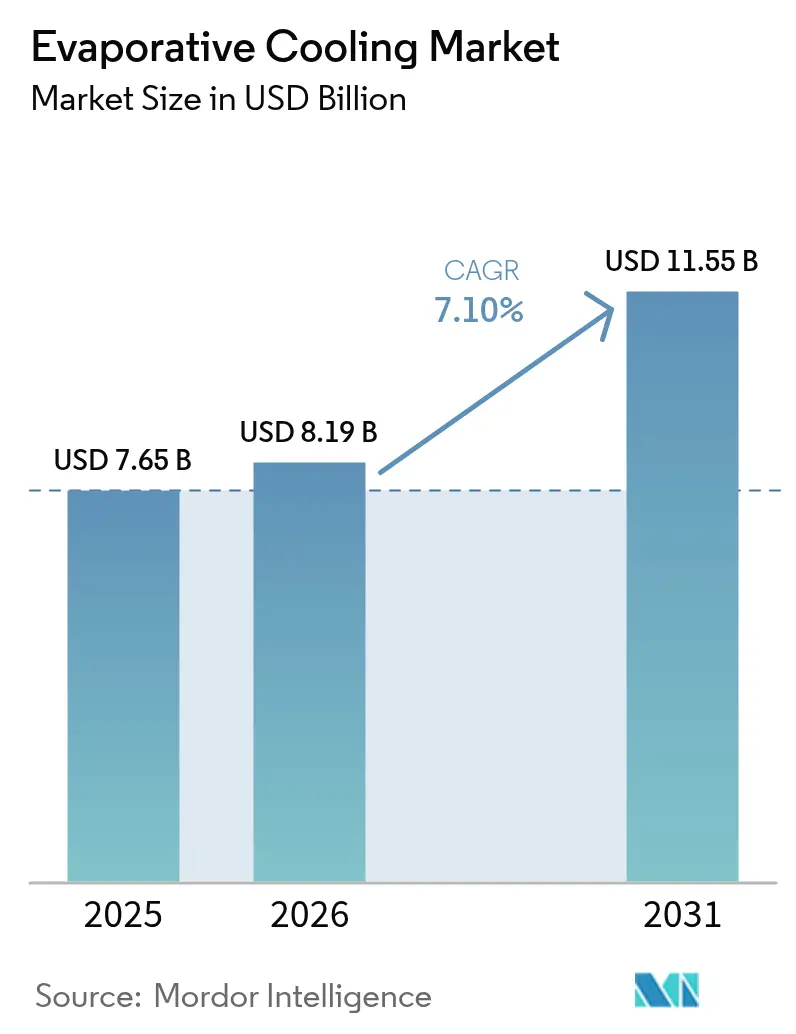
The evaporative cooling market size is expected to grow from USD 7.65 billion in 2025 to USD 8.19 billion in 2026 and is forecast to reach USD 11.55 billion by 2031 at 7.10% CAGR over 2026-2031. Growing demand for energy-efficient HVAC, aggressive refrigerant phase-downs, and data-center sustainability mandates keep the evaporative cooling market firmly on a growth trajectory. Operators report 30-40% electrical savings over mechanical cooling, and utilities in water-stressed U.S. states offer rebates that shorten payback periods to two years.[1]California Energy Commission, “Building Energy Efficiency Standards,” energy.ca.gov Two-stage systems are overcoming humidity limitations, while IoT-enabled controls unlock predictive maintenance that cuts downtime and water use. Industrial and agricultural facilities view evaporative technology as a resilience tool against rising temperatures, and large-capacity units now cool hyperscale data halls where Power Usage Effectiveness (PUE) targets below 1.1 are the new norm.[2]Google Cloud, “Google Cloud Announces New Sustainability Commitments,” cloud.google.com
Key Report Takeaways
- By application, residential buildings led with 71.05% of evaporative cooling market share in 2025, while data centers recorded the fastest 9.05% CAGR through 2031.
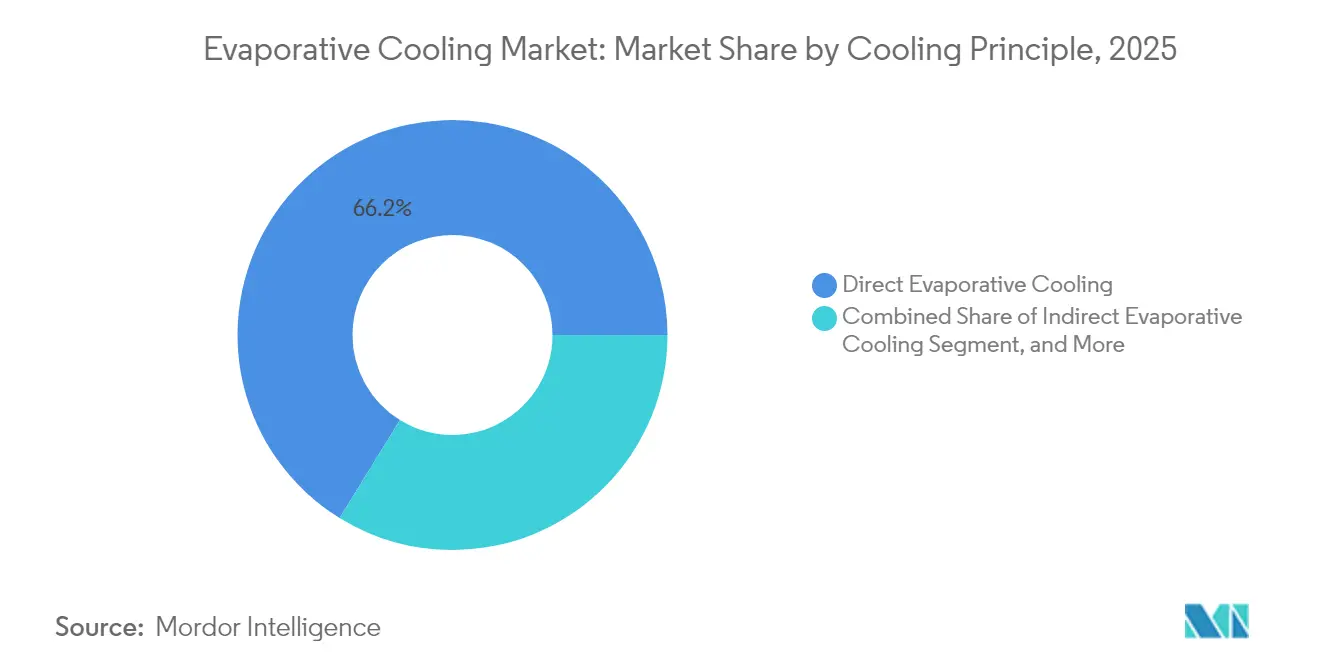
- By cooling principle, direct evaporative systems commanded 66.20% revenue share in 2025 in the evaporative cooling market, whereas two-stage designs are projected to expand at a 7.72% CAGR to 2031.
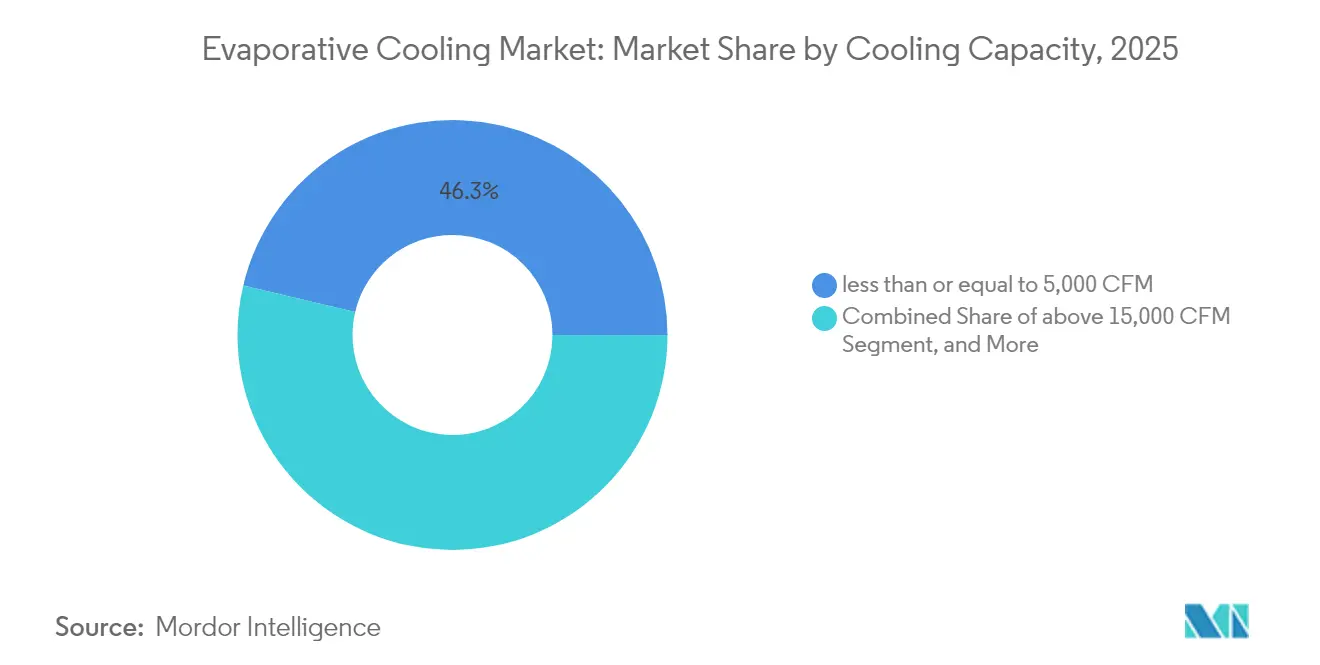
- By cooling capacity, less than or equal to 5,000 CFM units accounted for 46.30% share of the evaporative cooling market size in 2025, yet above 15,000 CFM systems are advancing at an 8.48% CAGR.
- By component, cooling pads held 34.60% share in 2025 in the evaporative cooling market, and control systems are set to grow the quickest at a 7.12% CAGR.
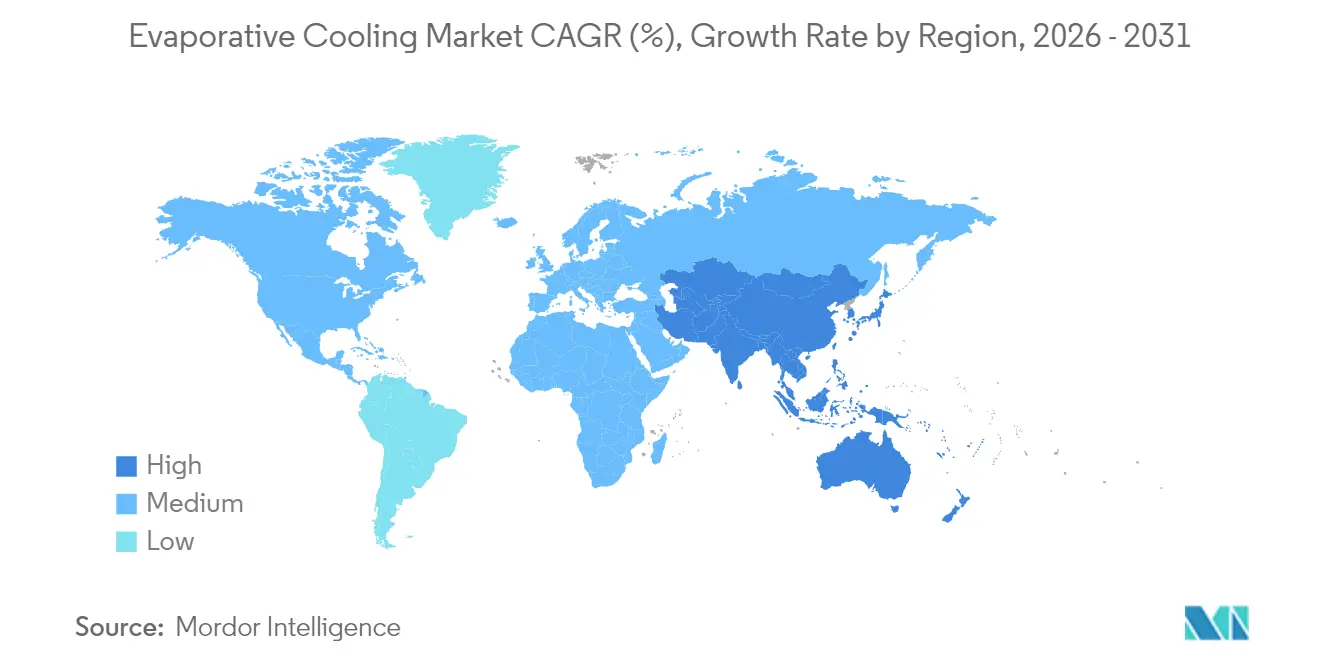
- By geography, North America dominated with a 38.20% share in 2025 in the evaporative cooling market, while Asia-Pacific is on track for the highest 8.10% CAGR through 2031.
Note: Market size and forecast figures in this report are generated using Mordor Intelligence’s proprietary estimation framework, updated with the latest available data and insights as of 2026.
Market Trends and Insights
Drivers Impact Analysis of Evaporative Cooling Market*
| Driver | (~) % Impact on CAGR Forecast | Geographic Relevance | Impact Timeline |
|---|---|---|---|
| Demand for cost-effective cooling solutions | +1.5% | Global, with concentration in emerging markets | Medium term (2-4 years) |
| Data-center adoption for energy efficiency | +1.8% | North America and EU, expanding to APAC | Short term (≤ 2 years) |
| Booming construction in arid regions | +1.2% | Middle East, Southwest US, Australia | Long term (≥ 4 years) |
| Environmental regulations favoring low-GWP cooling | +0.9% | EU, California, expanding globally | Medium term (2-4 years) |
| Integration with off-grid solar-hybrid HVAC | +0.7% | Rural areas globally, off-grid applications | Long term (≥ 4 years) |
| Water-recapture pads cutting consumptive use | +0.4% | Water-stressed regions globally | Medium term (2-4 years) |
| Source: Mordor Intelligence | |||


Cost-Effectiveness Drives Industrial Adoption
Manufacturing plants in dry U.S. states report operating expenses that are 60-80% lower than those of mechanical refrigeration, with capital recovery inside two years as electricity tariffs climb. Typical wet-bulb conditions below 78 °F enable 15-20 °F air temperature reductions using one-tenth the power of chilled-water systems. Texas and Arizona poultry farms cite 25% lower heat-stress mortality alongside 70% savings on cooling bills.
Data Centers Embrace Evaporative Cooling for PUE Optimization
Hyperscale operators use indirect and two-stage designs to achieve PUE as low as 1.06, far outperforming traditional averages of 1.4-1.6. The EU Energy Efficiency Directive obliges facilities above 500 kW IT load to recover waste heat by 2025, positioning evaporative technology as a compliance enabler. Microsoft’s Arizona campus proves all-year viability even in desert climates by pre-cooling intake air before final adiabatic conditioning.
Construction Boom in Arid Regions Fuels Demand
Saudi Arabia’s NEOM, Qiddiya, and Red Sea megaprojects specify evaporative units for 80% of planned residences to meet net-zero energy targets. The United Arab Emirates now requires evaporative pre-cooling on HVAC systems in large commercial buildings, while Australia’s Northern Territory grants accelerated depreciation that cuts payback by 18 months.
Environmental Regulations Accelerate Low-GWP Adoption
The Kigali Amendment mandates an 80-85% HFC phase-down by 2036, driving interest in refrigerant-free solutions. California’s Title 24 offers compliance credits that trim mechanical system capacity by up to 20%. The EU F-Gas Regulation will ban high-GWP refrigerants in new equipment after 2025, prompting brisk retrofits across food retail and light-industrial sites.
Restraints Impact Analysis of Evaporative Cooling Market*
| Restraint | (~) % Impact on CAGR Forecast | Geographic Relevance | Impact Timeline |
|---|---|---|---|
| Dependence on external climate conditions | -0.8% | Humid regions globally, coastal areas | Long term (≥ 4 years) |
| High water footprint in water-stressed zones | -0.6% | Southwest US, Middle East, Australia | Medium term (2-4 years) |
| Legionella and microbial health concerns | -0.4% | Global, particularly institutional buildings | Short term (≤ 2 years) |
| Sensor interoperability issues in smart buildings | -0.3% | Developed markets with smart building adoption | Medium term (2-4 years) |
| Source: Mordor Intelligence | |||
Climate Dependence Limits Geographic Expansion
Efficiency drops below 50% when ambient humidity rises beyond 60%, limiting standalone adoption in tropical belts. Southeastern U.S. facilities report seasonal performance swings that necessitate hybrid HVAC, boosting upfront spending by 30-40%.[3]ASHRAE Journal, “Technical Resources,” ashrae.org Manufacturers respond with two-stage and desiccant-assisted variants, yet cost premiums still deter small commercial buyers.
Water Scarcity Challenges Adoption in Arid Markets
Standard units consume 1.5-3 gallons per ton-hour, prompting restrictions when drought levels rise. California utilities have paused rebates during severe shortages, and tiered water tariffs in Australia can triple operating costs, eroding the economic edge.[4]California Public Utilities Commission, “Demand Side Management,” cpuc.ca.gov Mandatory recycling adds USD 5,000-15,000 to residential installs, and far more in industrial settings.
*Our forecasts treat driver/restraint impacts as directional, not additive. The impact forecasts reflect baseline growth, mix effects, and variable interactions.
Evaporative Cooling Market Segment Analysis
By Cooling Principle:
Two-Stage Systems Expand the Addressable Climate ZoneDirect evaporative designs retained 66.20% of revenue in 2025 because of low installed cost between USD 3,000 and USD 8,000. Yet two-stage solutions are forecast to deliver a 7.72% CAGR as they sustain comfortable supply air at ambient humidity up to 75%. The evaporative cooling market size for two-stage units is projected to double by 2031 as data centers and schools in mixed-humid climates prioritize efficiency without sacrificing comfort. Manufacturers hedge risk by offering modular upgrades that convert installed direct units into two-stage configurations, deferring large capital outlays until humidity demands change.
Demand for indirect evaporative modules grows inside packaged rooftop units that serve big-box retail and logistics centers. Air-side economizers route cool outdoor air through polymer heat exchangers that never contact conditioned space, protecting indoor air quality while capturing free cooling hours. Integrators bundle ultraviolet lamps and antimicrobial coatings to address Legionella fears, assembling turnkey kits that slot into existing ductwork. As a result, the evaporative cooling market continues to blend traditional pads with emerging polymer membranes and high-surface-area heat pipes.


By Application:
Data Centers Shift Growth Focus Beyond Residential MainstayResidential installations hold 71.05% of 2025 revenue, a legacy of widespread adoption across U.S. Sunbelt states and Australia. Low energy draw lets homeowners offset power needs with rooftop solar, and utility incentives of USD 500-2,000 cut net cost further. Still, hyperscale cloud operators will add the most new capacity, with the segment advancing at a 9.05% CAGR. The evaporative cooling market share for data centers is expected to rise sharply as more jurisdictions require PUE reporting and waste-heat reuse.
Commercial properties deploy roof-mounted evaporative pre-coolers to trim compressor runtime and dodge peak-demand tariffs that can reach USD 0.35 per kWh. Poultry houses and greenhouses integrate pads for animal welfare and crop protection, noting 25% mortality reductions and 15% yield gains during extreme heat. Such cross-sector versatility shields the evaporative cooling industry from cyclical swings in residential construction.
By Cooling Capacity:
Large-Frame Installations Lead Investment PlansSingle-module units rated less than or equal to 5,000 CFM represented 46.30% of shipments in 2025, but above 15,000 CFM systems will generate the highest incremental revenue at an 8.48% CAGR. The evaporative cooling market size for large-frame units is growing as hyperscale campuses specify cooling towers that exceed 100,000 CFM per cell. Manufacturers now ship modular skids that bolt together in pairs, trimming onsite labor and letting operators phase investments as IT-load rises.
Mid-range 5,001-15,000 CFM models thrive in community retail, schools, and multi-family dwellings. They balance compact footprints with airflow sufficient to displace aging rooftop chillers. Variable-speed EC motors save up to 40% of fan energy and slot into the same curb rails, easing retrofits. These gains reinforce the broader evaporative cooling market momentum despite water-use scrutiny.
By Component:
Controls and Sensors Unlock Predictive PerformanceCooling pads still provide 34.60% of component sales because every system needs the medium. Yet control electronics and sensors are forecast to rise at 7.12% CAGR, outpacing hardware. Cloud-connected gateways log fan speed, sump temperature, and pad saturation, generating actionable alerts that cut water waste by 20% and extend pad life to five seasons. The evaporative cooling market now prizes algorithmic efficiency as much as physical durability.
Manufacturers embed wireless mesh into control boards so units link with building-management platforms via BACnet or Modbus. Fans shift to EC motors that adjust airflow on a 0.1 Hz resolution, optimizing latent heat removal while holding indoor humidity below 55%. Smart valves meter make-up water by conductivity, capping scaling and Legionella risk. Component suppliers are therefore racing to patent digital twins and self-calibrating sensors, a trend confirmed by a 40% jump in evaporative cooling patent filings in 2024.
Geography Analysis
Southwestern United States Evaporative Cooling Market
North America held 38.20% of global revenue in 2025, anchored by the United States Southwest where daytime wet-bulb temperatures make evaporative cooling the most economical choice. Title 24 energy codes in California assign compliance credits that reduce compressor capacity, effectively subsidizing the evaporative cooling market. Incentive programs from Nevada and Arizona utilities reimburse up to USD 2,000 per residential install, sustaining demand amid high mortgage rates. Yet prolonged drought keeps policy fluid. During 2022-2023 shortages some utilities paused rebates, signaling a need for recirculating designs and alternative water sources.
APAC and Middle East Evaporative Cooling Market
Asia-Pacific is forecast to be the fastest-growing cluster at an 8.10% CAGR, and its evaporative cooling market size is projected to double by 2031. Saudi Arabia’s NEOM alone represents a USD 2 billion lifetime opportunity as codes demand adiabatic conditioning for 80% of planned homes. Australia offers accelerated depreciation, while India’s green-building council now recognizes evaporative pre-cooling points under its IGBC rating. Rapid urbanization and tight power reserves make low-energy HVAC essential, pushing state governments to explore water-recycling pads and treated wastewater loops.
Europe, Middle East and South America Evaporative Cooling Market
Europe shows mixed momentum. Northern climates deploy indirect evaporative economizers in data centers across Ireland and the Nordics, leveraging cool ambient air for free cooling 80% of the year. Southern Europe is slower due to higher humidity, but Spain’s logistics parks integrate two-stage systems that guarantee supply temperatures under 75 °F even at 60% relative humidity. The Middle East, despite water scarcity, moves ahead with high-efficiency pads and brackish-water tolerant materials. South America remains nascent but promising, led by Brazil where automotive paint booths adopt adiabatic coolers to save 70% on energy.

Regulatory Landscape
Policy and standard-setting increasingly tie data-center cooling choices to auditable energy and water metrics, reinforcing the case for evaporative and hybrid designs that document low power draw and controlled water use. In the European Union, the Energy Efficiency Directive (recast 2023/1791) introduces waste-heat recovery planning for larger sites, with a requirement from October 2025 for data centers above 1 MW energy input to assess the feasibility of waste-heat recovery. This direction strengthens demand for air-side and adiabatic approaches that support heat-reuse architectures.
Value Chain Analysis
The evaporative cooling value chain runs from raw-material and component inputs (polymer and metal casings, pumps, valves, EC motors, filtration and water-treatment consumables, and pad or heat-exchanger media) to OEM design and assembly of direct, indirect, and two-stage units, along with larger cooling-tower platforms. Downstream, system integrators and mechanical contractors size and configure equipment, often as hybrid IEC plus mechanical systems in mixed-humid regions, and they integrate controls into building-management systems (BACnet/Modbus). Commissioning and water-quality management are typically supported by ongoing service contracts that increasingly bundle remote monitoring and analytics.
Competitive Landscape
The evaporative cooling market is moderately fragmented. The top five vendors account for roughly 35-40% of global revenue, leaving ample space for regional specialists. Munters deepened its industrial footprint by acquiring Geoclima for EUR 85 million (USD 93.5 million) in 2024, adding adiabatic chillers aimed at data halls. SPX Cooling launched towers with drift eliminators that curb water loss by 30%, a feature resonating in drought-aware geographies.
Competition now centers on proprietary software that integrates sensors, water-treatment chemistries, and fan controls into single dashboards. Subscription models that bundle hardware with predictive-maintenance analytics are taking hold in Australia and Western Europe. Portable evaporative units for outdoor events, introduced by Portacool, open new consumer channels, while Honeywell’s smart thermostats tailor airflow to occupancy signals from home-automation hubs. Patent filings for pad coatings, UV sterilization, and AI-driven humidity prediction rose 40% in 2024, underscoring an innovation race that reshapes buyer criteria beyond airflow and price.
Medium-term, players aim to marry evaporative and dry-cooling circuits into configurable hybrids. Baltimore Aircoil’s Nexus platform automatically toggles modes to suit humidity and electricity prices, demonstrating how the evaporative cooling industry harnesses digitalization to hedge climate variability. Market entry barriers remain modest for hardware, but growing software content and water-quality liabilities could spur consolidation as smaller firms seek compliance support and capital for R&D.
Evaporative Cooling Industry Leaders
Delta Cooling Towers Inc.
Condair Group AG
Munters Group AB
SPX Cooling Technologies
ENEXIO Water Technologies GmbH
- *Disclaimer: Major Players sorted in no particular order

Evaporative Cooling Market Companies Covered in this Report
- Baltimore Aircoil Company Inc.
- SPX Cooling Technologies Inc.
- Delta Cooling Towers Inc.
- Condair Group AG
- Munters Group AB
- Seeley International Pty Ltd
- Symphony Limited
- Portacool LLC
- Phoenix Manufacturing Inc.
- Honeywell International Inc. (Honeywell Comfort)
- Colt Group Limited
- Cambridge Air Solutions Inc.
- Frigiking – Nortek Global HVAC LLC
- Bonaire – Climate Technologies Pty Ltd
- Hessaire Products Inc.
- Airgroup Australia Pty Ltd (Coolair)
- Oasis Coolers LLC
- Swiss Evaporative Systems AG
- Celsius Design Limited
- CFW Evapcool (CFW Industries Ltd.)
- ENEXIO Water Technologies GmbH
- Temperzone Ltd.
- SPIG S.p.A.

Market Opportunities and Future Outlook
A key whitespace sits at the intersection of data-center efficiency programs and water accountability, where operators need cooling architectures that keep PUE low while also showing disciplined WUE management and transparent reporting. The EU data-center sustainability rating scheme (Delegated Regulation (EU) 2024/1364) and emerging transparency proposals in the United States (S. 4213) are pulling metering, controls, and reporting into procurement decisions. This creates room for vendors that package evaporative or hybrid cooling with verified instrumentation, water-treatment automation, and audit-ready dashboards.
Recent Industry Developments in Evaporative Cooling Market
- May 2026: Condair launched the Condair Vita Power, a high-pressure direct room humidification system targeted at production halls and modern office spaces. The release supports Condair's installed-base pull-through for evaporative media, water-treatment, and controls across broader HVAC portfolios where customers often buy integrated humidity and cooling solutions.
- December 2025: Munters won data center equipment orders for a US colocation customer, covering chilled water computer room air handlers, coolant distribution units, and chillers, with deliveries planned to begin in Q4 2026. The award highlights data-center customers' preference for vendors that can supply multi-technology thermal-management stacks, influencing how evaporative and hybrid cooling packages are specified alongside liquid and chilled-water infrastructure.
- June 2024: Condair announced plans for a new 400,000 sq ft production facility in Richmond, Virginia, to bolster its evaporative-technology business in North America, with consolidation targeted by 2026. The expansion adds regional manufacturing depth that can shorten lead times for large projects and support localization requirements for commercial and mission-critical cooling deployments.


Evaporative Cooling Market Report Scope and Research Methodology
Market Definition and Coverage
This market includes evaporative cooling equipment and related system components that cool air using water evaporation, covering residential, commercial, industrial, and other comparable end uses. The sizing is in value terms, reflecting sales tied to installed or replaced evaporative cooling systems.
Scope exclusions: Refrigerant-based air conditioning and heat pump systems are excluded from this market sizing.
Segments Covered in This Report
- By Cooling Principle
- Direct Evaporative Cooling
- Indirect Evaporative Cooling
- Two-stage Evaporative Cooling
- By Application
- Residential Buildings
- Commercial Buildings
- Industrial Facilities
- Confinement Farming
- Data Centers
- By Cooling Capacity – CFM
- less than or equal to 5,000 CFM
- 5,001–15,000 CFM
- above 15,000 CFM
- By Component
- Cooling Pads
- Fans and Blowers
- Water Pumps
- Control Systems and Sensors
- Other Components
- By Geography
- North America
- United States
- Canada
- South America
- Brazil
- Argentina
- Rest of South America
- Europe
- Germany
- United Kingdom
- France
- Spain
- Italy
- Rest of Europe
- Asia-Pacific
- China
- India
- Japan
- South Korea
- Rest of Asia-Pacific
- Middle East and Africa
- Middle East
- Saudi Arabia
- United Arab Emirates
- Turkey
- Rest of Middle East
- Africa
- South Africa
- Nigeria
- Rest of Africa
- Middle East
- North America
Data Sources, Market Sizing, and Validation
Desk Research
We started by compiling demand and supply signals that explain where evaporative cooling is used and how quickly adoption can shift. Public and official sources were used for anchors such as construction activity, climate and heat exposure, energy efficiency rules, and industrial output. Examples include the US Energy Information Administration, the US Census Bureau, Eurostat, the International Energy Agency, and ASHRAE publications.
To convert those signals into a workable value model, we also reviewed company annual reports, investor presentations, customs summaries, and reputable trade press coverage on HVAC equipment cycles and retrofit behavior. In addition, we used a paid subscription for company financials and news, along with patent database access, selectively to confirm product positioning and to sense-check innovation intensity across pads, controls, and water management. The desk sources listed here are illustrative, and additional public references were used for data collection, validation, and clarification.
Primary Interviews and Surveys
Primary work was used to pressure-test what we saw in desk findings, with a focus on pricing, channel markups, and the situations where evaporative cooling is selected instead of alternative cooling options. We interviewed a mix of manufacturers, component suppliers, distributors, HVAC contractors, and large end users across key regions, so assumptions on adoption pace, replacement cycles, and typical configurations could be aligned to observed buying behavior.
Distribution of primary research fieldwork respondents
| Company type | Respondent position | Region |
|---|---|---|
| Top tier: 30% | CXOs: 19% | APAC: 48% |
| Mid tier: 48% | Functional/Unit leaders: 22% | EMEA: 29% |
| Smaller Players: 22% | Managers: 59% | Americas: 23% |
Market-Sizing & Forecasting
The core model uses a top-down build where construction and retrofit activity, climate suitability, and end-use penetration rates are combined to reconstruct the addressable demand pool by region and application. We then convert demand into value using typical system pricing. To keep totals realistic, the outputs are corroborated with selective bottom-up checks, including sampled average selling price ranges by capacity (CFM tiers), channel checks across contractors and distributors, and a limited roll-up of supplier revenues where disclosures are available.
Inputs that mattered most in this market included new floor space additions in hot and dry zones, replacement frequency of coolers and major components (pads, fans, pumps), electricity price sensitivity that affects switching, water availability constraints that shape feasible run hours, and the mix shift between direct, indirect, and two-stage systems by application. When a bottom-up signal was missing in a smaller geography, we filled gaps using proxy indicators such as building stock growth and HVAC spend per square foot, then rechecked the implied unit intensity with interviews.
For forecasting, we ran scenario analysis because this market is strongly affected by weather extremes and water-related operating limits, which can shift faster than long-cycle construction data. Adoption and pricing paths were adjusted using expert expectations on energy codes, commercial retrofit budgets, and component cost movement, and then re-run to ensure the implied CAGR remains consistent with the demand drivers discussed by respondents.
Data Validation & Update Cycle
We triangulate the final numbers by comparing model outputs against independent signals such as regional construction spending, equipment replacement cycles discussed by installers, and capacity mix trends reported in industry commentary. If a region shows an unusual jump or drop, we revisit the underlying drivers and trigger follow-up calls to confirm whether it reflects a true shift or a data artifact.
Before sign-off, the work goes through multiple analyst review steps where assumptions, currency conversion timing, and year alignment are checked again, followed by a final consistency scan against the latest public releases. Reports are refreshed annually, and interim updates are made when material events occur, followed by a fresh pre-delivery pass so clients receive the most current view.
Mordor Intelligence's Evaporative Cooling Market Estimate Compared With Other Published Estimates
Published values for the evaporative cooling market often do not match because each publisher draws the line differently on equipment counted, the year treated as the current size, and how pricing is converted from units into dollars. Differences also show up when a study relies on more optimistic adoption assumptions or uses a shorter refresh cycle during volatile demand periods.
Packaged refrigerant air conditioners sit outside Mordor Intelligence's scope, and that single inclusion or exclusion can change totals because some estimates blend evaporative coolers with broader HVAC equipment revenues. Other gaps come from how indirect and two-stage systems are treated in industrial and commercial sites, whether component-only sales are mixed with full system value, and whether currency timing uses average-year rates or a point-in-time conversion.
Benchmark comparison
| Source | Market Size | Gaps in Research Methodology |
|---|---|---|
| Mordor Intelligence | USD 8.19 B (2026) | |
| Industry Publisher A | USD 6.80 B (2024) | Uses an earlier base year and may apply a narrower conversion of demand into value, which can understate the impact of commercial retrofits and indirect or two-stage system uptake in later years. |
| Market Publisher B | USD 7.91 B (2024) | Anchors on a different base year and appears to assume faster near-term expansion, which can move the total if penetration and ASP progression are not revalidated against contractor channel feedback and component replacement cycles. |
The spread across sources is mainly explained by year selection, what adjacent cooling revenues get counted, and how price and penetration assumptions are updated. By keeping the market definition tight to evaporative cooling equipment and rechecking key adoption and pricing inputs with field feedback, the estimate stays traceable to clear variables and repeatable steps.


Key Questions Answered in the Report
How fast is the evaporative cooling market expected to grow by 2031?
The market is projected to expand from USD 7.65 billion in 2025 to USD 11.55 billion in 2031, equating to a 7.10% CAGR.
Which application will add the most new revenue over the next five years?
Data centers, growing at a 9.05% CAGR, will generate the largest incremental demand as hyperscale operators pursue PUE targets below 1.1.
Why are two-stage systems gaining traction?
They maintain supply-air comfort in climates where relative humidity reaches 75%, widening the technology’s viable geography while offering 30-40% energy savings versus mechanical cooling.
What is the biggest operational challenge for evaporative units in arid regions?
Water consumption, currently 1.5-3 gallons per ton-hour, can trigger usage fees and drought-related restrictions, driving interest in recirculating and reclaimed-water solutions.
Which region will record the highest growth rate through 2031?
Asia-Pacific is forecast to register an 8.10% CAGR, bolstered by megaprojects such as NEOM and supportive depreciation incentives in Australia.
Page last updated on:


 Your data is secure and never sold or shared.


