Digital Commerce Software Market Size and Share
Market Overview
| Study Period | 2020 - 2031 |
|---|---|
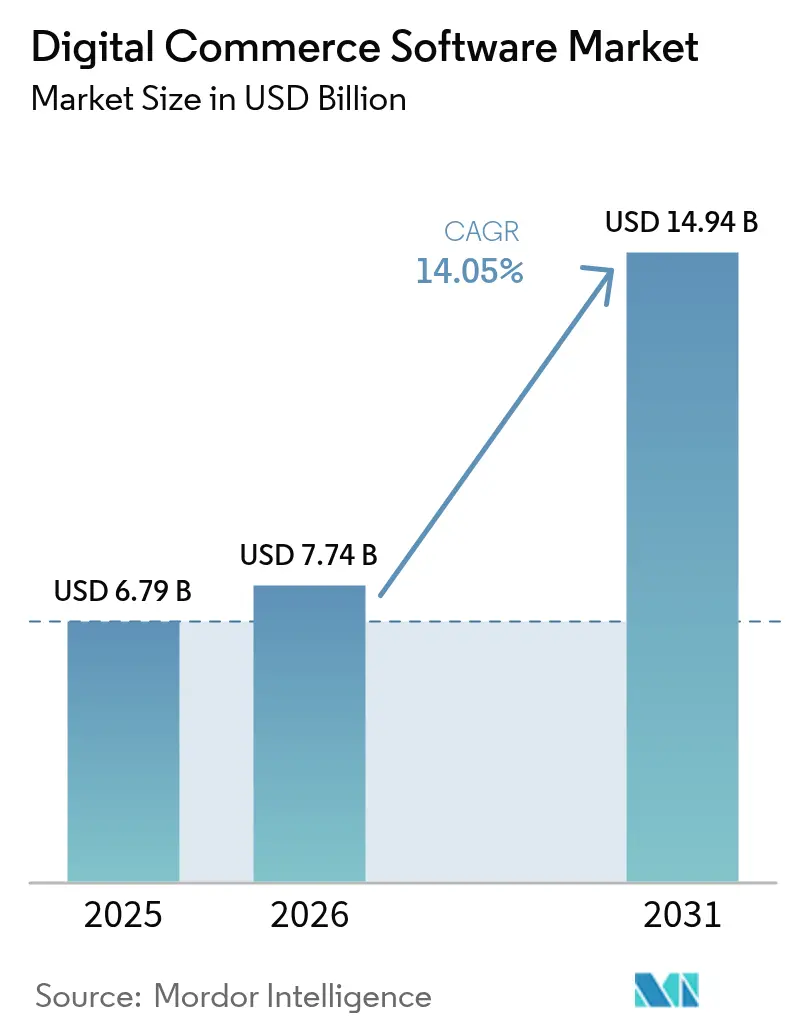
| Market Size (2026) | USD 7.74 Billion |
| Market Size (2031) | USD 14.94 Billion |
| Growth Rate (2026 - 2031) | 14.05% CAGR |
| Fastest Growing Market | Asia Pacific |
| Largest Market | North America |
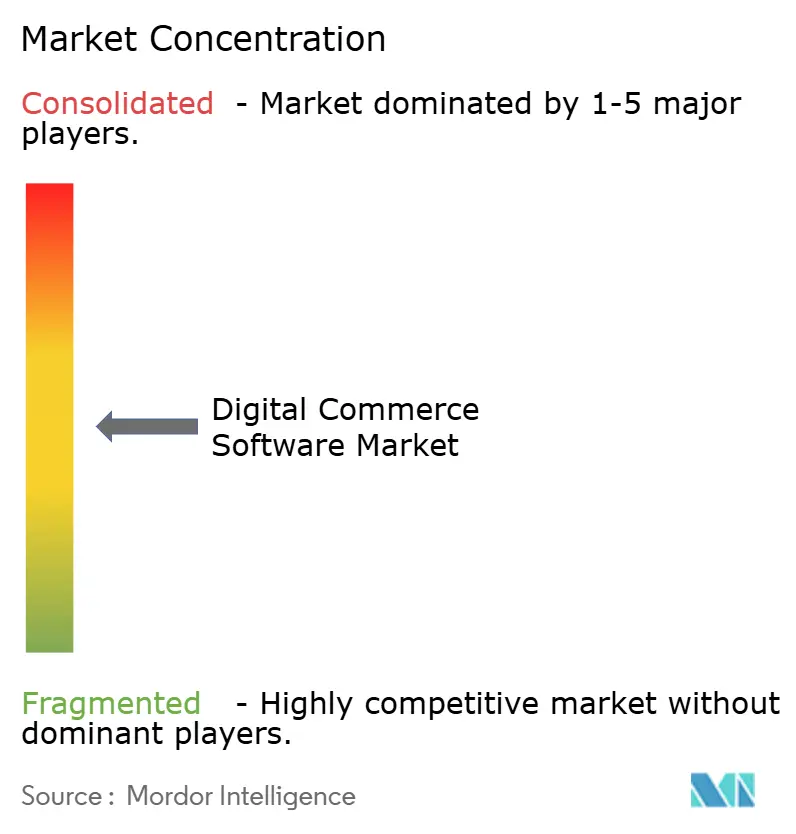
| Market Concentration | Medium |
Major Players *Disclaimer: Major Players sorted in no particular order Image © Mordor Intelligence. Reuse requires attribution under CC BY 4.0. | |
Digital Commerce Software Market Analysis by Mordor Intelligence
The digital commerce software market size is expected to grow from USD 6.79 billion in 2025 to USD 7.74 billion in 2026 and is forecast to reach USD 14.94 billion by 2031 at 14.05% CAGR over 2026-2031. Expansion is fueled by enterprises modernizing legacy infrastructure, adopting composable architectures, and responding to mobile-first consumer expectations that require unified experiences across physical and digital channels. Cloud-native deployment has become the default choice, reducing total cost of ownership while accelerating release cycles. Mobile and social commerce adoption continues to redefine buyer journeys, stimulating investment in API-first platforms that integrate easily with payment services and marketing stacks. At the same time, large organizations prioritize deep ERP and POS integrations, whereas small and medium-sized enterprises (SMEs) are leveraging SaaS to access sophisticated capabilities that previously demanded extensive capital budgets.[1]Adobe Inc., “Adobe Commerce,” adobe.com
Key Report Takeaways
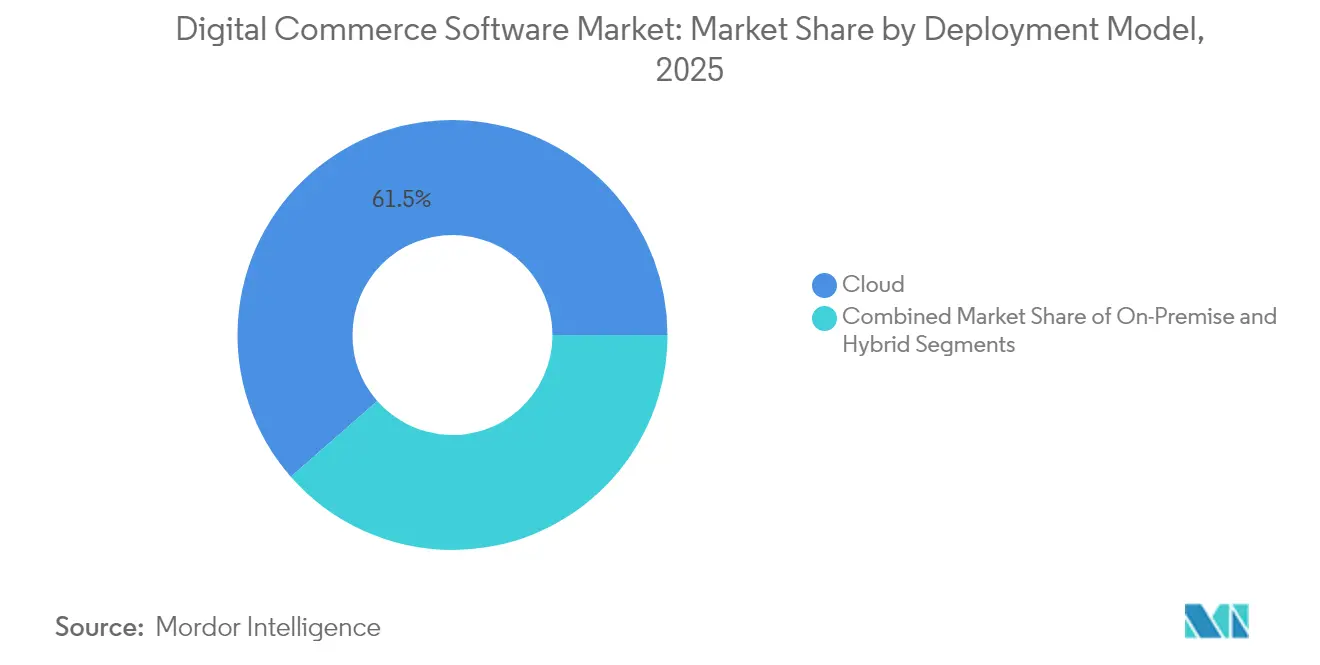
- By deployment model, cloud-based solutions held 61.45% of the digital commerce software market share in 2025, and the segment is set to expand at a 15.1% CAGR to 2031.
- By component, platform software dominated with 70.90% revenue share in 2025, while services are projected to post the fastest 15.7% CAGR through 2031.
- By business model, B2C captured 55.20% revenue share in 2025, yet marketplace platforms are forecast to record a 14.45% CAGR to 2031.
- By organization size, large enterprises accounted for 57.60% of the digital commerce software market size in 2025, but SMEs are projected to grow at 15.95% CAGR.
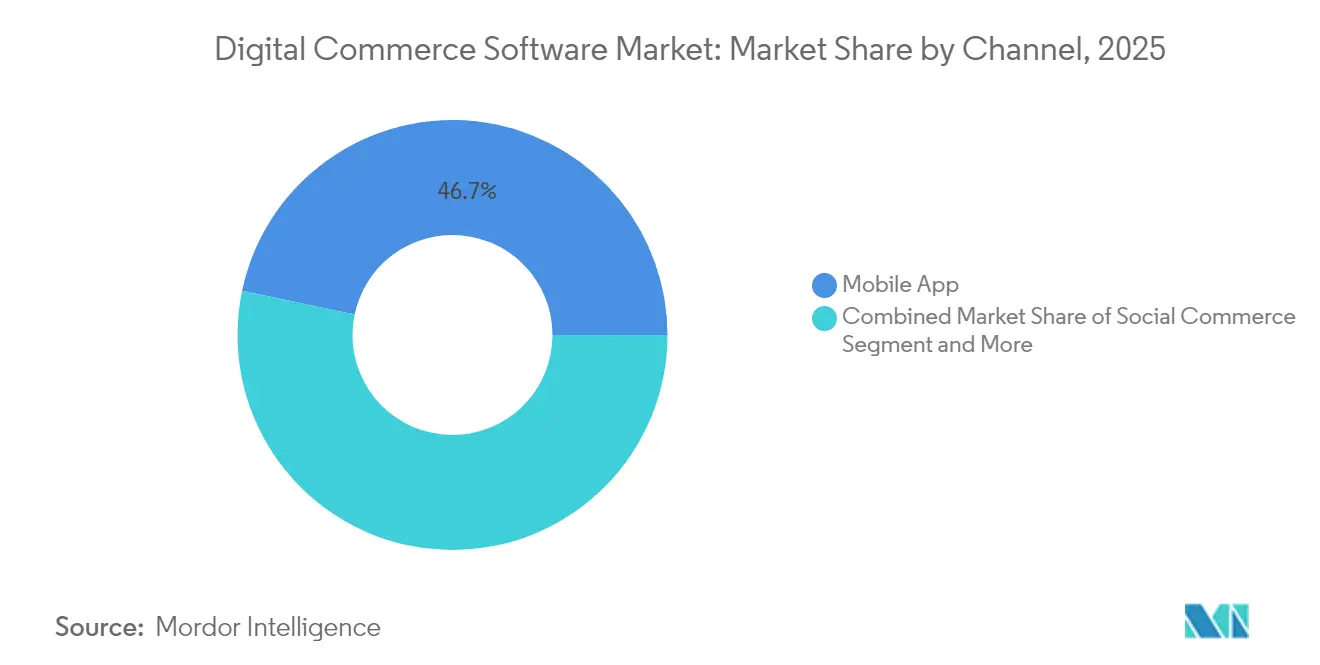
- By commerce channel, mobile applications delivered 46.70% of transaction value in 2025, while social commerce is advancing at a 16.05% CAGR through 2031.
- By end-user industry, retail and e-commerce led with 32.10% of the digital commerce software market size in 2025, whereas B2B applications are on track to achieve a 15.1% CAGR.
- By geography, North America contributed 34.95% revenue share in 2025, and Asia-Pacific is projected to post a 15.45% CAGR through 2031.
Note: Market size and forecast figures in this report are generated using Mordor Intelligence’s proprietary estimation framework, updated with the latest available data and insights as of 2026.
Global Digital Commerce Software Market Trends and Insights
Drivers Impact Analysis*
| Driver | (~) % Impact on CAGR Forecast | Geographic Relevance | Impact Timeline |
|---|---|---|---|
| Omnichannel shopping demand | +3.2% | Global (North America, Europe lead) | Medium term (2-4 years) |
| Rapid adoption of cloud-native SaaS commerce platforms | +4.1% | Global (APAC, North America) | Short term (≤ 2 years) |
| Mobile commerce and digital wallet proliferation | +2.8% | APAC core, Latin America and MEA spill-over | Short term (≤ 2 years) |
| Surge in subscription and digital-goods monetization | +1.9% | North America, Europe expanding to APAC | Medium term (2-4 years) |
| Shift toward composable and micro-services architecture | +1.7% | Global enterprise markets | Long term (≥ 4 years) |
| Rise of headless and API-first commerce | +1.5% | North America, Europe with early APAC uptake | Medium term (2-4 years) |
| Source: Mordor Intelligence | |||
Omnichannel Shopping Demand
Enterprises are rolling out unified commerce stacks to synchronise inventory, pricing, and customer profiles across touchpoints. Research shows that firms excelling in omnichannel retention keep 89% of their customers, far outperforming peers with weak strategies. Grocery, consumer electronics, and apparel chains now embed curb-side fulfilment, in-store kiosks, and click-to-collect options into one central order management layer. Manufacturers are likewise re-platforming to support self-service portals, shortening re-order cycles and raising order accuracy. These shifts are elevating expectations in B2B procurement, where buyers want the same friction-free experience found in consumer channels. Consequently, vendors that package pre-integrated POS, CRM, and loyalty modules are gaining traction among retailers pursuing experience-led growth.
Rapid Adoption of Cloud-Native SaaS Commerce Platforms
Cloud-first principles are reshaping the digital commerce software market as 90% of enterprises use cloud services in some form. Vendor-managed environments offer automated scaling, embedded analytics, and zero-downtime upgrades, allowing retailers to reduce operating costs by 40% and accelerate feature releases by 25%. Kubernetes, micro-services, and container orchestration underpin these gains, facilitating continuous integration pipelines. AWS, Microsoft Azure, and Google Cloud collectively support the bulk of new commerce launches, while managed databases such as MongoDB Atlas simplify DevOps tasks for storefronts built on frameworks like Vue Storefront. Financial services and insurance players are deploying hybrid architectures to meet data-sovereignty mandates without compromising elasticity.
Mobile Commerce and Digital Wallet Proliferation
Smartphones generated 76% of United States retail site visits in 2024 . Southeast Asia’s social commerce value is forecast to reach USD 42 billion in 2025 on the back of influencer-led discovery journeys. Digital wallets continue to outpace cards; Brazil’s Pix rails are projected to become the leading online payment method by 2025. Similar local schemes are reshaping checkout flows across Latin America, Africa, and the Middle East. Merchants optimising for one-click wallets and local methods report lower cart abandonment and higher repeat conversion. Payment gateways that bundle fraud screening and alternative payout channels are thus integral to platform selection.
Surge in Subscription and Digital-Goods Monetization
Recurring revenue models stretch beyond streaming to encompass industrial equipment, healthcare supplies, and B2B software. Commerce engines that embed catalogue-level pricing, usage metering, and automated renewals position brands to capture predictable cash flows. AI-driven recommendation engines raise upsell success by personalising bundle offers, while advanced account hierarchies handle complex approval workflows in corporate buying scenarios. Healthcare providers are adopting direct-to-consumer subscriptions for lab tests and telehealth packages, driving projected ecommerce revenue to USD 738.8 billion by 2028. Vendors that pre-integrate subscription management lower time-to-market for enterprises exploring new monetization paths.
Restraints Impact Analysis*
| Restraint | (~) % Impact on CAGR Forecast | Geographic Relevance | Impact Timeline |
|---|---|---|---|
| Escalating cybersecurity and data-privacy risks | -2.10% | Global with strict enforcement in Europe and North America | Short term (≤ 2 years) |
| Integration complexity with legacy ERP and POS stacks | -1.80% | Global, affecting large enterprises | Medium term (2–4 years) |
| Shortage of specialised commerce-platform developers | -1.50% | North America, Europe, APAC Tier-1 markets | Medium term (2–4 years) |
| Regulatory uncertainties around data residency and cross-border data flows | -1.20% | Europe, Middle East, APAC | Short to medium term (1–3 years) |
| Source: Mordor Intelligence | |||
Escalating Cybersecurity and Data-Privacy Risks
Retail breaches cost an average USD 4.88 million per incident and stricter regulations magnify penalties. The EU Digital Services Act subjects platforms to fines up to 6% of annual turnover when transparency, takedown, and advertising rules are breached. North American states are enlarging CCPA-style mandates, driving up compliance overheads. Executives have to embed privacy-by-design frameworks, conduct quarterly audits, and formalise data minimisation to sustain consumer trust. Cloud-native vendors respond with field-level encryption, tokenisation, and continuous compliance tooling, yet talent shortages in security operations prolong vulnerability windows. Merchants serving regions with low financial inclusion also face authentication challenges, increasing fraud exposure.
Integration Complexity with Legacy ERP and POS Stacks
Decades-old ERP, warehouse management, and point-of-sale platforms often lack modern APIs, complicating real-time inventory and pricing synchronisation. Large retailers must orchestrate hundreds of micro-services while ensuring uninterrupted checkout and fulfilment operations during cutovers. Custom middleware raises maintenance costs and slows new feature roll-outs. SMEs experience fewer integration headaches but still require pre-built connectors for accounting, CRM, and shipping management. Vendors promoting low-code integration, event-streaming, and canonical data models reduce complexity, though change-management challenges linger where internal skills favour monolithic systems.
*Our forecasts treat driver/restraint impacts as directional, not additive. The impact forecasts reflect baseline growth, mix effects, and variable interactions.
Segment Analysis
By Deployment Model: Cloud Dominance Accelerates
Cloud deployments accounted for 61.45% of the digital commerce software market share in 2025 and are on course for a 15.1% CAGR through 2031. This commanding position highlights the desire for instant scalability and vendor-managed security updates. The digital commerce software market size for cloud solutions is projected to more than double by 2031, mirroring investments in micro-services, serverless functions, and observability tooling. Enterprises migrating from on-premise suites report 40% lower total cost of ownership within two years.
Cost savings are not the sole driver. Business teams value speed, using sandbox environments to test new promotions in hours rather than quarters. Hybrid cloud is emerging in data-sensitive verticals such as insurance, where 73% of carriers retain some workloads on private stacks to meet sovereignty rules. Multi-cloud adoption at 89% underscores demand for vendor redundancy. These dynamics ensure that the digital commerce software market remains centred on cloud-native innovation.


By Component: Platform Software Leads Service Growth
Platform software secured 70.90% revenue share in 2025, yet services are climbing at a 15.7% CAGR as enterprises navigate composable adoption. Implementation partners bundle change management, data migration, and headless front-end builds, capturing spend that once flowed to internal IT. Integration services focus on mapping legacy ERP, PIM, and POS datasets to new commerce APIs.
Platform vendors still anchor purchasing discussions because transactional engines, catalogue, and checkout remain core. Differentiation now revolves around AI-powered merchandizing, native search, and low-code orchestration. Commercetools introduced machine-learning models that cleanse B2B product data and automate segment-level pricing. API-first designs cut implementation time, enabling clients to launch international storefronts within weeks, cementing platform software’s leadership in the digital commerce software market.
By Business Model: Marketplace Models Disrupt B2C Leadership
B2C held 55.20% revenue share in 2025; however marketplaces are forecast to outpace all other sub-segments at 14.45% CAGR. The digital commerce software market is responding to retailers that want third-party assortment without inventory risk. Enterprise clients deploy marketplace modules to widen SKU breadth and collect commission revenue. VTEX’s modular marketplace engine integrates native logistics and seller onboarding tools, reducing onboarding time from months to days.
B2B commerce adoption is converging with marketplace capability. Manufacturers activate dealer networks on shared platforms, turning wholesalers into sellers within branded portals. C2C growth rides on social media adoption and secure escrow payments. These intertwined models reinforce the flexibility required in the digital commerce software market.
By Organization Size: SME Growth Outpaces Enterprise Adoption
Large enterprises controlled 57.60% of digital commerce software market revenue in 2025, yet SMEs are scaling at a 15.95% CAGR. Pay-as-you-scale SaaS, pre-configured themes, and embedded payment gateways lower entry barriers. SMEs capture international customers without heavy capital expenditure, catalysing democratization across the digital commerce software market.
Corporate buyers remain influential due to integration demands. They require orchestration across ERP, finance, and warehouse management systems. Composable architectures allow phased migration, mitigating risk. Vendors offering modular pricing appeal to both cohorts, ensuring balanced contributions to the digital commerce software market size.
By Commerce Channel: Social Commerce Transforms Mobile Leadership
Mobile applications delivered 46.70% of 2025 transaction value, validating a shift to mobile-first design. Yet social commerce is forecast to climb at 16.05% CAGR, recasting channel hierarchies. United States social commerce sales are predicted to top USD 90 billion in 2025. Brands leverage TikTok Shop, Instagram Checkout, and Pinterest Catalogs to merge discovery with purchase. Conversational commerce via chat apps in APAC also gains share.
Voice commerce stands at USD 49.6 billion and may triple by 2030. AR-enabled try-ons spur consumer electronics and fashion conversions, adding experiential depth. This diversity ensures the digital commerce software market remains channel-agnostic, prioritising flexible APIs.
By End-User Industry: B2B Sectors Drive Digital Transformation
Retail and e-commerce sectors contributed 32.10% of revenue in 2025. However B2B verticals manufacturing, distribution, and healthcare are pacing growth with a 15.1% CAGR. Manufacturers employ self-service portals for re-ordering spare parts, lifting order accuracy and reducing overhead. Healthcare e-commerce is forecast to accelerate as telehealth subscriptions and prescription fulfilment migrate online, strengthening the digital commerce software market.
Financial services and telecommunications are embedding commerce modules into mobile apps, upselling value-added services. Travel operators utilise dynamic pricing engines to sell ancillaries. This proliferation of industry use cases confirms that the digital commerce software industry continues to broaden its relevance.
Geography Analysis
North America generated 34.95% of global revenue in 2025, led by cloud adoption, mature payment infrastructure, and a robust vendor ecosystem. Salesforce’s USD 8 billion acquisition of Informatica illustrates the region’s appetite for data-driven commerce stacks that blend AI with customer experience. Government procurement is also modernising; the U.S. Army launched an e-commerce-style marketplace in 2025 to streamline IT acquisition. Mobile commerce dominance combined with social-media-led discovery positions the United States as a test bed for new commerce models.
Europe maintains significant traction despite the compliance burden of the Digital Services Act. Enterprise buyers view privacy and sustainability as strategic differentiators, favouring vendors that provide granular consent management and carbon-tracking APIs. Composable architectures offer the modularity needed to localise tax and shipping logic across multiple jurisdictions, sustaining the digital commerce software market in Europe.
Asia-Pacific is the fastest-growing region at 15.45% CAGR through 2031. Smartphone penetration, super-app ecosystems, and real-time payment networks such as UPI and Pix underpin this rise. Japanese enterprises focus on outcome-oriented modules that quicken deployment cycles.Southeast Asian merchants interlace social commerce with influencer marketing, while Africa is witnessing payment alliances that unlock cross-border acceptance. Latin America’s digital commerce user base is on track to reach 418.9 million by 2029, aided by partnerships like Canva and EBANX that deliver local payment rails.


Competitive Landscape
The digital commerce software market remains moderately fragmented, with legacy suite providers vying against headless and composable specialists. Competitive advantage hinges on API maturity, integration depth, and ecosystem extensibility. Enterprise vendors pursue bolt-on acquisitions to fill capability gaps; Salesforce’s Informatica deal expands data governance and AI stewardship. Pure-plays penetrate vertical niches such as automotive retail and grocery, leveraging domain-specific micro-services.
Three strategic patterns dominate. First, platform consolidation via M&A enables breadth across content, commerce, and data layers. Second, vertical expansion allows pure-plays to embed industry compliance templates, reducing deployment risk. Third, developer-led headless entrants attract mid-market and SME adopters with rapid start-up times and transparent pricing. Technology roadmaps emphasise AI-powered personalisation, real-time inventory orchestration, and low-code workflow builders, reflecting the digital commerce software market’s shift toward outcome-based value propositions.
Vendor differentiation increasingly rests on total cost of ownership and time to value. Cloud-native architectures compress upgrade cycles, while extensive partner marketplaces widen solution reach. Ecosystem openness thus shapes market share trajectory as customers prioritise flexible roadmaps.
Digital Commerce Software Industry Leaders
Shopify
Adobe (Magento + Commerce)
Salesforce Commerce Cloud
SAP Commerce Cloud
BigCommerce
- *Disclaimer: Major Players sorted in no particular order

Recent Industry Developments
- May 2025: Salesforce signed a definitive agreement to acquire Informatica for about USD 8 billion to embed advanced data governance and integration within its commerce stack, aiming to shorten AI model training cycles and bolster single-view customer records.
- May 2025: Stord acquired Ware2Go to strengthen fulfilment orchestration, reflecting a horizontal expansion strategy that merges commerce execution with supply-chain visibility.
- April 2025: The U.S. Army Program Executive Office deployed the Product Lead Digital Market, replacing legacy procurement portals and signalling public-sector validation of marketplace architectures.
- February 2025: MTN Group Fintech partnered with Network International to issue cards across four African markets, extending digital wallet acceptance and stimulating transactions within the region’s nascent digital commerce software market.


Research Methodology Framework and Report Scope
Market Definitions and Key Coverage
Our study treats the digital commerce software market as all packaged or SaaS platforms that enable businesses to list products, orchestrate carts, process orders, and manage payments across web, mobile, social, voice, and emerging AR/VR touchpoints. Solutions span core storefront engines, headless and composable stacks, and allied order-management modules that ship with native analytics and API connectors. The 2025 baseline value of this market is USD 6.79 billion.
Scope exclusion: bespoke one-off builds coded entirely in-house by retailers are not counted.
Segmentation Overview
- By Deployment Model
- On-Premise
- Cloud-Based
- Hybrid
- By Component
- Platform / Software
- Services
- Implementation and Integration
- Managed Services
- Consulting / Advisory
- By Business Model
- B2C
- B2B
- Marketplace (B2B2C / C2C)
- By Organisation Size
- Large Enterprises
- Small and Medium-Sized Enterprises (SMEs)
- By Commerce Channel
- Web
- Mobile App
- Social Commerce
- Voice Commerce
- AR/VR Commerce
- By End-User Industry
- Retail and E-commerce
- BFSI
- Travel and Hospitality
- IT and Telecommunications
- Media and Entertainment
- Manufacturing
- Healthcare and Pharmaceuticals
- Other End-User Industry
- By Geography
- North America
- United States
- Canada
- Mexico
- South America
- Brazil
- Argentina
- Rest of South America
- Europe
- Germany
- United Kingdom
- France
- Italy
- Spain
- Russia
- Rest of Europe
- Asia Pacific
- China
- Japan
- India
- South Korea
- Southeast Asia
- Australia and New Zealand
- Rest of Asia Pacific
- Middle East and Africa
- Middle East
- Saudi Arabia
- United Arab Emirates
- Turkey
- Rest of Middle East
- Africa
- South Africa
- Nigeria
- Kenya
- Rest of Africa
- Middle East
- North America
Detailed Research Methodology and Data Validation
Primary Research
Mordor analysts interviewed platform architects, system integrators, mid-market retailers, and regional payment-gateway managers across North America, Europe, and APAC. These conversations clarified average selling price bands, uptake of composable architectures among SMEs, and the likely timeline for Gen-AI assisted merchandising tools, closing gaps left by fragmented secondary data.
Desk Research
We compiled macro and micro data from open datasets such as UNCTAD e-commerce readiness indexes, the US Census Bureau's quarterly e-retail series, Eurostat's Digital Economy statistics, and ITU internet-user penetration tables, together with patent analytics from Questel and shipment records from Volza for cross-border software exports. Company 10-Ks, investor decks, and trade association releases (for example, Retail Industry Leaders Association) further anchored pricing and deployment trends. These sources formed the factual spine; still, many additional public records were scanned to refine metrics and validate anomalies.
Market-Sizing & Forecasting
A top-down demand-pool model converts retail and B2B online-sales pools into software spend using channel-specific penetration ratios, basket sizes, and vendor ASP benchmarks. Selective bottom-up checks, such as revenue roll-ups from public vendors and sampled license counts from Marklines-style shipment trackers, calibrate totals before finalization. Key variables modeled include online retail GMV, SME digital adoption rates, payment-gateway fee compression, cloud IaaS price curves, regulatory data-protection milestones, and headless-commerce deployment share. Multivariate regression, augmented by scenario analysis around macro cycles, drives the 2025-2030 forecast, with missing regional datapoints imputed through correlated indicators like broadband density and card-not-present volumes.
Data Validation & Update Cycle
Outputs pass three-layer reviews: cross-tab variance scans, peer analyst audits, and senior sign-off. The model refreshes annually; yet, trigger events (major M&A, regulatory shifts, material earnings surprises) prompt interim revisions so clients receive a current, balanced view.
Why Mordor's Digital Commerce Software Baseline Stands Reliable
Published numbers often diverge because firms stretch or shrink scope, apply uneven ASP ladders, or project growth on stale adoption curves.
Key gap drivers center on whether marketplaces and order-management modules are included, the aggressiveness of cloud cost pass-through assumptions, and the cadence at which mobile-commerce multipliers are updated. Mordor's disciplined scope, annual refresh, and dual-check model keep estimates tightly moored to observable variables, whereas others lean on broader e-commerce revenue pools or optimistic vendor roadmaps.
Benchmark comparison
| Market Size | Anonymized source | Primary gap driver |
|---|---|---|
| USD 6.79 B (2025) | Mordor Intelligence | - |
| USD 9.40 B (2024) | Global Consultancy A | Bundles digital-commerce services and POS terminals, inflating base value |
| USD 8.20 B (2024) | Trade Journal B | Assumes uniform 81 % cloud penetration globally and applies single ASP across tiers |
In sum, Mordor's stepwise modeling, lean yet targeted primary outreach, and clear segment boundaries yield a dependable, decision-ready baseline that managers can retrace to tangible drivers and replicate with publicly verifiable data.


Key Questions Answered in the Report
What is the projected growth rate of the digital commerce software market to 2031?
The market is expected to post a 14.05% CAGR, expanding from USD 6.79 billion in 2025 to USD 14.94 billion by 2031 over 2026-2031.
Which deployment model holds the largest share of the digital commerce software market?
Cloud-based deployment accounts for 61.45% market share in 2025 and remains the fastest-growing model.
Why are marketplace platforms gaining momentum within digital commerce?
Marketplaces let enterprises add third-party inventory without owning stock, driving a 14.45% CAGR by reducing assortment risk and boosting commission revenue through 2031.
Which region presents the highest growth potential through 2031?
Asia-Pacific is projected to achieve a 15.45% CAGR due to mobile-first consumer behaviour and expanding real-time payment rails through 2031.
How are SMEs benefiting from modern commerce platforms?
SaaS and composable architectures give SMEs enterprise-grade functions with lower upfront costs, supporting a 15.95% CAGR in SME adoption.
Page last updated on:


