Finite Element Analysis Software Market Size and Share
Market Overview
| Study Period | 2020 - 2031 |
|---|---|
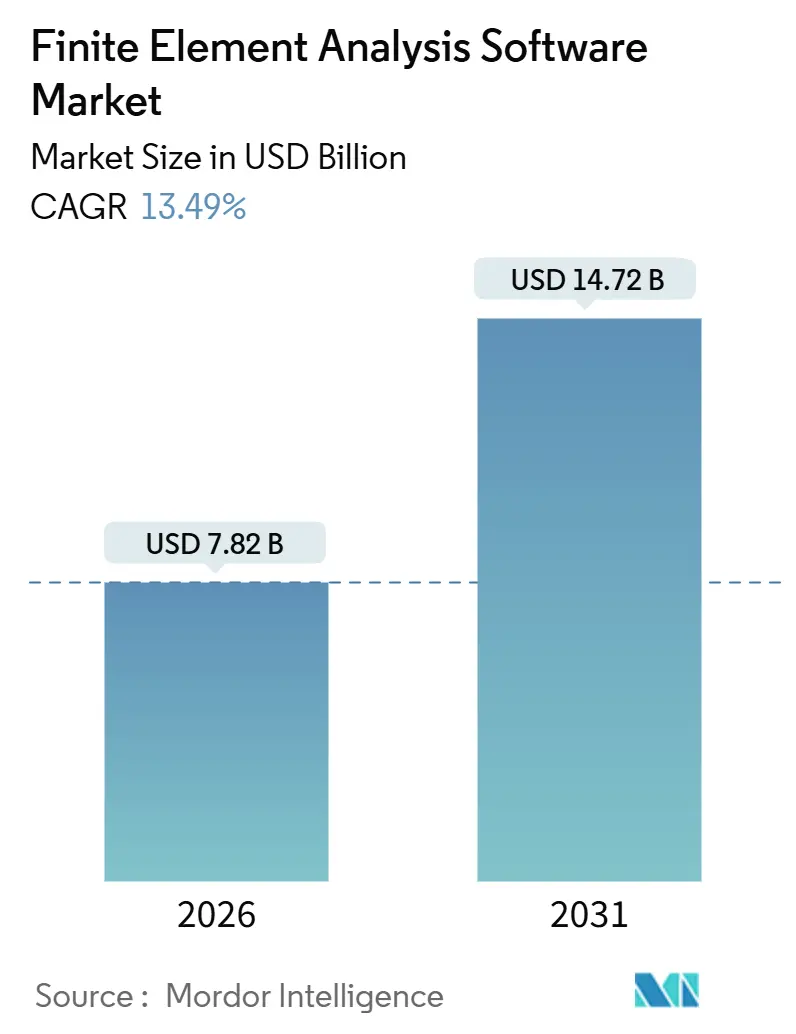
| Market Size (2026) | USD 7.82 Billion |
| Market Size (2031) | USD 14.72 Billion |
| Growth Rate (2026 - 2031) | 13.49% CAGR |
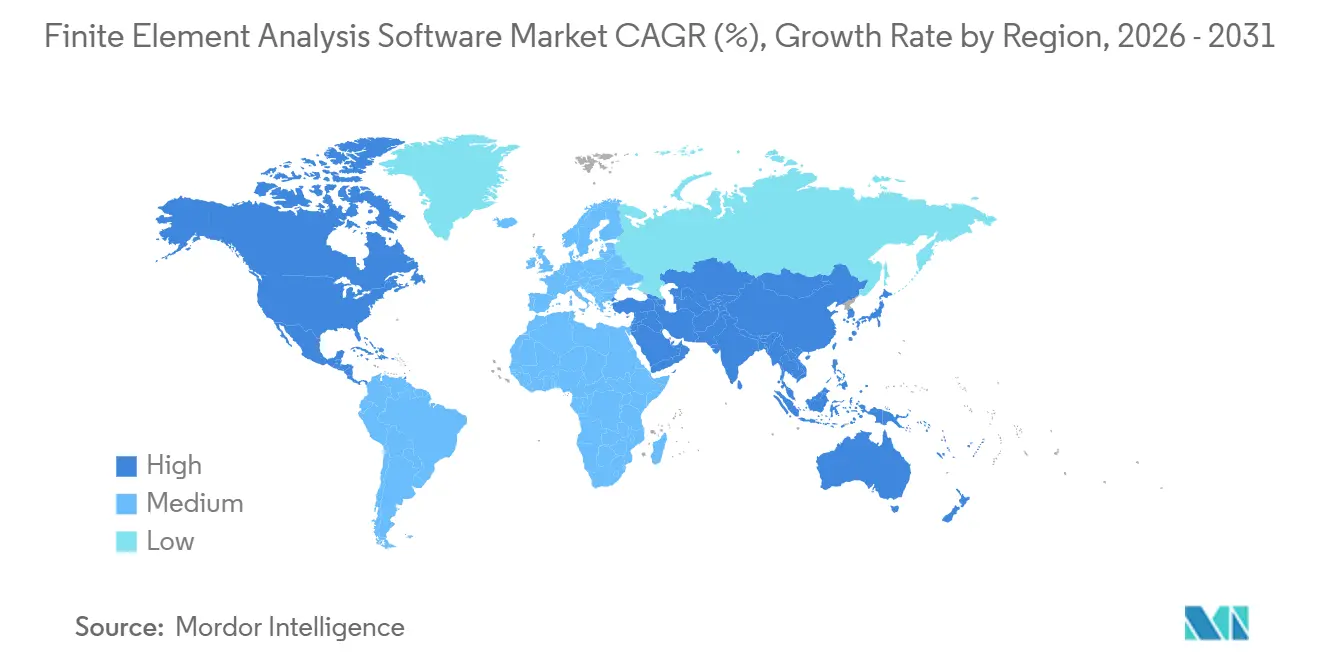
| Fastest Growing Market | Asia Pacific |
| Largest Market | North America |
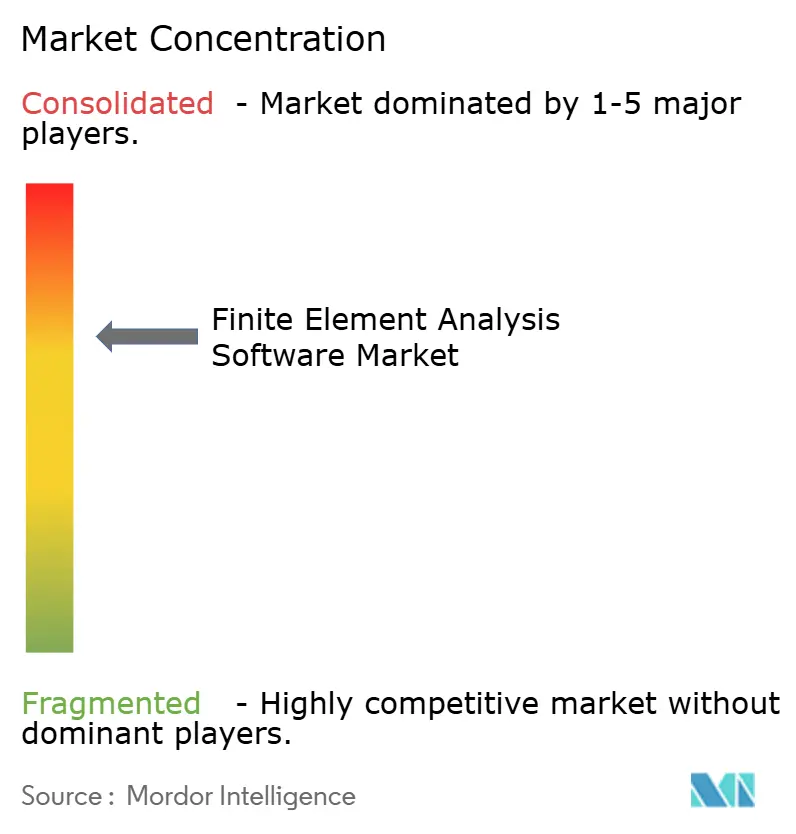
| Market Concentration | Medium |
Major Players *Disclaimer: Major Players sorted in no particular order Image © Mordor Intelligence. Reuse requires attribution under CC BY 4.0. | |
Finite Element Analysis Software Market Analysis by Mordor Intelligence
The Finite Element Analysis Software market is valued at USD 7.82 billion in 2026 and is projected to reach USD 14.72 billion by 2031, growing at a 13.49% CAGR, indicating both the current market size and future trajectory. Simulation vendors are embedding generative artificial intelligence into core solvers, enabling entry-level engineers to generate valid meshes and load cases in minutes rather than hours, compressing design loops for automotive, aerospace, and semiconductor programs. Cloud deployment is altering purchasing behaviors because pay-per-core-hour pricing removes the USD 2-5 million hardware commitment that once limited access for small and medium enterprises. Thermal analysis demand continues to rise as lithium-ion battery packs, 2-nanometer chips, and liquid-cooled data centers push the limits of heat transfer that cannot be managed with spreadsheets or handbook equations. Regionally, North America accounts for the largest share due to deep aerospace spending and a mature semiconductor base, while Asia-Pacific records the fastest revenue growth as electric-vehicle supply chains and outsourced engineering services scale. Competitive intensity remains moderate because the top five vendors hold about 60% of revenue but must still fend off nimble SaaS entrants that undercut legacy license models with browser-based workflows.
Key Report Takeaways
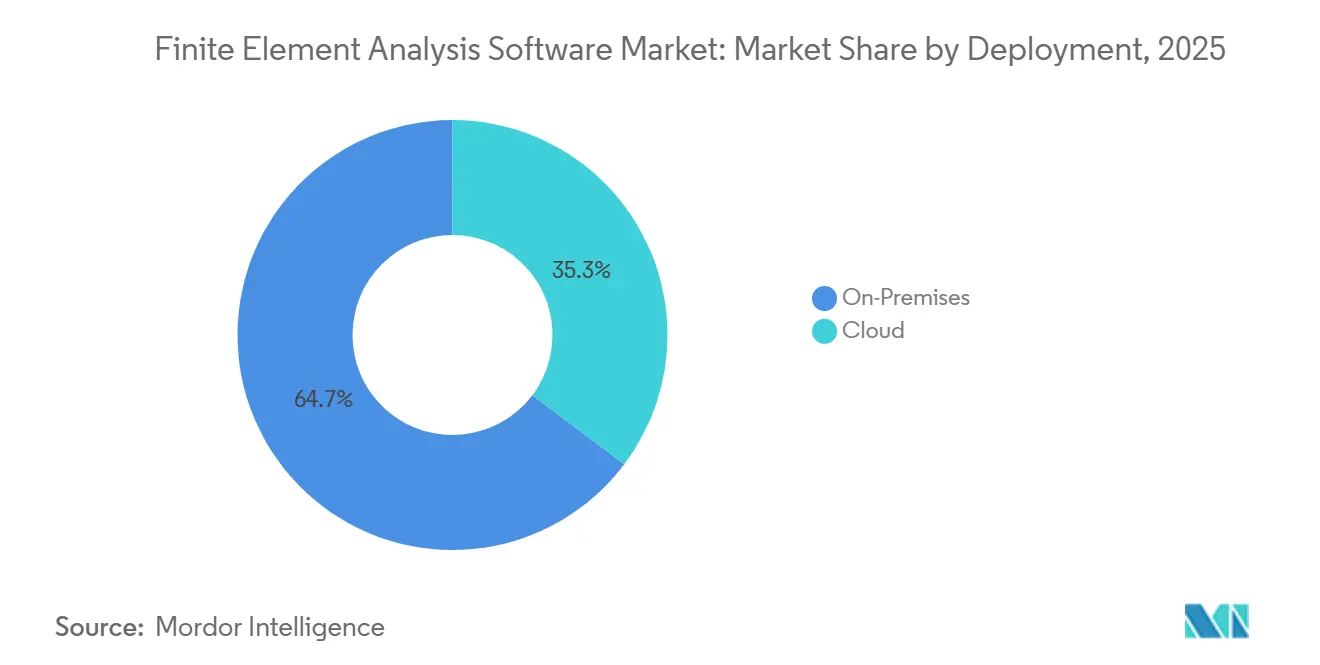
- By deployment, on-premise installations held 64.73% revenue share in 2025, while cloud-based platforms are forecast to grow at a 15.11% CAGR through 2031.
- By organization, large enterprises held 68.62% revenue share in 2025, while small and medium enterprises are forecast to grow at a 15.33% CAGR through 2031.
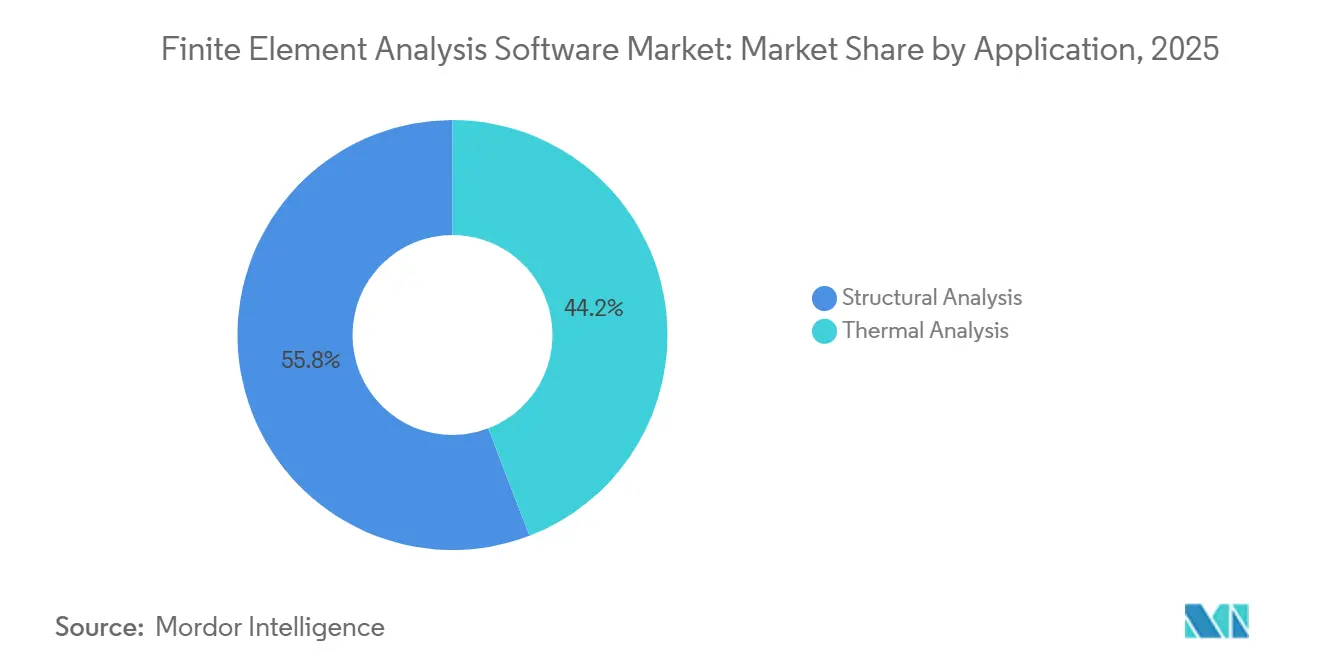
- By application, structural analysis claimed 55.83% of Finite Element Analysis Software market share in 2025; thermal analysis is advancing at a 14.76% CAGR through 2031.
- By end user, the automotive sector led with 35.72% revenue share in 2025; technology hardware and software is projected to expand at a 14.55% CAGR to 2031.
- By geography, North America generated 38.74% of 2025 revenue; Asia-Pacific is poised to record a 14.34% CAGR through 2031.
Note: Market size and forecast figures in this report are generated using Mordor Intelligence’s proprietary estimation framework, updated with the latest available data and insights as of January 2026.
Global Finite Element Analysis Software Market Trends and Insights
Drivers Impact Analysis*
| Driver | (~) % Impact on CAGR Forecast | Geographic Relevance | Impact Timeline |
|---|---|---|---|
| Generative-AI-Driven Optimization Loops in CAE | +3.2% | Global with early adoption in North America and Europe | Medium term (2-4 years) |
| Software-Centric E-Mobility R&D Needs | +2.8% | Asia-Pacific core, spillover to North America and Europe | Short term (≤ 2 years) |
| Surging Demand for Digital Twins in Process Industries | +2.4% | North America, Europe, Middle East | Medium term (2-4 years) |
| Aerospace Lightweighting Mandates | +1.9% | North America and Europe with limited Asia-Pacific uptake | Long term (≥ 4 years) |
| Shorter IC Design Cycles in Semiconductor Fabs | +1.7% | Asia-Pacific (Taiwan, South Korea), North America | Short term (≤ 2 years) |
| Edge-Deployed FEA for Real-Time Structural Health Monitoring | +1.1% | Global with pilot programs in North America and Europe | Long term (≥ 4 years) |
| Source: Mordor Intelligence | |||
Generative-AI-Driven Optimization Loops In CAE
Surrogate modeling now predicts stress distributions within 95% of full-solver accuracy, cutting runtime by 80% and allowing design teams to evaluate thousands of variants before committing to detailed analysis. Altair’s lattice-generation module produced a 30% lighter A350 cabin bracket that passed damage-tolerance requirements, proving the commercial value of AI-assisted topology tools. Patents filed in 2024 reveal GPU-accelerated mesh-generation algorithms that shrink preprocessing time from hours to minutes. Regulatory agencies have yet to codify certification paths for AI-generated geometries, so firms often pair algorithmic proposals with human review to satisfy aviation and medical-device auditors. As compute costs decline and neural-network training pipelines become turnkey, AI-driven optimization is morphing from a premium differentiator into a table-stakes capability expected by most customers in the Finite Element Analysis Software market.
Software-Centric E-Mobility Research And Development Needs
Eight of the top ten battery manufacturers now run conjugate heat-transfer simulations to keep cell temperature spread within ±2 °C under 4 °C fast-charging, a prerequisite for warranty programs that pledge 10-year life. Simcenter Battery Design Studio reduced prototype sets from 12 to 3 for a Tier-1 supplier developing an 800-volt pack, saving USD 4.5 million in tooling and accelerating the program launch by 3 months. Altair FEKO located electromagnetic-interference hotspots that would have violated FCC Part 15 during a 2024 German EV launch, eliminating a six-month homologation delay.[1]“HyperWorks 2025.1 Release Notes,” Altair Engineering, altair.com The Asia-Pacific region accounts for 60% of global EV battery output, and domestic producers employ hundreds of simulation engineers to comply with safety and thermal-management standards. Coupled electro-thermal-structural solvers therefore occupy a growing slice of the Finite Element Analysis Software market.
Surging Demand For Digital Twins In Process Industries
Linking vibration-sensor feeds to FEA modal signatures lowered turbine downtime by 18% at a Middle East refinery, saving USD 12 million per year and underscoring the quick payback on real-time structural twins. A single day of offshore platform outage costs roughly USD 500,000, so operators adopt edge-deployed solvers that project crack growth and trigger inspections only when fracture-mechanics limits approach critical thresholds. ISO 23247 establishes interface protocols for twin components, pressuring vendors to open APIs and promoting multivendor ecosystems.[2]“ISO 23247 Digital-Twin Framework,” International Organization for Standardization, iso.org Energy and chemical plants can extend asset life by 15% when predictive twins inform condition-based maintenance scheduling, expanding the Finite Element Analysis Software market beyond new-build projects into brownfield retrofits. As cloud pricing falls and sensor retrofits proliferate, digital-twin deployments will increasingly bundle structural and thermal FEA within broader operational dashboards.
Aerospace Lightweighting Mandates
An additively manufactured titanium fuel separator certified for the A330 achieved 55% weight reduction and passed bird-strike and fatigue tests using MSC Nastran as the primary compliance tool. GPU-accelerated solvers now deliver explicit-dynamics results 10 times faster, enabling composite design teams to iterate laminate schedules within program milestones. Cryogenic hydrogen tanks under the FlyZero initiative required 15,000 simulations to balance thermal conductivity and stiffness, work that was feasible only after offloading the solver to passive-cooling GPUs. Boeing noted in a 2024 investor briefing that composite fuselages consume 30% more simulation hours than metallic ones, driving additional license procurement for nonlinear modules. EASA policy memos clarify that AI-generated lattice structures must still pass building-block testing, thereby maintaining FEA's central role in probabilistic design assurance for aerospace structures.
Restraints Impact Analysis*
| Restraint | (~) % Impact on CAGR Forecast | Geographic Relevance | Impact Timeline |
|---|---|---|---|
| Steep License Pricing and Vendor Lock-In | -1.8% | Global, acute in cost-sensitive SME segments | Short term (≤ 2 years) |
| Shortage of Domain-Specific CAE Talent | -1.4% | Global, severe in Asia-Pacific and emerging markets | Medium term (2-4 years) |
| GPU Supply Volatility for Solver Acceleration | -0.9% | Global, concentrated in North America and Europe HPC deployments | Short term (≤ 2 years) |
| Inconsistent Open-Source Solver Validation in Regulated Verticals | -0.6% | North America and Europe, limited impact in Asia-Pacific | Long term (≥ 4 years) |
| Source: Mordor Intelligence | |||
Steep Licence Pricing And Vendor Lock-In
Enterprise seats cost USD 30,000–150,000 each and carry annual maintenance fees exceeding 18%, a barrier that excludes roughly 70% of firms employing fewer than fifty engineers. Fusion 360 Simulation’s move to subscription-only licensing prompted 38% of surveyed users to explore open-source options like CalculiX, revealing latent price sensitivity. Proprietary decks and scripts deter migration; one aerospace supplier estimated that converting a decade of Nastran decks to Ansys formats would take 18 months of senior engineer time. SimScale’s freemium plan added 15,000 new users by offering unlimited public projects and USD 3,500 yearly private plans, proving appetite for low-cost entry into the Finite Element Analysis Software market. Vendors that decouple solver access from perpetual seats via consumption billing alleviate sticker shock but must manage revenue variability.
Shortage Of Domain-Specific CAE Talent
IEEE estimates that 25% of U.S. CAE job openings remain vacant for more than six months, with thermal-analysis specialists in particularly short supply.[3]“CAE Skills Gap Analysis,” IEEE Standards Association, ieee.org Support data show that 60% of help-desk tickets stem from incorrect boundary conditions rather than software defects, underlining the expertise gap. NAFEMS reported that fewer than 5,000 engineers worldwide can competently run conjugate heat-transfer plus phase-change problems, a skill set in escalating demand for battery and data-center projects. General Motors addressed the issue by graduating 200 internal analysts through a twelve-week bootcamp that cut outsourced consulting spend by 30%. Siemens donated academic licenses to IIT Madras as part of an initiative to produce 5,000 simulation-literate graduates by 2027, yet the pipeline still lags behind the Finite Element Analysis Software market's hiring needs.
*Our forecasts treat driver/restraint impacts as directional, not additive. The impact forecasts reflect baseline growth, mix effects, and variable interactions.
Segment Analysis
By Deployment: Cloud Broadens Access While On-Premise Retains Sensitive Workloads
The Finite Element Analysis Software market size for on-premise solutions was fortified by a 64.73% revenue share in 2025 as aerospace and defense contractors retained ITAR-controlled geometries on in-house clusters. Cloud revenue, however, is forecast to grow at a 15.11% CAGR through 2031 as pay-per-use models remove seven-figure hardware outlays and automate scaling to 10,000 cores for transient blast or drop scenarios. Altair’s PBS Works orchestrator lets a Japanese automaker route routine parametric study to AWS yet keep crash simulations local, demonstrating hybrid workflows that comply with internal policy while containing cost. The European Data Act requires simulation outputs linked to EU citizen data to stay inside regional clouds, prompting vendors to open Frankfurt, Amsterdam, and Paris zones dedicated to FEA workloads. On-premise is still cheaper at high utilization, so firms with continuous crash pipelines retain clusters, while episodic users favor cloud as a variable operating expense.
Consumption billing in Dassault’s SIMULIA lowered entry cost by 60% for episodic users, yet the vendor now manages monthly revenue volatility tied to customer project schedules. Browser-based platforms require no local installation, letting student users gain immediate proficiency, a key demand-generation vector for future Finite Element Analysis Software market sales. Service bureaus now resell reserved cloud nodes to SMEs at a markup, providing elastic compute without heavy capex. Vendors that automate encryption keys, region locking, and job-scrubbing routines will appeal to regulated sectors, whereas pure public-cloud plays risk disqualification under data-sovereignty clauses.


By Organisation Size: Subscription Models Propel Small And Medium Enterprise Adoption
Large enterprises still commanded 68.62% of revenue in 2025 owing to broad physics needs and the capital to maintain clusters and staff. Yet SMEs are projected to grow at a 15.33% CAGR as USD 3,000–15,000 yearly plans bundle solver seats, cloud credits, and onboarding services. For a sheet-metal supplier, a USD 5,000 subscription replaces a USD 15,000 prototype rework, yielding a three-month payback that rationalizes budget allocation. Tier-2 automotive suppliers are now contractually obliged to submit FEA validation per OEM quality manuals, effectively making simulation a price of entry to global supply chains. Vendors provide 40 hours of application-engineering assistance inside annual bundles to offset the SME skills gap.
AI-guided wizards lower the knowledge threshold for linear static problems, but nonlinear crash or fatigue remains the domain of seasoned specialists, so SMEs often blend internal analyses with consulting services. Browser-based interfaces streamline guided workflows, reducing training cycles for new hires who already expect cloud-native tools. Cost spikes during peak project periods remain a risk; SMEs sometimes cap monthly cloud spend to remain within cash constraints. Overall, as price barriers fade, SMEs will increasingly represent the incremental revenue driver in the Finite Element Analysis Software market.
By Application: Accelerated Growth In Thermal Analysis
Structural analysis retained 55.83% Finite Element Analysis Software market share in 2025 because crashworthiness and static-strength validation steps remain mandated for automotive and aerospace compliance. Thermal analysis, however, posts the fastest 14.76% CAGR through 2031, reflecting heat-management imperatives as batteries, CPUs, and GPUs push power densities above 250 W/cm². The Finite Element Analysis Software market size attached to thermal modules therefore expands far faster than any other application category, buoyed by battery-pack designs that require cell-to-cell temperature spread under 5 °C. Semiconductor fabs invest in coupled electro-thermal solutions to avoid USD 10 million mask-set respins, paying premiums for sunrise modules like 3DIC thermal stress. Data-center operators employ multiphase immersion-cooling models to support hyperscale AI clusters, which fuels solver upgrades that handle millions of elements efficiently on GPU nodes.
Structural workflows evolve slowly, emphasizing mesh-reuse templates and correlation with established crash sleds, so year-over-year license expansion is incremental. Thermal modeling sits at a dynamic frontier; solid-state battery programs, hydrogen fuel cells, and cryogenic space-flight tanks all demand new physics couplings, spurring multi-module purchases. Vendors with GPU-optimized thermal solvers and AI-assisted mesh refinement differentiate on solution time, a key buying factor as product cycles compress. The result is a mix shift toward thermal licenses, especially across Asia-Pacific where chip makers and consumer-electronics OEMs dominate demand.
By End User: Technology Hardware And Software Sectors Outpace Automotive
Automotive owned 35.72% of 2025 revenue on mandated crash and durability simulations, yet tech hardware and software is slated for a 14.55% CAGR to 2031 as smartphone, laptop, and server products iterate multiple times each year. A single flagship phone involves over 200 drop-test simulations to certify against IEC 60068 standards, a workload incompatible with legacy prototype-heavy processes. Hyperscale operators model liquid-cooling manifolds to sustain GPU racks that power generative-AI workloads, making thermal FEA a gating step in data-center expansion plans. Semiconductor designers deploy coupled electrical-thermal-mechanical simulations to predict package warpage and stress, paying annual subscription fees upward of USD 500,000 for leading-edge 3DIC tools.
Aerospace and defense account for 22% of revenue, with growth tempered by long project cycles and budget swings tied to public-sector procurement. Construction and architecture contribute 8%, driven by seismic-rating requirements as BIM platforms embed quick-check structural solvers. Energy producers pivot from offshore platform models to hydrogen pipeline embrittlement and wind-turbine blade fatigue, maintaining a steady 10% slice of the Finite Element Analysis Software market. Technology hardware growth concentrates in Asia-Pacific, where Taiwan, South Korea, and China scale fabs and consumer-electronics lines, creating sustained demand for quick-turn multiphysics validation, thereby lifting overall Finite Element Analysis Software market revenue.
Geography Analysis
North America retained 38.74% of revenue in 2025 thanks to aerospace primes, Detroit automakers, and Arizona and Texas fabs that embed FEA in every design phase. The region hosts sovereign clouds capable of running ITAR workloads, which encourages cloud migration even for defense programs. Europe followed with 28%, anchored by German OEMs and Airbus composite wings, yet energy-price pressures and talent shortages slow expansion.
Asia-Pacific is projected to post a 14.34% CAGR through 2031 as China produced 9.5 million EVs in 2024, each requiring 500-plus hours of thermal and electromagnetic analysis. India’s engineering-services firms grew simulation revenue to USD 14 billion in 2025, operating hybrid clusters that serve global OEMs round-the-clock. Vendors opened R&D hubs in Bangalore and Shanghai to localize language support and features tuned to domestic standards, thereby strengthening regional sales pipelines.
South America and the Middle East and Africa together contributed 10% of revenue, with Brazilian aerospace, Saudi petrochemical, and South African mining projects driving high-value nonlinear licenses. Large-scale infrastructure and energy diversification projects require fatigue-life and thermal-stress simulations, ensuring ongoing, but moderate, traction in the Finite Element Analysis Software market. Future growth depends on political stability, capital-investment cycles, and the adoption of digital-twin maintenance models in these regions.

Competitive Landscape
The Finite Element Analysis Software market remains moderately concentrated, with Ansys, Dassault Systèmes, Siemens, Altair, and Autodesk controlling around 60% of revenue. Ansys differentiates through 40+ physics modules and an AI-assisted setup that reduces modeling time by 40% for novice users. Siemens integrates Simcenter solvers with its PLM backbone and NVIDIA Omniverse to offer real-time physics visualization inside collaborative reviews. Dassault wraps SOLIDWORKS, Simulia, and ENOVIA inside a single SaaS shell aimed at SMEs reluctant to juggle multiple file formats.
Altair invests heavily in GPU acceleration, achieving a 10× OptiStruct speed-up on NVIDIA H100 hardware in 2024, which appeals to customers lacking large CPU clusters. Autodesk pursues volume through low-priced subscriptions that trade breadth for quick uptake among hobbyists and small job shops.
Browser-based challengers like SimScale and OnScale grow by offering freemium models, while Hexagon integrates CAM workflows to deliver a unified design-to-manufacturing toolchain, a direct challenge to Siemens NX-Simcenter. GPU shortages and the domain-talent gap remain universal risks, but firms that script AI-based preprocessors and open data-exchange APIs are best positioned to expand their share in the Finite Element Analysis Software market.
Finite Element Analysis Software Industry Leaders
Ansys Inc.
Autodesk Inc.
Bentley Systems Inc.
Altair Engineering Inc.
Synopsys, Inc.
- *Disclaimer: Major Players sorted in no particular order

Recent Industry Developments
- January 2026: Ansys launched the 2026 R1 platform delivering 15× GPU speed-up for transient thermal analysis and expanding SimAI coverage to nonlinear contact problems.
- December 2025: Siemens partnered with NVIDIA to blend Simcenter solvers into Omniverse, allowing photorealistic digital-twin reviews that cut design-review cycle time by 30%.
- November 2025: Dassault Systèmes rolled out 3DEXPERIENCE Works bundles at USD 8,500 annually, capturing 12% of the SME simulation segment within six months.
- October 2025: Altair announced a USD 25 million Singapore cloud center to serve Southeast Asian automotive and electronics accounts under strict data-residency rules.


Research Methodology Framework and Report Scope
Market Definitions and Key Coverage
Our study defines the finite element analysis (FEA) software market as all paid licenses and subscriptions for linear or nonlinear solvers that discretize solid, fluid, or coupled physics into finite elements, together with the bundled pre-/post-processing tools that integrate with computer-aided design or product-lifecycle platforms. We track revenue from new seats, renewals, and pay-as-you-go cloud hours that engineering teams purchase across manufacturing and infrastructure domains.
Scope exclusion: stand-alone multiphysics engines sold only with high-performance compute hardware or pure consulting projects are outside this scope.
Segmentation Overview
- By Deployment
- On-Premise
- Cloud
- By Organisation Size
- Small and Medium Enterprises
- Large Enterprises
- By Application
- Structural Analysis
- Thermal Analysis
- By End User
- Automotive
- Aerospace and Defence
- Construction and Architecture
- Electrical and Electronics
- Oil, Gas and Energy
- Technology Hardware and Software
- Other End Users
- By Geography
- North America
- United States
- Canada
- Mexico
- South America
- Brazil
- Argentina
- Rest of South America
- Europe
- Germany
- United Kingdom
- France
- Italy
- Spain
- Rest of Europe
- Asia-Pacific
- China
- India
- Japan
- South Korea
- Australia and New Zealand
- Rest of Asia-Pacific
- Middle East
- Saudi Arabia
- United Arab Emirates
- Turkey
- Rest of Middle East
- Africa
- South Africa
- Nigeria
- Egypt
- Rest of Africa
- North America
Detailed Research Methodology and Data Validation
Primary Research
We spoke with CAE product managers, cloud-platform architects, Tier-1 automotive design leads, and independent simulation consultants in North America, Europe, and Asia. Their input validated license penetration, cloud-hour utilization, and vertical adoption curves, plugging gaps left by desk research and sharpening critical assumptions.
Desk Research
We started by mapping publicly available data. Authoritative sources such as NIST digital-engineering datasets, Eurostat R&D expenditure tables, World Semiconductor Trade Statistics, NAFEMS technical papers, and customs export codes for engineering software provided baseline volumes and average prices. Annual reports, SEC 10-Ks, and investor presentations revealed vendor-level revenue splits and seat migration trends, while our paid access to D&B Hoovers and Dow Jones Factiva supplied acquisition histories and regional breakouts. The sources noted are illustrative; many additional open databases and trade publications informed our work.
Market-Sizing & Forecasting
A top-down seat-universe model derived from engineering headcount and design-software penetration by vertical was corroborated with supplier roll-ups of disclosed software revenue. Key variables like global R&D intensity, electric-vehicle production volumes, typical solver price per seat, cloud GPU-hour tariffs, and regional PMI trends drive annual demand. Multivariate regression links these inputs, and selective bottom-up checks (sampled ASP × volume) fine-tune totals. Where granular data were thin, we blended analogs from adjacent CAE tools and smoothed anomalies through peer-weighted averages.
Data Validation & Update Cycle
Outputs pass automatic variance alerts, senior-analyst peer review, and a final pre-publication refresh. Models are rebuilt every year, with interim updates triggered by major vendor M&A, material price shifts, or regulatory changes, ensuring clients always receive our latest view.
Why Mordor's Finite Element Analysis Software Baseline Earns Trust
Published estimates often diverge because firms mix different components, apply varied price multipliers, or refresh at uneven intervals. By locking scope early, refreshing annually, and stress-testing every assumption, we give decision-makers a consistent yardstick.
Key gap drivers include some publishers folding simulation consulting into software totals, others omitting cloud consumption, and a few extrapolating legacy CAGRs without adjusting for currency swings or mega-acquisitions.
Benchmark comparison
| Market Size | Anonymized source | Primary gap driver |
|---|---|---|
| USD 6.89 B (2025) | Mordor Intelligence | |
| USD 6.18 B (2024) | Regional Consultancy A | Includes services revenue and overlaps CFD solvers |
| USD 4.79 B (2024) | Trade Journal B | Excludes cloud usage; linear growth from 2021 base |
| USD 7.81 B (2025) | Global Consultancy C | Bundles simulation hardware and applies aggressive price inflation |
The comparison shows Mordor's figure sits mid-range, anchored to transparent seat counts and verifiable pricing, delivering a dependable baseline clients can replicate with limited effort.


Key Questions Answered in the Report
How fast is the Finite Element Analysis Software market expected to grow through 2031?
The market is forecast to expand from USD 7.82 billion in 2026 to USD 14.72 billion by 2031 at a 13.49% CAGR.
Which application will see the quickest revenue increase?
Thermal analysis displays the fastest 14.76% CAGR thanks to battery safety, semiconductor cooling, and data-center liquid cooling needs.
Why are SMEs adopting Finite Element Analysis Software more rapidly now?
Pay-per-use cloud pricing, lower subscription levels, and bundled onboarding services remove capital and talent barriers that previously prevented adoption.
What is driving Asia-Pacific to become the fastest-growing region?
The region benefits from high EV production volumes, expanding semiconductor fabs, and a growing engineering-services workforce, driving a 14.34% CAGR.
Page last updated on:


