
Multichannel Order Management Market Size and Share
Market Overview
| Study Period | 2020 - 2031 |
|---|---|
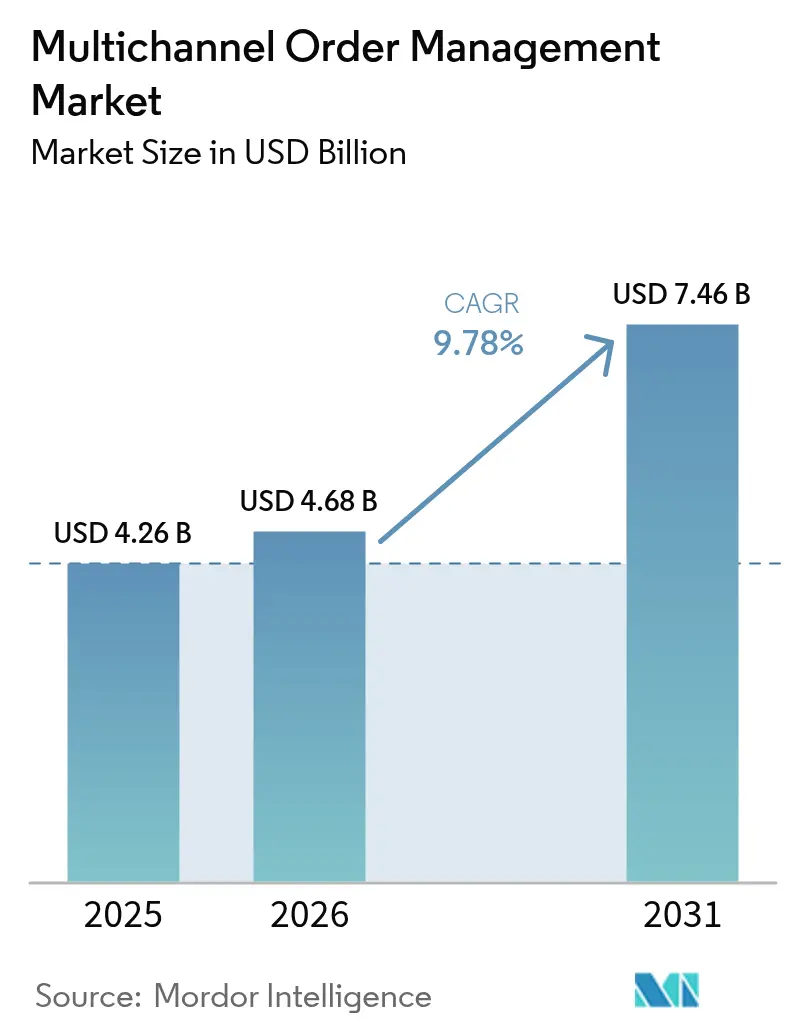
| Market Size (2026) | USD 4.68 Billion |
| Market Size (2031) | USD 7.46 Billion |
| Growth Rate (2026 - 2031) | 9.78 % |
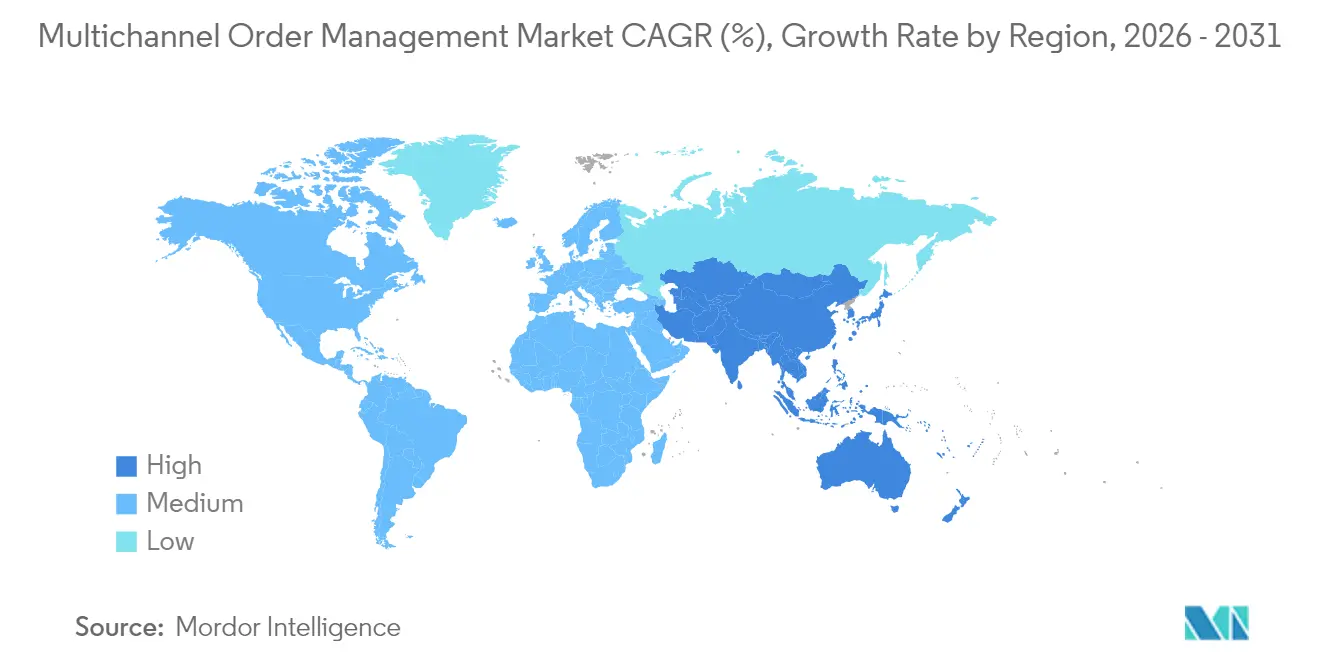
| Fastest Growing Market | Asia Pacific |
| Largest Market | North America |
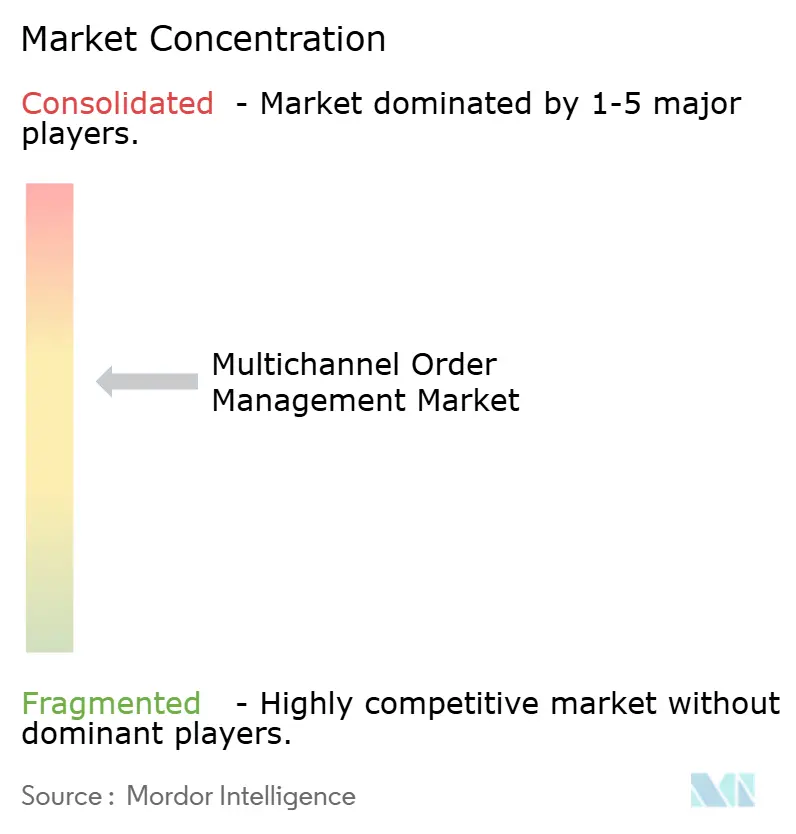
| Market Concentration | Medium |
Major Players *Disclaimer: Major Players sorted in no particular order Image © Mordor Intelligence. Reuse requires attribution under CC BY 4.0. | |
Multichannel Order Management Market Analysis by Mordor Intelligence
The Multichannel Order Management market size is expected to grow from USD 4.26 billion in 2025 to USD 4.68 billion in 2026 and is forecast to reach USD 7.46 billion by 2031 at 9.78% CAGR over 2026-2031. Rising e-commerce penetration, the spread of omnichannel retail strategies, and mounting pressure for real-time inventory visibility are the principal growth catalysts. Large retailers are orchestrating orders across web stores, physical outlets, and social-commerce feeds, while manufacturers and wholesalers now demand the same cross-channel agility. Momentum also reflects the expanding ecosystem of cloud-native applications that integrate order management with payments, warehouse automation, carrier networks, and tax engines. Competitive intensity is increasing as established enterprise-software vendors add advanced orchestration, and niche players leverage AI to improve allocation decisions and cycle-time metrics.
Key Report Takeaways
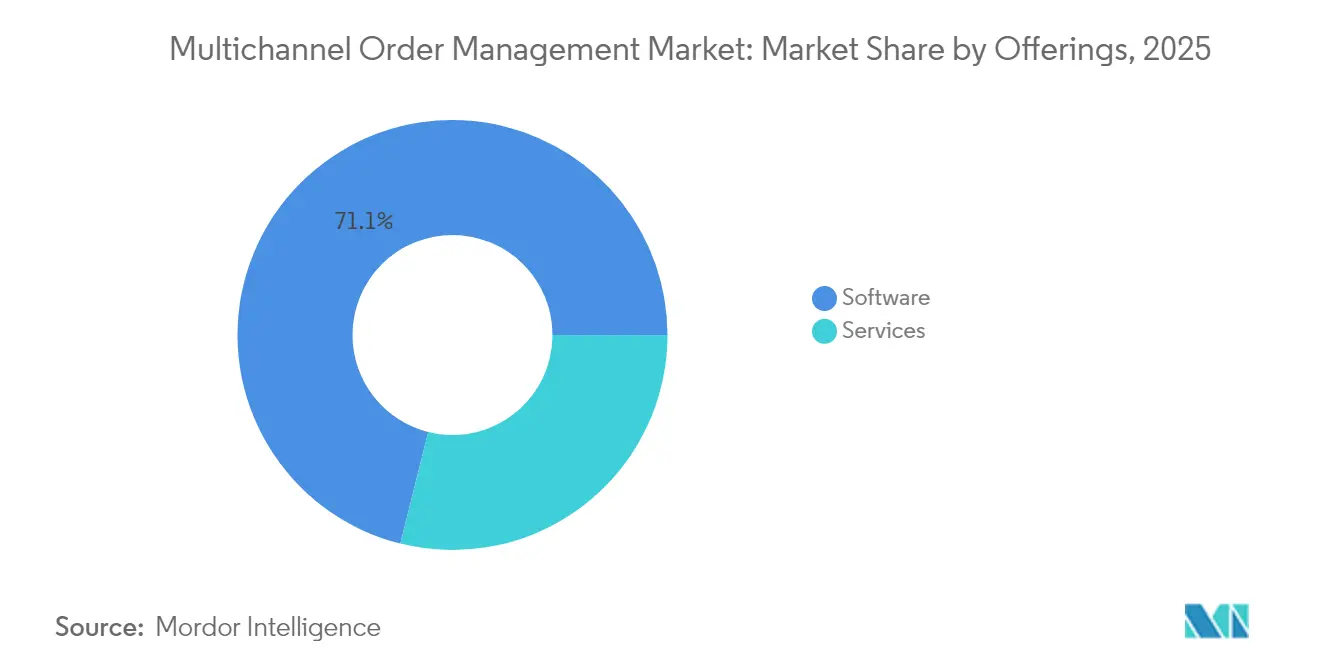
- By offerings, the software segment led with 71.10% revenue share in 2025, while services are projected to expand at a 13.12% CAGR through 2031.
- By deployment mode, cloud deployments captured a 67.60% share in 2025 and are growing fastest at 12.92% to 2031.
- By end-user vertical, retail and e-commerce held 40.70% of the multichannel order management market share in 2025, whereas 3PL and logistics are advancing at a 12.63% CAGR.
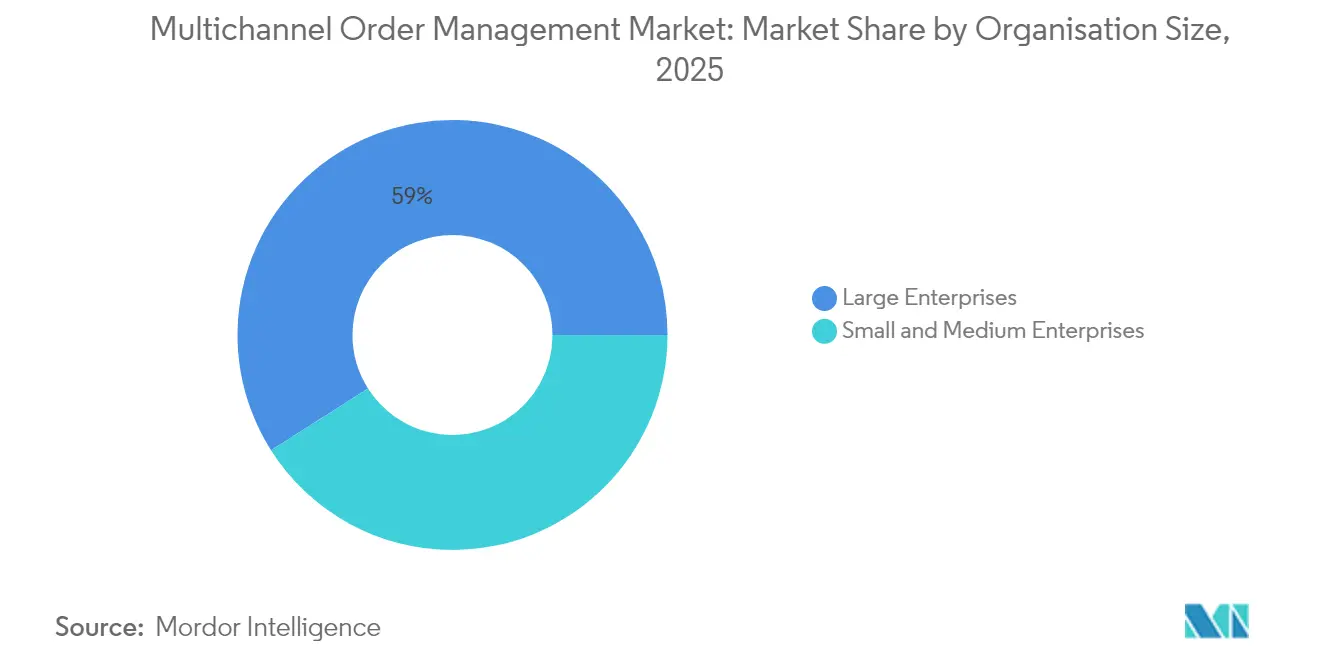
- By organisation size, large enterprises accounted for a 59.00% share in 2025, yet SMEs are set to grow fastest at 13.24% through 2031.
- By sales-channel complexity, click-and-mortar retailers led with 44.20% share in 2025, while marketplace sellers are projected to climb at 12.33% CAGR.
- By geography, North America dominated with 35.80% revenue share in 2025, while Asia-Pacific is forecast to log a 12.41% CAGR to 2031.
Note: Market size and forecast figures in this report are generated using Mordor Intelligence’s proprietary estimation framework, updated with the latest available data and insights as of 2026.
Market Trends and Insights
Drivers Impact Analysis of Multichannel Order Management Market*
| Driver | (~) % Impact on CAGR Forecast | Geographic Relevance | Impact Timeline |
|---|---|---|---|
| Boom in global e-commerce transactions | +2.1% | Global with APAC leading growth | Medium term (2-4 years) |
| Proliferation of omnichannel retail strategies | +1.8% | North America and Europe core expanding to APAC | Long term (≥ 4 years) |
| Shift to cloud-based SaaS OMS platforms | +1.5% | Global, accelerated in developed markets | Short term (≤ 2 years) |
| Hyperscaler marketplace private-offer adoption | +1.2% | North America and Europe primarily | Medium term (2-4 years) |
| AI-driven inventory-optimisation ROI | +1.4% | Global with early adoption in retail-heavy regions | Long term (≥ 4 years) |
| Real-time tax-compliance mandates | +0.8% | Europe and Latin America leading, expanding globally | Short term (≤ 2 years) |
| Source: Mordor Intelligence | |||
Boom in Global E-commerce Transactions
E-commerce is expected to account for 21.2% of global retail sales and generate USD 6.5 trillion in turnover, multiplying the order volume that enterprises must manage across direct-to-consumer sites, marketplaces, and wholesale portals. [2]Fujilogi, “E-commerce Trend Marketing 2024,” fujilogi.net Retailers such as Barbeques Galore cut order-processing time by 49% after deploying a real-time orchestration platform, proving the operational upside of purpose-built systems. Mobile commerce, forecast to represent 42.9% of online sales, adds another layer of high-frequency orders that demand split-second inventory checks and payment authentication. Rapid digital-payment uptake, exceeding 50% of transaction value in Southeast Asia, reinforces the need for integrated gateways within the order-capture workflow. Social-commerce and live-shopping innovations extend order sources to video streams and influencer feeds, forcing businesses to tackle near-continuous inventory allocation challenges.
Proliferation of Omnichannel Retail Strategies
Companies with mature omnichannel programs record 9.5% higher revenue than single-channel peers, driving investment in orchestration that unifies store, warehouse, and drop-ship capacity. Unified inventory pools lower shipping costs by shipping from the closest node, while buy-online-pick-up-in-store and endless-aisle scenarios require dynamic reservation logic. OneStock clients report a 32% lift in overall sales once ship-from-store is enabled. Inditex’s RFID program shows that granular stock visibility supports seamless cross-channel fulfillment. Composable commerce architectures let retailers integrate best-of-breed order components without vendor lock-in and adapt to shifting preferences.
Shift to Cloud-based SaaS OMS Platforms
Seventy-one percent of supply-chain leaders increased cloud ERP spending in 2024 to gain real-time scalability and integration headroom. [1]Food Logistics, “Supply Chain Leaders Plan to Embrace New Technology,” foodlogistics.com Retail247’s cloud-native engine demonstrates how elastic capacity prevents bottlenecks during promotion spikes. Blue Yonder’s migration suite shortens deployment timelines and injects AI-enabled allocation logic. SaaS delivery offloads maintenance overhead and pushes security patches automatically, satisfying compliance audits. Multi-tenant architecture also brings enterprise-grade orchestration to SMEs through subscription pricing, expanding the multichannel order management market addressable base.
AI-driven Inventory-optimisation ROI
AI-powered replenishment lifted sales by 5% at Gratis and shrank stockouts materially. Migros now executes 20 million daily inventory decisions, reducing days-on-hand by 11% while boosting availability by 1.7%. Predictive models scrutinise seasonality, promotions, and local demand to fine-tune safety stocks at each node. DK Company realised a 46% sales uptick and a 15% inventory reduction in five weeks using data-led allocation. The fusion of AI with IoT sensors and RFID establishes real-time supply-chain visibility and paves the way for autonomous replenishment.
Restraints Impact Analysis of Multichannel Order Management Market*
| Restraint | (~) % Impact on CAGR Forecast | Geographic Relevance | Impact Timeline |
|---|---|---|---|
| Data-security and privacy risks in cloud OMS | -1.3% | Global, heightened in Europe due to GDPR | Short term (≤ 2 years) |
| Legacy ERP/WMS integration complexity | -1.8% | North America and Europe primarily | Medium term (2-4 years) |
| Rising carrier surcharges eroding savings | -0.9% | Global, acute in North America | Short term (≤ 2 years) |
| Shortage of OMS-skilled developers | -1.1% | Global, severe in developed markets | Long term (≥ 4 years) |
| Source: Mordor Intelligence | |||
Data-security and Privacy Risks in Cloud OMS
A misconfigured Oracle NetSuite instance exposed thousands of customer records, underscoring that shared-responsibility models amplify configuration risk. [3]Dark Reading, “Oracle NetSuite E-Commerce Sites Expose Customer Data,” darkreading.com Enterprises now require deeper penetration tests and ISO attestations before onboarding sensitive order flows, elongating sales cycles. Emerging privacy statutes add encryption, localization, and audit-trail demands that further raise compliance costs. Multi-tenant footprints can heighten perceived exposure, prompting some firms to request single-tenant or hybrid deployments despite higher total cost of ownership.
Legacy ERP/WMS Integration Complexity
Ninety-five percent of firms cite ERP compatibility as the top order-management hurdle, reflecting rigid data schemas and batch-processing logic in legacy estates. [4]TrueCommerce, “Order Management Challenges—ERP Integration,” truecommerce.com Peace Coffee overcame inventory precision gaps only after switching to a real-time WMS connector. Custom middleware, data-mapping, and exception handling extend timelines and inflate budgets. Fragmented landscapes created by mergers complicate orchestration because each subsidiary often runs its own versions of ERP and warehouse applications.
*Our forecasts treat driver/restraint impacts as directional, not additive. The impact forecasts reflect baseline growth, mix effects, and variable interactions.
Multichannel Order Management Market Segment Analysis
By Offerings:
Services Surge Despite Software DominanceThe software category generated 71.10% of multichannel order management market revenue in 2025, anchoring enterprise investments in scalable orchestration engines. Services, however, are expanding at a 13.12% CAGR as organisations seek integration, customisation, and managed support to accelerate time-to-value. Custom builds often cost USD 200,000-400,000 and require up to 12 months, so firms increasingly favour expert partners to shorten roadmaps. Service consultancies also deliver training that lifts user adoption and mitigates post-go-live disruption.
Demand for composable architectures pushes up integration work, sustaining services momentum through 2031. Rapid 55-day rollouts, such as Deposco’s 3PL implementation, exhibit how specialist teams compress schedules while meeting complex logistics requirements. Managed services now encompass continuous optimisation, upgrades, and AI-model tuning, turning vendors into long-term operational partners.



By Deployment Mode:
Cloud Acceleration ContinuesCloud deployments held 67.60% revenue share in 2025 and are projected to grow at 12.92% CAGR, reflecting enterprises shifting workloads off legacy hardware. Auto-scaling capacity prevents holiday slowdowns, while operating-expense pricing appeals to finance teams. Multicloud agreements, such as Oracle’s pact with AWS, let customers mix best-of-breed analytics with core order management layers.
On-premise remains in regulated industries that require sovereign hosting. Hybrid patterns bridge ERP dependencies by syncing critical data to the cloud while preserving local processing. API-first design eases connectivity with payment gateways and 3PL providers, reinforcing the predominance of cloud in the multichannel order management market.
By End-user Vertical:
3PL Growth Outpaces Retail LeadershipRetail and e-commerce accounted for 40.70% of the multichannel order management market in 2025, leveraging orchestration to balance store and warehouse stock while meeting next-day delivery promises. Yet the 3PL sector is expanding at 12.63% CAGR as outsourcing gains popularity among brands seeking variable cost structures. Third-party providers need flexible rule sets to service multiple clients with distinct SLAs and label formats.
The 3PL boom underlines technology priorities such as multi-tenant inventory views, automated billing, and data-sharing portals. Digital transformation is advancing through warehouse robotics, IoT tags, and predictive slotting, all of which rely on central order-execution data. Healthcare and food sectors also increase adoption, driven by compliance documentation for lot traceability.
By Organisation Size:
SME Adoption AcceleratesLarge enterprises retained 59.00% market share in 2025 thanks to global rollouts integrated with complex ERP landscapes. Nevertheless, SMEs are projected to log 13.24% CAGR to 2031, fuelled by subscription pricing and template-based setups that minimise IT overhead.
The rise of marketplace-first merchants in Asia-Pacific underscores how low entry costs widen the multichannel order management market addressable segment. SMEs value connectors for Shopify, WooCommerce, and local marketplaces that enable end-to-end automation without custom code. Vendor roadmaps now prioritise self-service dashboards and embedded analytics suitable for resource-constrained teams.
By Sales-Channel Complexity:
Marketplace Sellers Drive GrowthClick-and-mortar retailers commanded 44.20% revenue in 2025, reflecting the inventory-sync challenge across stores and digital outlets. Marketplace sellers, however, are growing at 12.33% CAGR as hyperscaler portals expand private-offer ecosystems from USD 16 billion in 2023 to USD 85 billion by 2028.
Advanced orchestration prevents stockouts and overselling by refreshing listings every few seconds across Amazon, eBay, and regional platforms. Social-commerce integrations capture checkout events from live streams, while cross-border expansion requires dynamic tax and duty calculation. Intelligent allocation routes high-margin orders to same-day hubs, improving profitability as competitors chase free-shipping benchmarks.
Geography Analysis
North America Multichannel Order Management Market
North America generated 35.80% of 2025 revenue and remains the hub for early cloud adoption, AI proofs of concept, and marketplace partnerships. Retailers face escalating surcharges, with 2025 general rate hikes of 5.9% plus add-on fees, motivating sophisticated carrier-selection algorithms. Investment activity continues, evident in Clearwater’s USD 1.5 billion acquisition of Enfusion to unify front-to-back workflows. Government support for digital sales-tax collection accelerates demand for automated compliance modules.
APAC Multichannel Order Management Market
Asia-Pacific is the fastest-growing territory at 12.41% CAGR thanks to mobile-first consumer behaviour, live-commerce popularity, and a projected USD 230 billion Southeast-Asian e-commerce market by 2026. Shoppers often browse in-store and order online, forcing retailers to merge real-time store inventory with digital carts. Local payment methods such as e-wallets demand embedded gateways and instant reconciliation. Japanese restaurants now integrate mobile order apps with NEC point-of-sale to offset labour shortages, illustrating cross-industry adoption. Diverse tax regimes and data-localisation rules compel vendors to offer region-specific hosting and compliance layers.
Europe Multichannel Order Management Market
Europe records steady growth supported by strict privacy regulation that mandates granular audit trails. Continuous transaction controls require real-time tax validation, leading SAP users to upgrade order flows for compliance. Consumer expectations for sustainable delivery spur features like location-based packaging suggestions and eco-route selection. Retailers prefer hybrid deployments hosted in regional data centres to satisfy GDPR and sovereignty criteria. National variations in omnichannel maturity-from click-and-collect ubiquity in the United Kingdom to store-centred fulfilment in Germany-increase demand for configurable rule engines that support country-level process nuances.

Regulatory Landscape
Multichannel order management platforms operate under a tightening mix of cross-border trade and digital-platform compliance rules that affect landed-cost calculation, seller onboarding, and shipment data quality. In March 2026, trade-policy changes such as reduced de minimis thresholds in the United States (from USD 800 to USD 200) and Canada (commercial threshold from CAD 150 to CAD 40) raised the importance of accurate duty and tax determination at checkout and in post-order adjustments, particularly for marketplace and social-commerce orders.
In Europe, enforcement of the Digital Services Act provisions for large online platforms beginning January 2026 increased operational requirements around seller verification and traceability workflows that connect to OMS master data and audit trails. Logistics data compliance also tightened with the EU Import Control System 2 (ICS2) Phase 3 rollout as of March 2026, which requires advance cargo declarations for air freight and express shipments, pushing shippers and their software providers to improve data completeness earlier in the order lifecycle. At the multilateral level, the WTO moratorium on customs duties on electronic transmissions lapsed on March 30, 2026 after MC14, while 67 WTO members adopted an interim pathway on March 28, 2026 toward an E-Commerce Agreement framework, reinforcing the need for vendors and merchants to monitor jurisdiction-by-jurisdiction rules affecting digital trade and cross-border fulfillment documentation.
Value Chain Analysis
The multichannel order management value chain starts with demand and order capture across webstores, marketplaces, social commerce, POS, and call centers, then moves into an orchestration layer that validates payments, checks inventory, applies routing rules, and commits delivery promises. OMS vendors and cloud providers supply the core software platform, which is increasingly cloud-native and API-first, while systems integrators and managed service providers handle implementation, data mapping, and ongoing optimization, aligning with the report context that services are expanding faster than software as organizations modernize connected estates.
Downstream, OMS connects to execution partners including ERP for finance and master data, WMS for pick-pack-ship, TMS and carrier networks for label generation and tracking, tax engines for calculation and e-invoicing, and returns platforms for reverse logistics. Integration and interoperability remain key bottlenecks, especially where legacy systems are batch-based and require custom middleware, which elongates time-to-value and drives demand for prebuilt connectors and accelerators. Telecom-oriented order management modernization points to how API-driven architectures can reduce order-to-deliver cycle times and manual touches, reflecting a broader market pattern where orchestration value accrues when real-time data exchange is achieved across quoting, inventory, provisioning/fulfillment, and billing systems.
Competitive Landscape
The multichannel order management market remains moderately fragmented despite accelerated consolidation. Oracle and SAP bundle OMS within wider application suites and leverage large installed bases to cross-sell orchestration upgrades. Manhattan Associates and Blue Yonder differentiate through deep supply-chain optimisation and industry-specific workflows. Cloud-native challengers such as Shopify and VTEX target mid-market merchants with pre-integrated commerce stacks, while Sellercloud’s acquisition by Descartes extends visibility into last-mile carrier networks.
Technology competition centres on AI-driven promise dates, predictive allocation, and real-time exception handling. Patent filings cover predictive ordering and blockchain task management, signalling sustained R&D commitments. Ecosystem partnerships amplify reach; ketteQ’s integration with Salesforce Manufacturing Cloud illustrates vendor alignment with dominant CRM and planning platforms.
White-space opportunities persist in verticalised solutions for healthcare, aerospace, and industrial machinery, where serialisation and complex configurator needs demand specialised rule sets. Vendors are also experimenting with usage-based pricing tied to order volumes, appealing to seasonal merchants. Competitive pressure is expected to intensify as hyperscalers embed native OMS capabilities within marketplace seller portals, compressing differentiation around basic order capture and forcing vendors to innovate in predictive fulfilment and sustainability modules.
Multichannel Order Management Industry Leaders
IBM Corporation
Oracle Corporation
Salesforce, Inc.
SAP SE
Manhattan Associates, Inc.
- *Disclaimer: Major Players sorted in no particular order
Multichannel Order Management Market Companies Covered in this Report
- IBM Corporation
- Oracle Corporation
- Salesforce, Inc.
- SAP SE
- Manhattan Associates, Inc.
- Blue Yonder Group, Inc.
- HCL Technologies Ltd.
- Microsoft Corporation
- NetSuite (Oracle)
- Shopify Inc.
- Sage Group plc (Brightpearl)
- Zoho Corporation Pvt Ltd.
- Linnworks Ltd.
- ChannelAdvisor (CommerceHub)
- Lightspeed Commerce Inc.
- Adobe Commerce (Magento)
- Cloud Commerce Pro Ltd.
- Freestyle Solutions, Inc.
- Unicommerce eSolutions Pvt Ltd.
- VTEX
- Elastic Path Software Inc.
- 3PL Central (Skubana)
- FarEye Technologies Pvt Ltd.
- Mirakl SA
- Sanderson Design Group plc

Market Opportunities and Future Outlook
ERP modernization and clean-core programs create whitespace for OMS extensions that minimize heavy customization while still supporting complex fulfillment and configuration logic. In January 2026, DataXstream introduced OMS+ Cloud for SAP S/4HANA Cloud Public Edition, reflecting demand for SAP-aligned order orchestration that fits clean-core standards and supports distributed fulfillment without rewriting the ERP. This approach supports opportunities for vendors and partners that package standardized integrations, templates, and governance-ready audit trails for enterprises migrating away from monolithic stacks.
Prebuilt accelerators that connect commerce, fulfillment, and logistics networks also support faster adoption for merchants and manufacturers seeking multichannel reach without large integration projects. In January 2026, Amazon released Multi-Channel Fulfillment and Buy with Prime Accelerators for SAP S/4HANA via SAP Business Technology Platform, aiming to reduce integration requirements for existing SAP workflows, which supports the commercial appeal of connector-led OMS deployments. As cross-border rules and logistics data requirements tighten, for example EU ICS2 and shifting de minimis thresholds, demand increases for OMS capabilities that unify tax, duty, carrier selection, and shipment-data completeness across channels, creating space for vendors that embed compliance-grade calculation, document generation, and exception management into the order lifecycle.
Recent Industry Developments in Multichannel Order Management Market
- July 2026: SAP highlighted continued client momentum using IBM technology with SAP Cloud ERP Private to support AI-driven innovation. The update reinforced joint ecosystem positioning around enterprise transformation programs where order, inventory, and customer data need to move across application boundaries with governance controls.
- May 2026: IBM launched a limited-time eCommerce pilot that lets customers purchase partner-built AI agents for watsonx Orchestrate. The move broadened access to agent-based automation that can be applied to order exceptions, customer inquiries, and back-office coordination, increasing competitive pressure around AI-enabled workflow orchestration.
- April 2026: IBM enabled IBM Sterling Order Management deployments on Red Hat OpenShift Service on AWS (ROSA). This expanded deployment flexibility for enterprises standardizing on managed Kubernetes, supporting cloud-native scaling and operational consistency for multichannel order volumes.


Multichannel Order Management Market Report Scope and Research Methodology
Market Definition and Coverage
For this study, the market covers revenue earned from multichannel order management software and related implementation and support services. These offerings help businesses capture, route, and track orders across two or more sales channels, and keep order status and inventory visibility aligned across those channels.
Scope exclusions: We exclude single-channel order capture tools and stand-alone warehouse management modules that do not perform cross-channel order orchestration.
Segments Covered in This Report
- By Offerings
- Software
- Services
- By Deployment Mode
- Cloud
- On-premise
- By End-user Vertical
- Retail and E-commerce
- Food and Beverage
- Healthcare
- 3PL and Logistics
- Other End-user Verticals
- By Organisation Size
- Large Enterprises
- Small and Medium Enterprises (SMEs)
- By Sales-Channel Complexity
- Pure-play Digital
- Click-and-Mortar
- Marketplace Sellers
- By Geography
- North America
- United States
- Canada
- Mexico
- South America
- Brazil
- Argentina
- Chile
- Rest of South America
- Europe
- Germany
- United Kingdom
- France
- Italy
- Spain
- Russia
- Rest of Europe
- Asia-Pacific
- China
- India
- Japan
- South Korea
- Singapore
- Malaysia
- Australia
- Rest of Asia-Pacific
- Middle East and Africa
- Middle East
- United Arab Emirates
- Saudi Arabia
- Turkey
- Rest of Middle East
- Africa
- South Africa
- Nigeria
- Rest of Africa
- Middle East
- North America
Data Sources, Market Sizing, and Validation
Desk Research
Desk research was used to map the demand environment for multichannel order management and to anchor assumptions that can be checked year after year. We leaned on public sources such as the US Census Bureau retail and ecommerce releases, Eurostat retail trade statistics, UN Comtrade trade data for relevant hardware and IT categories, and World Bank digital adoption and broadband indicators. For technology and operations context, sources such as NIST publications and peer-reviewed supply chain and information systems journals were also reviewed.
Alongside these, we referenced company filings, annual reports, investor presentations, and product documentation to understand how revenue is reported and what features are typically included in an order management platform. A paid subscription for company financials and intelligence helped with faster screening of vendors and ownership changes, and a patent database was used to sanity-check feature evolution (for example, allocation logic and integration tooling). The desk sources listed here are illustrative only, and many other public materials were used for data collection, validation, and clarification.
Primary Interviews and Surveys
Primary work was used to test scope, pricing logic, and adoption levels across industries that run complex fulfillment, including retail, ecommerce-first brands, wholesale, and hybrid B2B sellers. We spoke with a mix of platform providers, system integrators, and buyer-side operations and IT leaders to confirm what is counted as multichannel order management versus adjacent tools, and to align regional adoption signals across APAC, EMEA, and the Americas.
Distribution of primary research fieldwork respondents
| Company type | Respondent position | Region |
|---|---|---|
| Top tier: 26% | CXOs: 13% | APAC: 41% |
| Mid tier: 54% | Functional/Unit leaders: 31% | EMEA: 33% |
| Smaller Players: 20% | Managers: 56% | Americas: 26% |
Market-Sizing & Forecasting
Market sizing starts with a top-down build where digital commerce activity and enterprise software spend patterns are translated into a realistic pool of firms that need cross-channel order orchestration, which is then narrowed using adoption signals from interviews. To keep the total grounded, we corroborate it with selective bottom-up approximations, such as sampled price ranges for subscriptions and services, typical user counts by company size, and channel checks on implementation intensity, and then adjust where the two views do not align.
Key inputs used in the model include ecommerce sales growth, the mix of online versus store-assisted orders, order volume complexity (split shipments, backorders, and ship-from-store use), cloud deployment preference, average contract length and renewal behavior, and service attachment for integrations and change management. Forecasts are produced using scenario analysis, where the base case reflects what experts expect for digital commerce growth and IT budget priority, and the sensitivity cases test slower platform replacement cycles or faster marketplace penetration. Where bottom-up inputs are missing for smaller regions or smaller buyers, we apply conservative adoption proxies tied to retail and ecommerce activity, and then re-check them through follow-up calls.
Data Validation & Update Cycle
Outputs are validated through multiple checks, starting with internal consistency tests across regions and with comparisons to independent signals like ecommerce sales trends and enterprise software spending direction. When an outlier appears, assumptions are revisited, and targeted re-contacts are triggered to confirm whether the variance is a real market shift or a modeling artifact.
Before sign-off, the model and narratives go through a multi-step analyst review so that definitions, math, and logic stay aligned. Reports are refreshed annually, and interim updates are made when material events occur, such as major platform pricing changes, large acquisitions, or meaningful shifts in cloud adoption. Right before delivery, a fresh pass is completed so clients receive the latest updated view.
Mordor Intelligence's Multichannel Order Management Market Size Compared With Other Published Estimates
Published market numbers for multichannel order management often do not match because the service scope, the year chosen for comparison, and the pricing assumptions vary across studies. Even when the topic label is the same, different teams may be counting different parts of the order stack, and they may also be using different refresh timings for fast-moving software categories.
The main gap comes from whether adjacent tools are counted as part of order management, where Mordor Intelligence counts revenue only when software and related services centralize order capture and orchestration across two or more channels, rather than including stand-alone warehouse or single-channel order capture modules. Differences also show up in how subscription pricing is projected over time, how implementation services are treated in the total, and whether regional adoption is extrapolated from broad ecommerce growth or verified through interviews with buyers and delivery partners.
Benchmark comparison
| Source | Market Size | Gaps in Research Methodology |
|---|---|---|
| Mordor Intelligence | USD 4.26 B (2025) | |
| Global Consultancy A | USD 3.20 B (2024) | Uses an earlier base year and a faster growth profile, and its scope language leans toward multichannel retail enablement, which can undercount service attachment and later-stage enterprise deployments that expand totals. |
| Regional Consultancy B | USD 2.08 B (2024) | Runs a narrower value capture for the platform layer and applies a longer forecast window with a slower mid-period ramp, which can reduce the near-term total when pricing and integration services are treated more lightly. |
Taken together, the spread is mostly explained by scope boundaries around adjacent systems, plus how pricing and services are carried into the revenue build. By keeping assumptions tied to clear channel-orchestration requirements, and then checking them against interview feedback and observable commerce signals, the sizing stays traceable and repeatable.


Key Questions Answered in the Report
What is the current multichannel order management market size?
The multichannel order management market size is USD 4.68 billion in 2026 and is forecast to reach USD 7.46 billion by 2031.
Which region leads the multichannel order management market?
North America leads with 35.80% revenue share in 2025 thanks to mature e-commerce infrastructure and early cloud adoption.
Which deployment mode is growing fastest?
Cloud deployments hold 67.60% share and are growing fastest at 12.92% CAGR as enterprises migrate from legacy on-premise systems.
Why are services expanding faster than software?
Enterprises need consulting, integration, and managed-service expertise to accelerate complex omnichannel implementations, resulting in a 13.12% CAGR for services.
What vertical segment is most attractive for future growth?
Third-party logistics providers represent the fastest-growing end-user vertical at 12.63% CAGR, driven by multi-client order complexity and rising delivery expectations.
How does AI influence order management?
AI boosts allocation accuracy, reduces stockouts, and automates replenishment, delivering sales uplifts of 5-46% in documented retail use cases.
Page last updated on:





