
Streaming Analytics Market Size and Share
Market Overview
| Study Period | 2020 - 2031 |
|---|---|
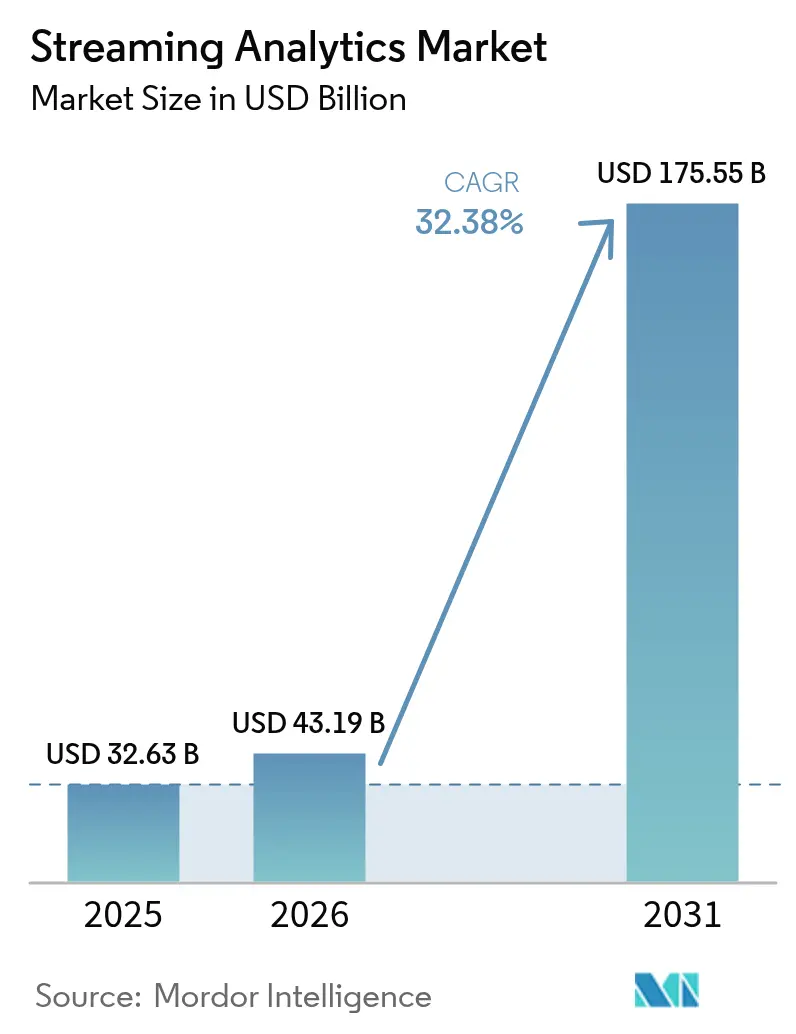
| Market Size (2026) | USD 43.19 Billion |
| Market Size (2031) | USD 175.55 Billion |
| Growth Rate (2026 - 2031) | 32.38 % |
| Fastest Growing Market | Asia Pacific |
| Largest Market | North America |
| Market Concentration | Low |
Major Players *Disclaimer: Major Players sorted in no particular order Image © Mordor Intelligence. Reuse requires attribution under CC BY 4.0. | |
Streaming Analytics Market Analysis by Mordor Intelligence
The streaming analytics market size in 2026 is estimated at USD 43.19 billion, growing from 2025 value of USD 32.63 billion with 2031 projections showing USD 175.55 billion, growing at 32.38% CAGR over 2026-2031. Near-instant insights generated from continuously flowing data are becoming a board-room priority as enterprises pivot away from batch practices toward responsive, AI-enhanced decision loops. Generative models embedded directly inside data pipelines, wide availability of edge inference chips, and a growing set of managed cloud services collectively compress the time between data capture and action. Vendors are refining pay-as-you-go pricing and simplifying orchestration so that firms can scale real-time workloads without provisioning burdens. While early adopters focused on fraud detection and recommendation engines, 2025 sees an uptick in industrial reliability use cases, telehealth monitoring, and 5G-enabled network optimization. Heightened sensitivity to data-transfer charges and talent scarcity temper otherwise robust demand, yet the fundamental shift toward event-driven architectures keeps the streaming analytics market on a steep growth path.
Key Report Takeaways
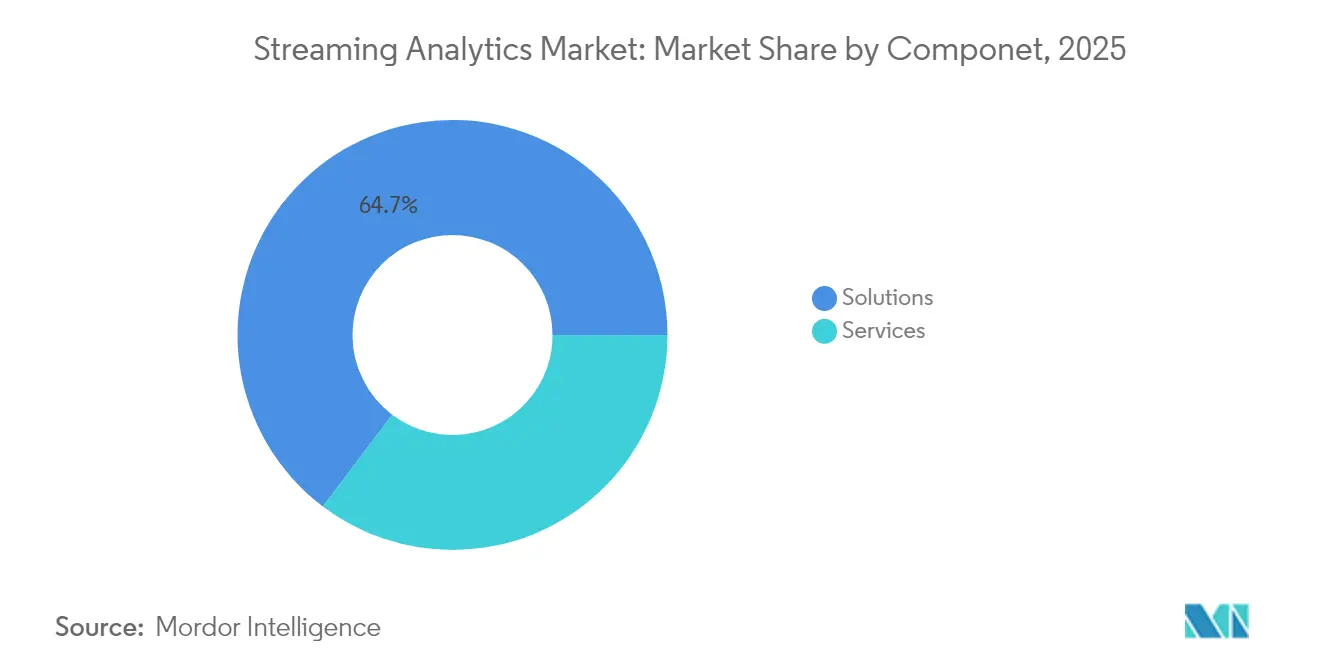
- By component, solutions accounted for 64.70% revenue in 2025, whereas services are expanding at 33.10% CAGR through 2031.
- By deployment, cloud recorded 59.00% of the streaming analytics market share in 2025 and is growing at 33.40% CAGR to 2031.
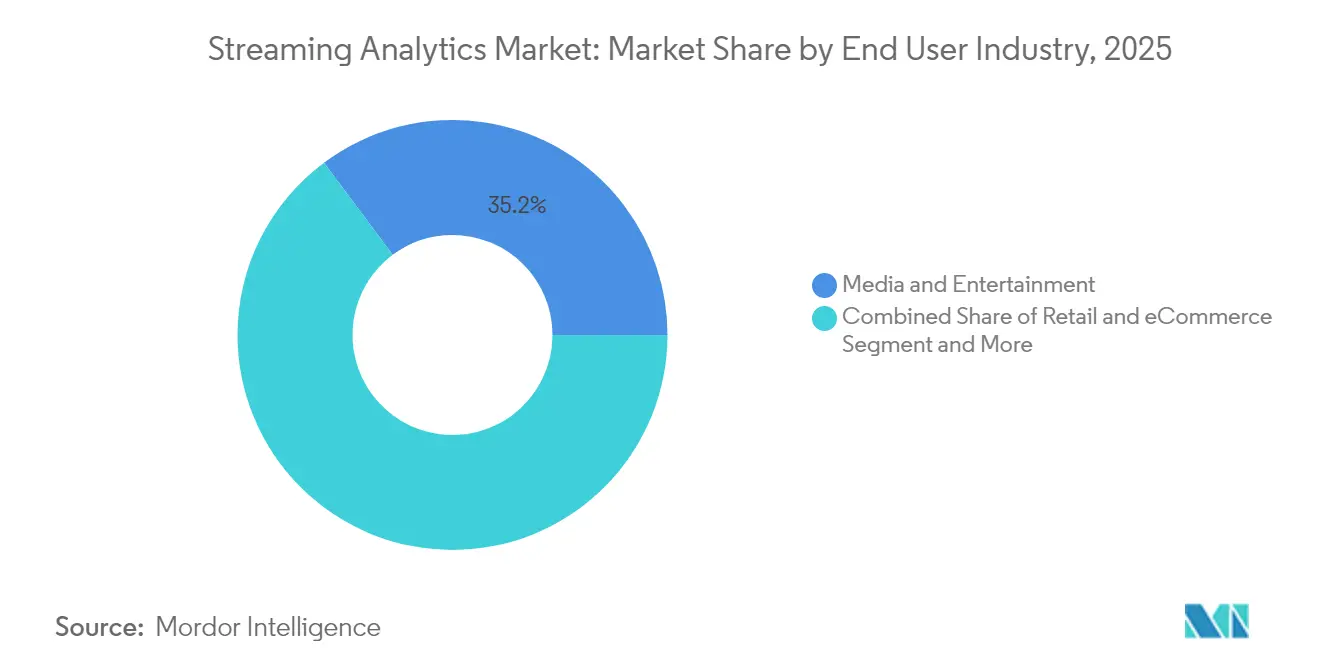
- By end-user industry, media and entertainment led with 35.20% revenue share in 2025; it is also the fastest-growing segment at 33.60% CAGR.
- By organization size, large enterprises held 62.40% share of the streaming analytics market size in 2025, yet SMEs post the highest CAGR of 33.00%.
- By geography, North America held 29.30% share of the streaming analytics market size in 2025, yet Asia-Pacific post the highest CAGR of 33.20%.
Note: Market size and forecast figures in this report are generated using Mordor Intelligence’s proprietary estimation framework, updated with the latest available data and insights as of 2026.
Global Streaming Analytics Market Trends and Insights
Drivers Impact Analysis*
| Driver | (~) % Impact on CAGR Forecast | Geographic Relevance | Impact Timeline |
|---|---|---|---|
| Generative-AI infused data pipelines | +8.2% | Global, with early adoption in North America and Asia-Pacific | Medium term (2-4 years) |
| Edge AI chips enabling on-device stream processing | +6.8% | APAC core, spill-over to North America and EU | Long term (≥ 4 years) |
| Low-code/no-code streaming workbenches for citizen developers | +4.3% | Global, particularly strong in SME segments | Short term (≤ 2 years) |
| Mainstream adoption of event-driven micro-services | +5.1% | North America and EU, expanding to Asia-Pacific | Medium term (2-4 years) |
| Growing SME demand for cloud stream analytics | +3.8% | Global, led by North America and Europe | Short term (≤ 2 years) |
| Expansion of IoT and industrial automation | +4.9% | Global, with manufacturing hubs in Asia-Pacific leading | Long term (≥ 4 years) |
| Source: Mordor Intelligence | |||
Generative-AI Infused Data Pipelines
Context-aware models integrated with high-throughput brokers turn raw events into prescriptive actions in milliseconds. Financial institutions combining language models with streaming telemetry report 40% gains in fraud-detection accuracy while slashing false positives.[1]Confluent,“Confluent and Databricks Deepen Partnership,” Confluent Blog, confluent.io Bidirectional connectors between Confluent Tableflow and Databricks Delta Lake keep models supplied with fresh, lineage-rich data, eliminating manual refresh cycles. Retailers now auto-tune promotion parameters in real time, lifting conversion rates during flash sales. As libraries for vector search and semantic enrichment join core stream engines, predictive maintenance and anomaly triage are shifting from dashboards to closed-loop autonomy. The result is a broader enterprise appetite to operationalize AI without the latency penalties of traditional ETL.
Edge AI Chips Enabling On-Device Processing
NVIDIA’s Jetson AGX Thor supplies up to 8 times the prior-generation compute, with 128 GB memory supporting hefty transformer inference at source.[2]NVIDIA“Introducing NVIDIA Jetson AGX Thor,” NVIDIA Newsroom, nvidia.com Manufacturers deploy the module next to vibration sensors so that models flag bearing wear before costly downtime. Hospitals rely on edge inference to trigger nurse alerts when patient vitals deviate, meeting privacy rules that restrict continuous cloud upload . Emerging accelerators like Groq’s LPU push token generation to 300 tokens per second, letting conversational assistants run inside teller kiosks. By sidestepping back-haul latency and bandwidth charges, firms unlock real-time use cases in ships, mines, and rural cell towers where connectivity remains inconsistent. The technology thus widens geographic reach for the streaming analytics market while reinforcing compliance with data-sovereignty codes.
Low-Code/No-Code Streaming Workbenches for Citizen Developers
Drag-and-drop canvases hide the complexity of partitions, watermarking, and schema evolution, letting domain experts assemble flows without Java or Scala. TrendMiner shows plant operators configuring predictive-maintenance models in weeks instead of quarters.[3]TrendMiner, “TrendMiner Empowers Plant Operators with No-Code Analytics,” trendminer.com OutSystems integrates Confluent infrastructures so that finance analysts stream card-swipe data into risk dashboards without IT backlog. This democratization is crucial for SMEs that cannot compete for scarce Kafka talent. Visual abstractions also accelerate experimentation, allowing marketing teams to A/B-test personalization rules on live clickstreams swiftly. Easier tooling, therefore, reduces the barrier to entry and expands the addressable streaming analytics market.
Mainstream Adoption of Event-Driven Micro-Services
Digital natives dismantle monoliths so that each service responds to Kafka or Pulsar topics, scaling precisely with demand. Uber processes advertising events using Apache Flink with exactly-once guarantees, ensuring billing accuracy at multi-million-TPS rates. DoorDash ingests millions of delivery events per second, updating routes and surge pricing in near real time. With services decoupled, failures stay local and new features deploy without full-stack releases, lifting developer velocity. Enterprises previously tied to nightly batch jobs now re-platform CRMs, ERPs, and MES systems onto event streams, embedding analytics directly into transactions. As architecture blueprints mature, board-level risk aversion declines, further elevating the streaming analytics market trajectory.
Restraints Impact Analysis*
| Restraint | (~) % Impact on CAGR Forecast | Geographic Relevance | Impact Timeline |
|---|---|---|---|
| Rising Kafka skill-set shortage and wage inflation | -4.7% | Global, particularly acute in North America and EU | Short term (≤ 2 years) |
| Escalating egress fees on hyperscaler clouds | -3.2% | Global, affecting multi-cloud strategies | Medium term (2-4 years) |
| Data-sovereignty regulations limiting cross-border stream flows | -2.8% | EU leading, expanding to Asia-Pacific and Americas | Long term (≥ 4 years) |
| Legacy batch-centric architectures delaying migration | -3.9% | Global, particularly in traditional enterprises | Medium term (2-4 years) |
| Source: Mordor Intelligence | |||
Rising Kafka Skill-Set Shortage and Wage Inflation
Eighty-plus percent of Fortune 100 enterprises rely on Kafka, yet job boards list far more openings than qualified engineers. United States salaries top USD 100,000, squeezing budgets for mid-tier firms. The steep learning curve around brokers, replication factors, and exactly-once semantics deters newcomers, while retaining talent proves challenging as cloud vendors poach senior staff. Managed platforms help but trade flexibility for subscription outlays. Consulting partners expand training bootcamps, though ramp-up times still lag project deadlines. Until educational pipelines catch up, talent scarcity will curb some rollouts, particularly in regulated sectors where outsourcing is constrained.
Escalating Egress Fees on Hyperscaler Clouds
Data-transfer charges can consume 10–15% of real-time-processing budgets, and surprise spikes emerge during traffic bursts. ClickHouse Cloud’s price list revision in January 2025 added new egress tiers, prompting customer protests. Although Google waived exit fees for bulk migrations, inter-region transit and multi-cloud replication still incur costs. Architects now compress, deduplicate, and sample streams to control spend, but each tactic erodes analytical granularity. Organizations with strict latency SLAs hesitate to bifurcate workloads, strengthening provider lock-in and narrowing vendor negotiation leverage. Cost opacity therefore restrains optimal architecture design and slows certain expansions within the streaming analytics market.
*Our forecasts treat driver/restraint impacts as directional, not additive. The impact forecasts reflect baseline growth, mix effects, and variable interactions.
Segment Analysis
By Component: Services Expand as Real-Time Complexity Grows
Solutions provided the structural backbone of the streaming analytics market in 2025 with 64.70% revenue, reflecting wide adoption of brokers, processors, and interactive query engines. Yet services are accelerating at 33.10% CAGR through 2031 as enterprises seek design blueprints, migration aid, and 24/7 SRE support. Architecture assessments, data-quality remediation, and schema governance dominate new statements of work. Confluent and EY formed a strategic alliance in 2025 to bundle implementation accelerators, underscoring demand for outside expertise. As observability and cost-optimization mandates rise, managed services extend from simple hosting to auto-tuning capacity based on event velocity.
Skills shortages push even risk-averse sectors to outsource runtime operations, shifting budgets from capital expenditure to recurring services. Vendor roadmaps show pre-packaged compliance modules for PCI-DSS and HIPAA emerging inside subscription tiers, which lowers the barrier for regulated adopters. Consequently, the streaming analytics market size for professional and managed services is projected to outpace core software revenues, reinforcing a virtuous cycle where know-how, not tool count, differentiates providers.



By Deployment: Cloud Dominance Shapes Sourcing Strategy
Cloud claimed 59.00% of 2025 revenue, and its 33.40% CAGR signals continued preference for elastic capacity. Hyperscalers pair auto-scaling stream engines with lakehouses and vector databases, letting teams ingest, enrich, and serve ML features without hardware procurement. Google Cloud stitches Pub/Sub, Dataflow, BigQuery, and Vertex AI into a managed continuum, easing burden for firms lacking distributed-systems talent. The streaming analytics market size for on-premise workloads remains meaningful in defense, fintech, and public health, but growth trails cloud due to refresh cycles and capex hurdles.
Hybrid blueprints mitigate egress costs by processing sensitive telemetry in factories with Azure SQL Edge before forwarding aggregates to cloud ML endpoints. Providers now enable policy-based topic placement so that individual partitions stay inside national borders, satisfying emerging sovereignty rules. Over the forecast, multicloud federation tools that span IAM, lineage, and governance will influence vendor selection as buyers seek exit-cost protection.
By End-User Industry: Media and Entertainment Tops Adoption Curve
Media and entertainment led revenue in 2025 at 35.20% and retains the fastest 33.60% CAGR. Streaming platforms process concurrent viewing telemetry to personalize thumbnails, prefetch bandwidth, and price ad slots in sub-second windows. Disney+ Hotstar deploys Kafka and Flink clusters to accommodate cricket viewership peaks exceeding 45 million simultaneous users. Retail and e-commerce trail closely, ingesting clickstream, inventory, and payment signals to synchronize stock and prevent fraud. Manufacturing embraces predictive maintenance by analyzing vibration and temperature feeds, while BFSI focuses on anti-money-laundering and market-risk engines that demand deterministic latency.
Healthcare providers adopt real-time vitals monitoring, forwarding edge-filtered alerts to clinicians for intervention. Transportation and logistics operators employ geospatial streaming to optimize driver routes and cold-chain integrity. Telecommunications carriers apply AI models to 5G core metrics for congestion prediction. Across verticals, sector-specific accelerators—such as fraud-rules templates or asset-health schemas—further widen the streaming analytics market.
By Organization Size: SMEs Narrow the Real-Time Divide
Large enterprises accounted for 62.40% of 2025 revenue, leveraging deep pockets to self-host petabyte-scale clusters and integrate bespoke micro-services. However, SMEs exhibit a 33.00% CAGR as managed cloud and low-code tooling remove heavy upfront investments. Pay-as-you-stream meters mean smaller shops can pilot projects on day-one data volumes, then auto-scale as business expands. Open-source compatibles such as Redpanda Cloud lure budget-conscious firms with simplified ops and predictable billing.
Low-code canvases let marketing or plant staff wire together CDC connectors, CEP operators, and dashboard sinks without SQL. Vendor marketplaces now bundle off-the-shelf fraud modules or IoT anomaly detectors purchasable by credit card. This democratization ensures that the streaming analytics industry no longer mirrors company size but rather digital ambition. Consequently, mid-market adoption propels diversification of service packaging and paves the way for industry-specific starter kits.
Geography Analysis
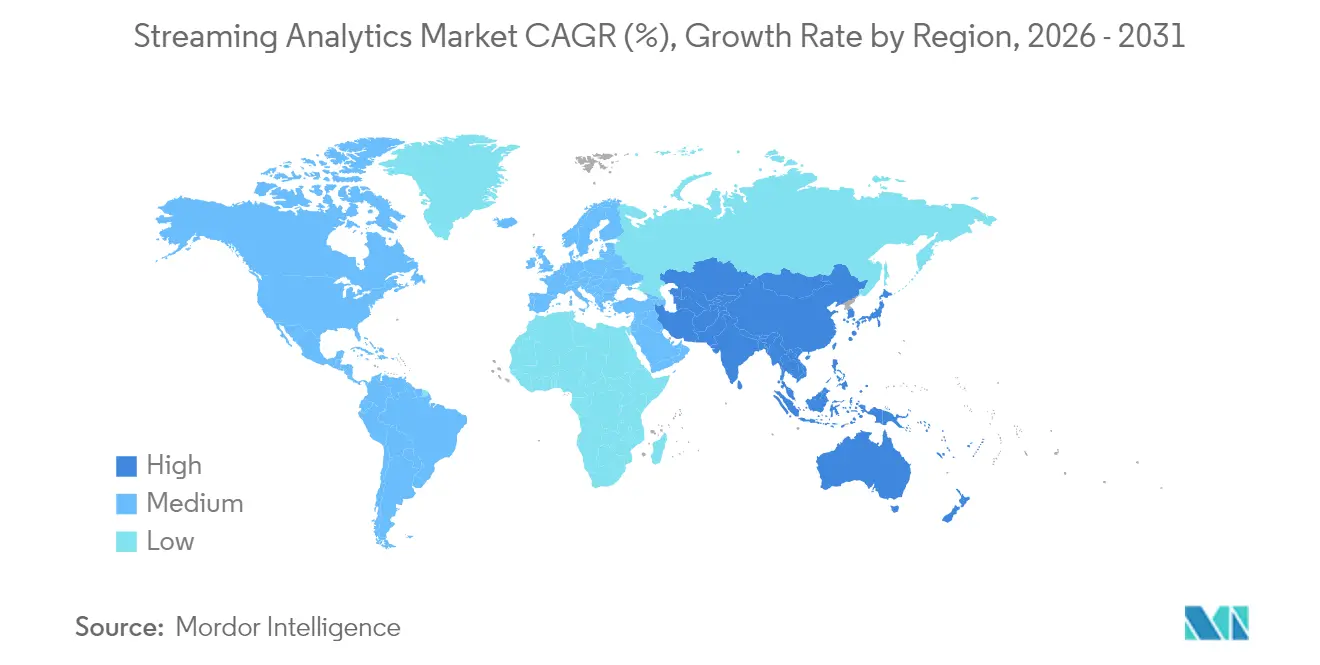
North America captured 29.30% revenue in 2025 owing to early hyperscaler ecosystems and a mature cadre of Kafka specialists. Financial services, ride-hailing, and retail pioneers validated ROI, creating reference designs that spread across sectors. Yet saturation tempers incremental growth, and skilled-labor bottlenecks spark wage premiums that influence deployment budgets. Government push for real-time public-sector dashboards—covering weather, wildfire, and mobility—adds steady demand, albeit at rigorous compliance levels.
Asia-Pacific posts the swiftest 33.20% CAGR as 5G rollouts, smart-factory programs, and sovereign cloud initiatives converge. China’s AI revenue projections near USD 300 billion by 2030, with edge streaming deemed vital to autonomous manufacturing cells. India’s public-digital-infrastructure drive embeds event streams into tax, identity, and payments rails, while Southeast Asian e-commerce platforms rely on real-time personalization to compete for mobile users. Local chipmakers and telcos co-innovate, reducing hardware costs and boosting regional vendor ecosystems, which keeps adoption momentum high.

Regulatory Landscape
Regulation affecting streaming analytics is increasingly shaped by AI governance and data protection rules that influence how real-time pipelines collect, move, and retain event data. In the European Union, the EU AI Act (Regulation (EU) 2024/1689) introduces risk-based obligations that directly affect streaming analytics deployments when AI models are embedded in real-time decisioning or monitoring, particularly for high-risk use cases. Prohibited AI practices apply from 02 February 2025, obligations for general-purpose AI models apply from 02 August 2025, and core obligations for high-risk AI systems become applicable on 02 August 2026, pushing vendors and adopters toward stronger technical documentation, auditability, and pipeline-level controls.
Operationally, the EU AI Act raises requirements that map to common streaming platform features, including data governance, record-keeping, transparency, human oversight, and cybersecurity, and these sit alongside existing GDPR enforcement by national supervisory authorities. In the United States, a June 2026 Federal Register action initiates benchmarking for advanced AI models, with agencies such as NIST and CISA tasked to establish criteria for covered frontier models. While it is not a licensing regime, it increases pressure to demonstrate robustness and security for AI-enabled streaming analytics in production. Across regions, these developments reinforce demand for lineage, immutable event logs, retention controls, and policy-based partitioning for cross-border and sensitive streams, especially in regulated verticals.
Competitive Landscape
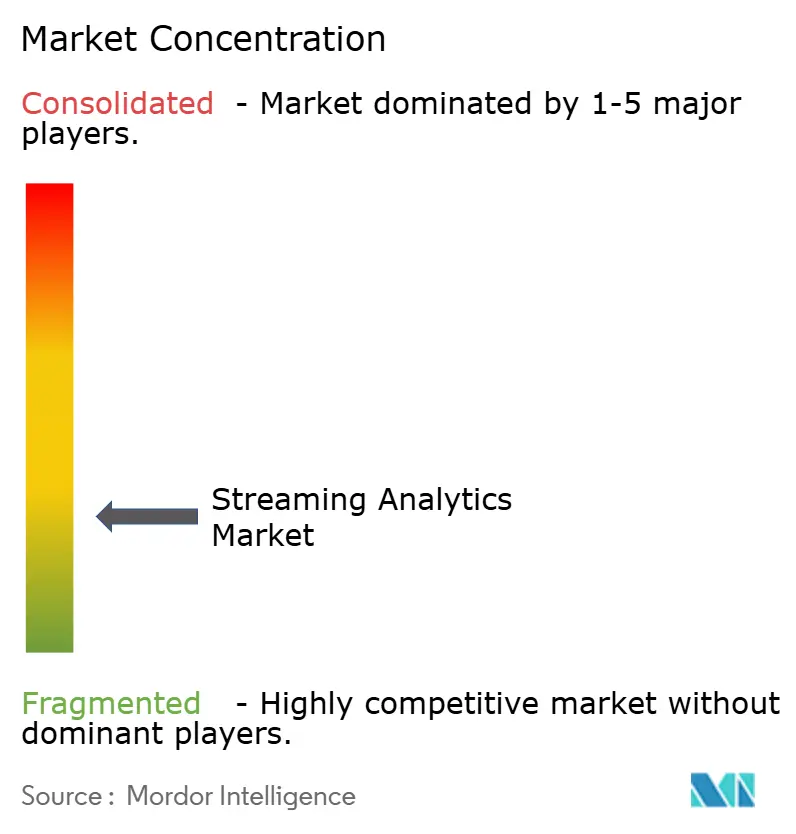
The streaming analytics market remains moderately fragmented. Confluent, Snowflake, Databricks, Amazon Web Services, Google Cloud, Microsoft, and IBM anchor platform offerings, while specialists such as Redpanda, StarTree, and ClickHouse pursue performance or cost niches. Open-source engines—Kafka, Flink, Pulsar—continue to influence RFP decisions, yet the shift to managed services configures competition around operational simplicity.
Acquisitions accelerate capability bundling: Confluent absorbed WarpStream for serverless ingestion, IBM bought StreamSets for hybrid integration, and Qlik integrated Upsolver to widen lakehouse ingestion. Snowflake’s proposed USD 1.5 billion Redpanda deal aims to converge streaming with the data-cloud model. Strategic alliances emerge in parallel; EY’s 2025 pact with Confluent melds consulting reach with a managed platform to target brown-field modernization.
Streaming Analytics Industry Leaders
IBM Corporation
Microsoft Corporation
Oracle Corporation
SAP SE
Amazon Web Services
- *Disclaimer: Major Players sorted in no particular order

Market Opportunities and Future Outlook
A key whitespace is operationalizing AI with live, governed context, where streaming analytics becomes the mechanism to feed LLMs and agentic workflows with fresh signals from databases, CRMs, inventory systems, and machine telemetry. Vendor roadmaps and ecosystem activity point to practical enablers moving into mainstream stacks, including Apache Flink releases in 2026 (Flink CDC 3.6.0 in March 2026 and Flink 2.3.0 in June 2026). These releases expand change-data-capture coverage and operational features that help organizations keep analytical views synchronized with transactional systems, supporting demand for packaged, verticalized real-time context layers and prebuilt connectors that reduce time-to-value for AI-assisted operations and customer engagement use cases.
Industrial and edge deployments also offer a clearer opportunity area, since they combine data-sovereignty needs with cost and latency constraints that favor local processing and streaming control loops. Evidence from industrial streaming IoT implementations on platforms such as Databricks and AWS points to measurable efficiency improvements, including reported 3 to 5 percent reductions in energy per good case and 1 to 2 point lifts in OEE in manufacturer-oriented use cases. That shifts the business case beyond dashboards toward automated interventions. With egress-fee sensitivity rising, there is also room for architectures and platforms that reduce cross-region transfer and decouple storage from compute, including diskless or object-storage-backed streaming designs, alongside managed services that package governance, observability, and cost controls for multi-cloud and hybrid deployments.
Recent Industry Developments
- July 2026: Amazon Web Services introduced AI Agent Skills for Amazon Managed Service for Apache Flink to assist teams in building and operating streaming applications. The capability targets operational friction in Flink workloads, reinforcing the shift toward managed, automation-assisted real-time analytics as enterprises expand event-driven and AI-infused pipelines.
- April 2026: Microsoft made the Fabric Eventstreams SQL operator generally available, enabling SQL-based transformations for real-time data within Microsoft Fabric. This expands access to streaming analytics for teams that standardize on SQL and integrated data platforms, supporting broader adoption beyond specialist streaming engineers.
- February 2026: Oracle announced general availability of GoldenGate Stream Analytics 26ai, adding native AI capabilities such as Oracle Machine Learning and AutoML to score event data. The release tightens the coupling between event capture, real-time processing, and embedded AI, aligning streaming analytics with operational decisioning inside Oracle-centric enterprise estates.


Research Methodology Framework and Report Scope
Market Definition and Coverage
For this study, the streaming analytics market is defined as the revenues earned from software and related services that analyze continuously flowing data in near real time, so users can monitor, detect, and act on events as they happen across digital systems.
Scope exclusions: We exclude generic batch analytics and offline BI that does not process streaming or event data in a continuous manner.
Segmentation Overview
- By Component
- Software
- Services
- By Deployment
- On-Premise
- Cloud-Based
- By End-user Industry
- Media and Entertainment
- Retail and eCommerce
- Manufacturing
- BFSI
- Healthcare and Life Sciences
- Transportation and Logistics
- Telecommunications
- Others
- By Organization Size
- Large Enterprises
- Small and Medium Enterprises
- By Geography
- North America
- United States
- Canada
- Mexico
- South America
- Brazil
- Argentina
- Rest of South America
- Europe
- Germany
- United Kingdom
- France
- Netherlands
- Rest of Europe
- Asia-Pacific
- China
- Japan
- India
- South Korea
- Australia and New Zealand
- Rest of Asia-Pacific
- Middle East and Africa
- Middle East
- United Arab Emirates
- Saudi Arabia
- Turkey
- Rest of Middle East
- Africa
- South Africa
- Nigeria
- Rest of Africa
- Middle East
- North America
Data Sources, Market Sizing, and Validation
Desk Research
Desk research was used to set the market context and to anchor our assumptions to public, explainable data series. We relied on sources such as US Census Bureau ICT indicators, OECD digital economy statistics, ITU connectivity metrics, World Bank macro series, and IEEE and ACM research libraries for streaming and event processing trends.
To shape the vendor and customer landscape, we also reviewed public company filings, earnings decks, product documentation, reputable press coverage, and selected public datasets on cloud adoption and data center expansion. In parallel, we used paid subscriptions focused on company financials and intelligence, news and financials, and patent databases to cross-check revenue direction, product positioning, and innovation intensity. These examples are not exhaustive, and many other public sources were reviewed to collect, validate, and clarify data points during the work.
Primary Interviews and Surveys
Primary work was used to stress-test scope, pricing logic, and adoption timing across industries that generate high-velocity data. We spoke with a mix of solution providers, system integrators, and enterprise users across APAC, EMEA, and the Americas, so gaps from desk findings could be closed and the final assumptions triangulated against real buying and rollout patterns.
Distribution of primary research fieldwork respondents
| Company type | Respondent position | Region |
|---|---|---|
| Top tier: 29% | CXOs: 14% | APAC: 40% |
| Mid tier: 49% | Functional/Unit leaders: 33% | EMEA: 37% |
| Smaller Players: 22% | Managers: 53% | Americas: 23% |
Market-Sizing & Forecasting
Market sizing starts with a top-down demand pool build that links streaming analytics spend to broader enterprise analytics and data infrastructure budgets, and then narrows it using adoption and usage markers that are typical for event-driven workloads. When the data gets filtered through deployment preference shifts and workload intensity, the market total is reached in a way that can be explained and repeated.
To keep the model grounded, we used inputs such as cloud versus on-premise mix, the spread of real-time use cases (fraud and risk monitoring, network optimization, and operational monitoring), enterprise digitization pace, data generation and ingestion growth, and typical software versus services shares. These variables influence how many organizations buy streaming analytics, how much capacity they run, and how pricing moves as deployments scale.
For forecasting, scenario analysis was used to reflect differences in modernization speed across regions and industries, and the scenarios were tuned using expert views on AI-assisted analytics, managed cloud offerings, and compliance-related spending. Bottom-up checks were then run on a selective basis, using sampled pricing ranges and plausible customer counts from interviews, plus channel and partner feedback, so totals could be adjusted when the top-down output looked too high or too low. Where a segment had thin public data, we applied conservative penetration steps and validated the direction with follow-up calls rather than forcing a precise roll-up.
Data Validation & Update Cycle
Before finalizing numbers, outputs are compared with independent signals such as cloud migration pace, enterprise software spending trends, and the visibility of real-time analytics in regulated use cases. If a value breaks expected patterns by region, deployment type, or growth step, the assumptions are revisited and the calculations re-run, followed by an internal peer review before sign-off.
The report is refreshed annually, and interim updates are made when material events change adoption or pricing assumptions. Before delivery, we complete a fresh scan of key indicators and re-contact sources when needed, so clients receive a current view that stays traceable to clear variables and simple checks.
Mordor Intelligence's Streaming Analytics Market Estimate Compared With Other Published Estimates
Published market sizes for streaming analytics can vary a lot, even when the topic name sounds identical. The main reasons are usually differences in what gets counted as streaming analytics revenue, which year is treated as the current base, and how fast price and adoption are assumed to move.
The main gap comes from how adjacent areas are treated, where Mordor Intelligence counts only streaming or event-driven analytics software and related services, and avoids folding in broader data integration or general BI revenue unless it is tied to continuous, real-time stream processing. Additional spread can also come from how cloud consumption is converted into revenue, whether services are fully included, and whether optimistic scenarios are used without being rechecked against adoption signals from interviews and public indicators.
Benchmark comparison
| Source | Market Size | Gaps in Research Methodology |
|---|---|---|
| Mordor Intelligence | USD 43.19 B (2026) | |
| Industry Publisher A | USD 22.00 B (2025) | Uses an earlier base year and a narrower revenue capture in some cases, which can undercount managed streaming features bundled inside broader cloud analytics and platform subscriptions. |
| Global Publisher B | USD 41.84 B (2025) | Starts from a different current year and applies a longer forecast window, and it may include a wider set of analytics and platform revenues that sit next to streaming workloads, which shifts the total upward. |
The spread across sources is mostly explained by scope edges, base-year choice, and how cloud consumption and bundled software are converted into market revenue. By keeping the inputs tied to observable adoption signals and using repeatable checks on pricing and penetration, our estimate stays practical to audit and easier to compare across years.


Key Questions Answered in the Report
What is the current size of the streaming analytics market?
The streaming analytics market stands at USD 43.19 billion in 2026 and is projected to reach USD 175.55 billion by 2031.
Which deployment model is growing fastest?
Cloud deployment leads with a 33.40% CAGR because managed services simplify scaling and maintenance compared with on-premise options.
Why is media and entertainment the largest end-user segment?
Streaming platforms rely on real-time viewer telemetry to personalize content and price ads, driving a 35.20% revenue share in 2025 and a 33.60% CAGR through 2031.
What are the top growth drivers for streaming analytics?
Generative-AI-infused pipelines, high-performance edge chips, low-code workbenches, and event-driven architectures collectively add more than 24% to forecast CAGR.
Page last updated on:





