
Technology, Media and Telecom
5th MayAccelerating Additive Manufacturing Adoption in India
3 Min Read
The Multichannel Analytics Market is Segmented by Component (Solution, Services), by Deployment (Cloud, On-Premises), by Enterprise Size (SMEs, Large Enterprises), by End-User (Retail and E-Commerce, BFSI, and More), by Application (Customer Acquisition and Cross-Sell, and More), by Channel Type (Web and Mobile, Social Media, and More), and by Geography. The Market Forecasts are Provided in Terms of Value (USD).
Market Overview
| Study Period | 2021 - 2031 |
|---|---|
| Market Size (2026) | USD 30.99 Billion |
| Market Size (2031) | USD 72.18 Billion |
| Growth Rate (2026 - 2031) | 18.41 % CAGR |
| Fastest Growing Market | Asia Pacific |
| Largest Market | North America |
| Market Concentration | Medium |
Major Players *Disclaimer: Major Players sorted in no particular order. Image © Mordor Intelligence. Reuse requires attribution under CC BY 4.0. |
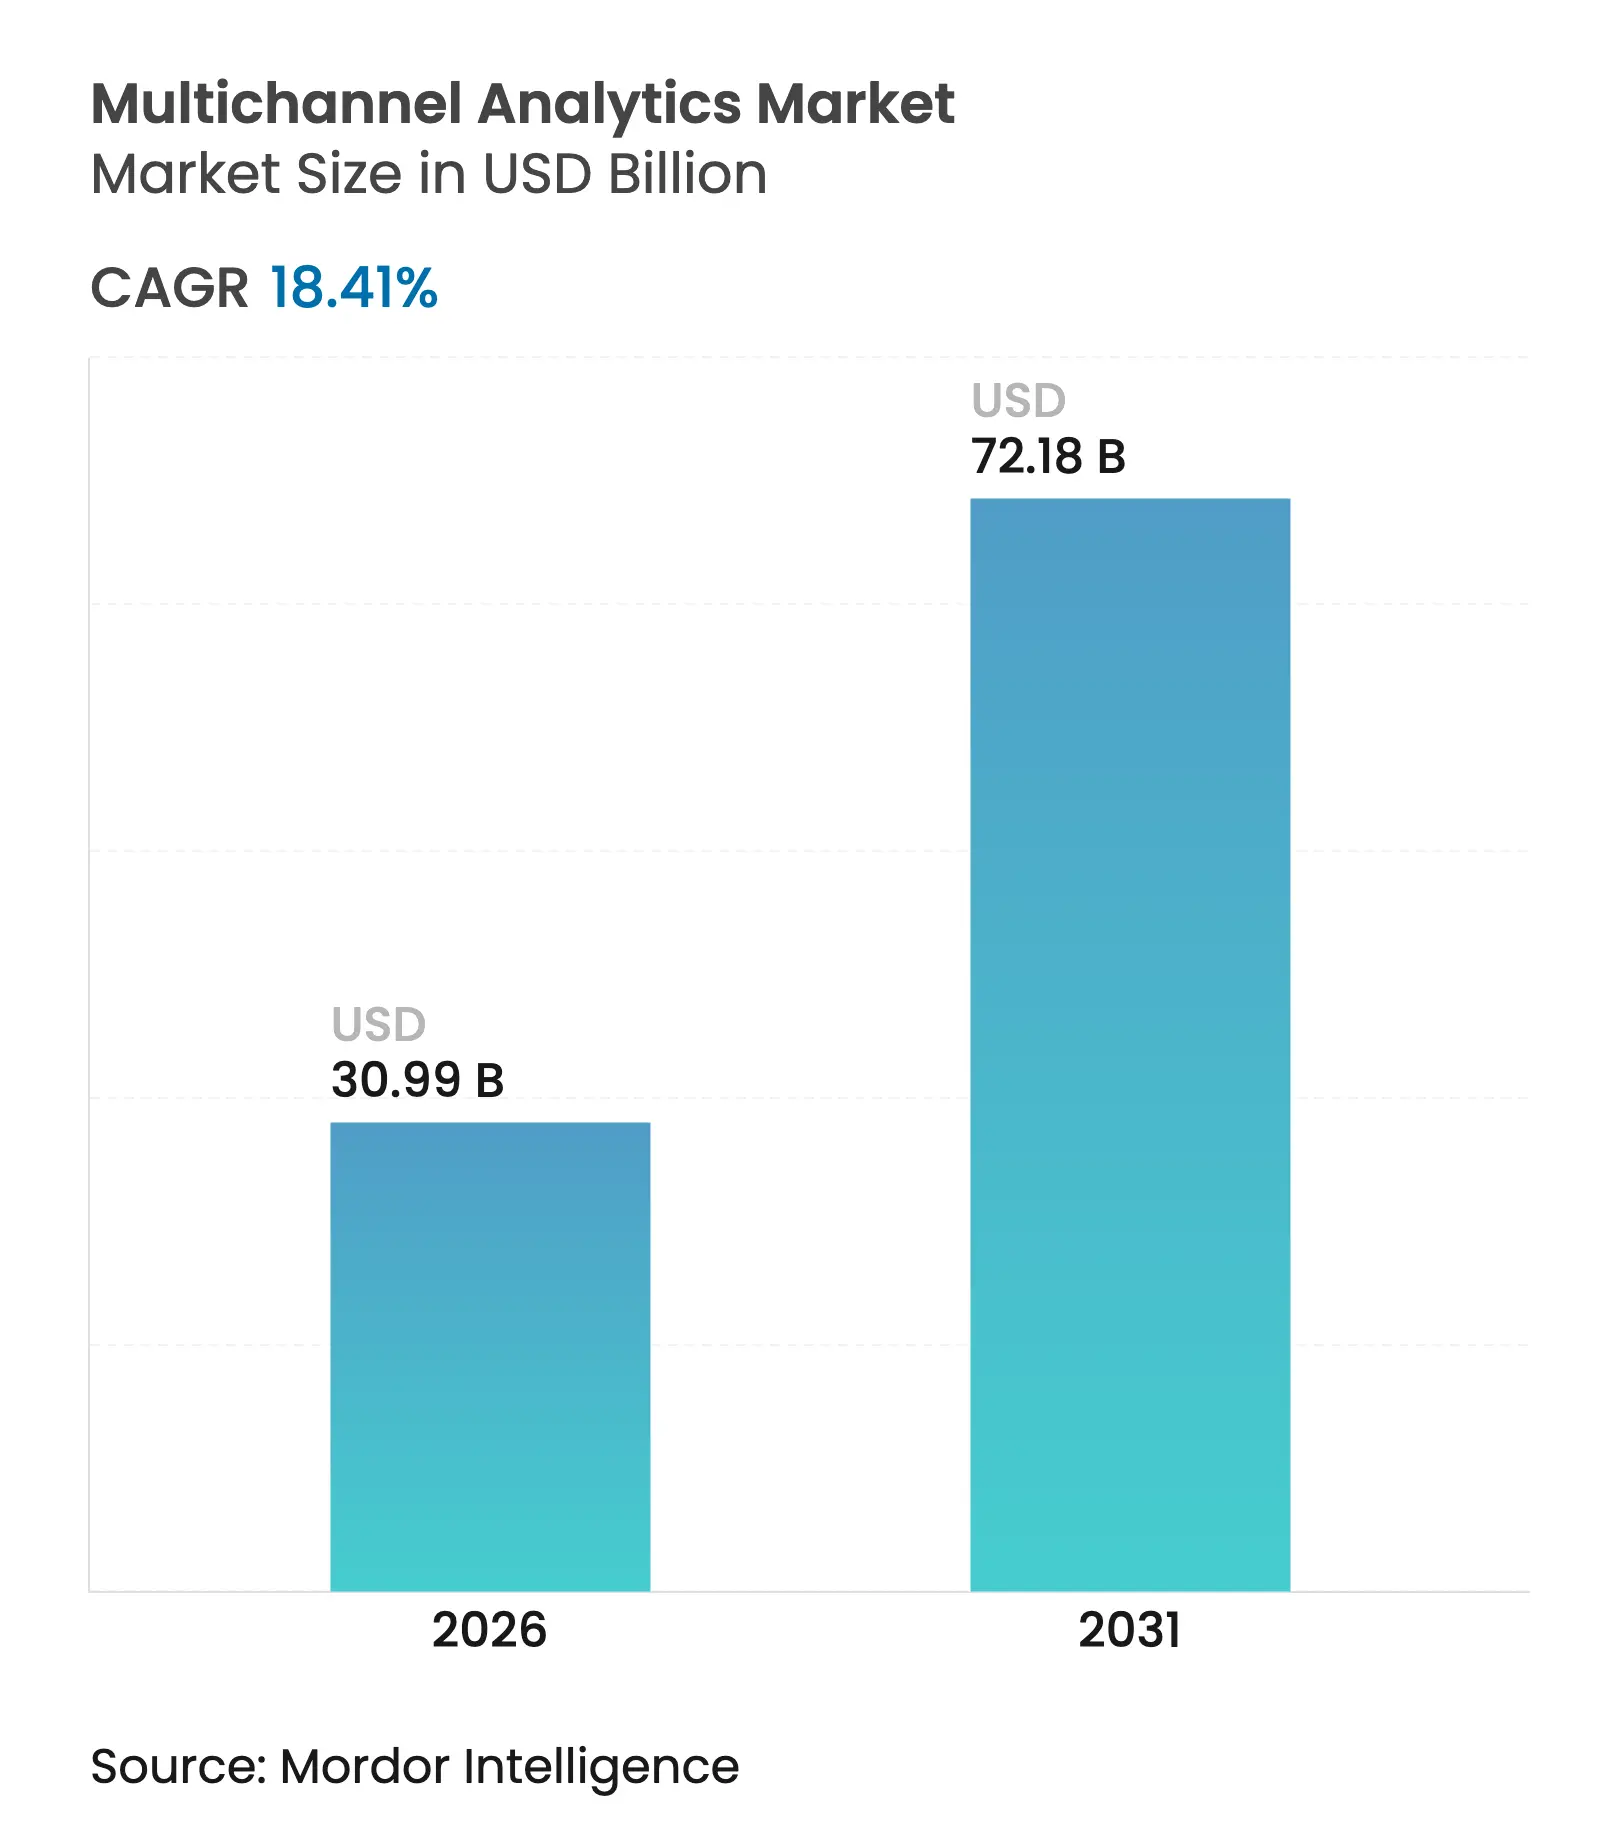
The multichannel analytics market size is expected to grow from USD 26.17 billion in 2025 to USD 30.99 billion in 2026 and is forecast to reach USD 72.18 billion by 2031 at 18.41% CAGR over 2026-2031. The surge is underpinned by rapid adoption of AI-enabled personalization, the move toward cookieless targeting, and the need to unify data from proliferating customer touchpoints. Cloud-native architectures lower time-to-insight, while privacy-preserving frameworks allow firms to comply with tightening data-sovereignty rules.[1]U.S. Federal Register, “Preventing Access to U.S. Sensitive Personal Data and Government-Related Data by Countries of Concern,” federalregister.govCompetitive intensity is rising as vendors embed generative AI to automate journey orchestration and as SMEs gain easier entry through pay-as-you-go pricing. Vertical demand is strongest in retail, healthcare, and BFSI, where cross-channel engagement directly influences lifetime value.
Key Report Takeaways
Note: Market size and forecast figures in this report are generated using Mordor Intelligence's proprietary estimation framework, updated with the latest available data and insights as of 2026.
Drivers Impact Analysis
| Driver | (~) % Impact on CAGR Forecast | Geographic Relevance | Impact Timeline | |||
|---|---|---|---|---|---|---|
Generative-AI-driven hyper-personalization Generative-AI-driven hyper-personalization | +6.6% | Global, early uptake in North America & Western Europe | Medium term (2-4 years) | (~) % Impact on CAGR Forecast:+6.6% | Geographic Relevance:Global, early uptake in North America & Western Europe | Impact Timeline:Medium term (2-4 years) |
Growth of social media & online shopping Growth of social media & online shopping | +4.7% | Global, highest in Asia-Pacific | Short term (≤ 2 years) | |||
Increasing adoption of cloud-native stacks Increasing adoption of cloud-native stacks | +3.8% | North America, Europe, advanced APAC | Medium term (2-4 years) | |||
Real-time CDPs for cookieless targeting Real-time CDPs for cookieless targeting | +2.8% | Global, early adoption in North America & Europe | Medium term (2-4 years) | |||
| Source: Mordor Intelligence | ||||||
Generative-AI-driven hyper-personalization
Generative AI is reshaping the multichannel analytics market by enabling journey orchestration that reacts to intent signals in real time. Early adopters report double-digit lifts in conversion and marketing efficiency as large language and vision models interpret multimodal data streams and trigger next-best actions.[2]Adobe, Suh J., “How Sling TV Disrupted Its Approach to Customer Engagement,” business.adobe.com Retailers and hospitals deploy these engines to recommend products or care pathways at the micro-segment or individual level, accelerating repeat purchases and improving outcomes. As model transparency improves and synthetic data reduces training bias, firms gain confidence to scale deployments across regions. Vendors that integrate model ops, consent management, and low-code interfaces are widening the gap with legacy rule-based systems.
Growth of social media & online shopping
Social commerce and live-stream retail are expanding data volumes that flow into multichannel analytics stacks. In China, e-commerce penetration is projected to hit 28.8% of retail sales in 2025.[3]Lim, Catherine, "2025年中国零售新趋势展望_销售_市场_支出." 红刊财经, sohu.com Brands must track influencer-led discovery, marketplace checkout, and curb-side pickup within a single attribution model, prompting demand for unified customer IDs. Shoppable formats on connected TV add high-fidelity view-through data, pushing analytics vendors to ingest event streams at sub-second latency. Marketers armed with omnichannel journey insights report 40% higher average order values for cross-touchpoint buyers. As western platforms adopt analogous features, the driver’s global relevance intensifies.
Increasing adoption of cloud-native stacks
Containerized microservices and serverless functions sharpen elasticity, allowing enterprises to spin up analytics clusters on demand and shut them down when batch jobs finish.[4]Mokkapati C. et al., “Optimizing Multi-Cloud Deployments,” ijnrd.org This pay-per-use model trims capex and shortens experimentation cycles, particularly for retail flash-sale events and media spikes. Multi-cloud patterns improve resilience and bargaining power while satisfying data-residency requirements. When combined with edge-stream processing, cloud-native designs cut time-to-insight for behavioral triggers from hours to seconds. The driver will remain pivotal as firms re-platform legacy ETL pipelines and embed AI accelerators into cloud data warehouses.
Real-time CDPs for cookieless targeting
Browser deprecation of third-party cookies is accelerating investment in first-party identifier graphs housed in real-time CDPs. The platforms stitch device, CRM, call-center, and in-store data to enable audience activation within milliseconds and comply with consent flags. Early movers in entertainment achieved a 30% uplift in cart conversions by pairing CDP segments with dynamic creative optimization. Financial-services firms value the ability to suppress sensitive audiences instantly, reducing regulatory exposure. As regulatory sandboxes codify differential-privacy standards, CDPs that offer built-in clean rooms gain preference among global brands.
Restraints Impact Analysis
| Restraint | (~) % Impact on CAGR Forecast | Geographic Relevance | Impact Timeline | |||
|---|---|---|---|---|---|---|
High implementation cost & ROI uncertainty High implementation cost & ROI uncertainty | –2.8% | Global, higher impact in emerging markets | Short term (≤ 2 years) | (~) % Impact on CAGR Forecast:–2.8% | Geographic Relevance:Global, higher impact in emerging markets | Impact Timeline:Short term (≤ 2 years) |
Integration complexity with legacy IT Integration complexity with legacy IT | –1.9% | Global, acute in highly regulated industries with legacy systems | Medium term (2-4 years) | |||
| Source: Mordor Intelligence | ||||||
High implementation cost & ROI uncertainty
Total cost of ownership remains a gating factor for mid-sized firms, as licenses, data-engineering labor, and change-management programs accumulate quickly. Many marketers still struggle to attribute revenue uplifts directly to analytics, prolonging payback periods. Phased roll-outs that lock on measurable quick wins—such as email retargeting based on journey abandon signals—can mitigate risk. Vendors that bundle onboarding, pre-trained AI models, and outcome-based pricing are lowering barriers for resource-constrained buyers.
Integration complexity with legacy IT
Fragmented data models and proprietary interfaces in incumbent CRM, ERP, and point-of-sale systems slow analytics adoption, especially in banking and telecom. Enterprises increasingly deploy middleware and API-first layers that decouple source systems from analytics consumption, smoothing upgrades and future cloud migrations. Firms that invest early in unified data governance find faster value realization and reduced operational debt.
By Component: Customer Journey Orchestration Leads Innovation
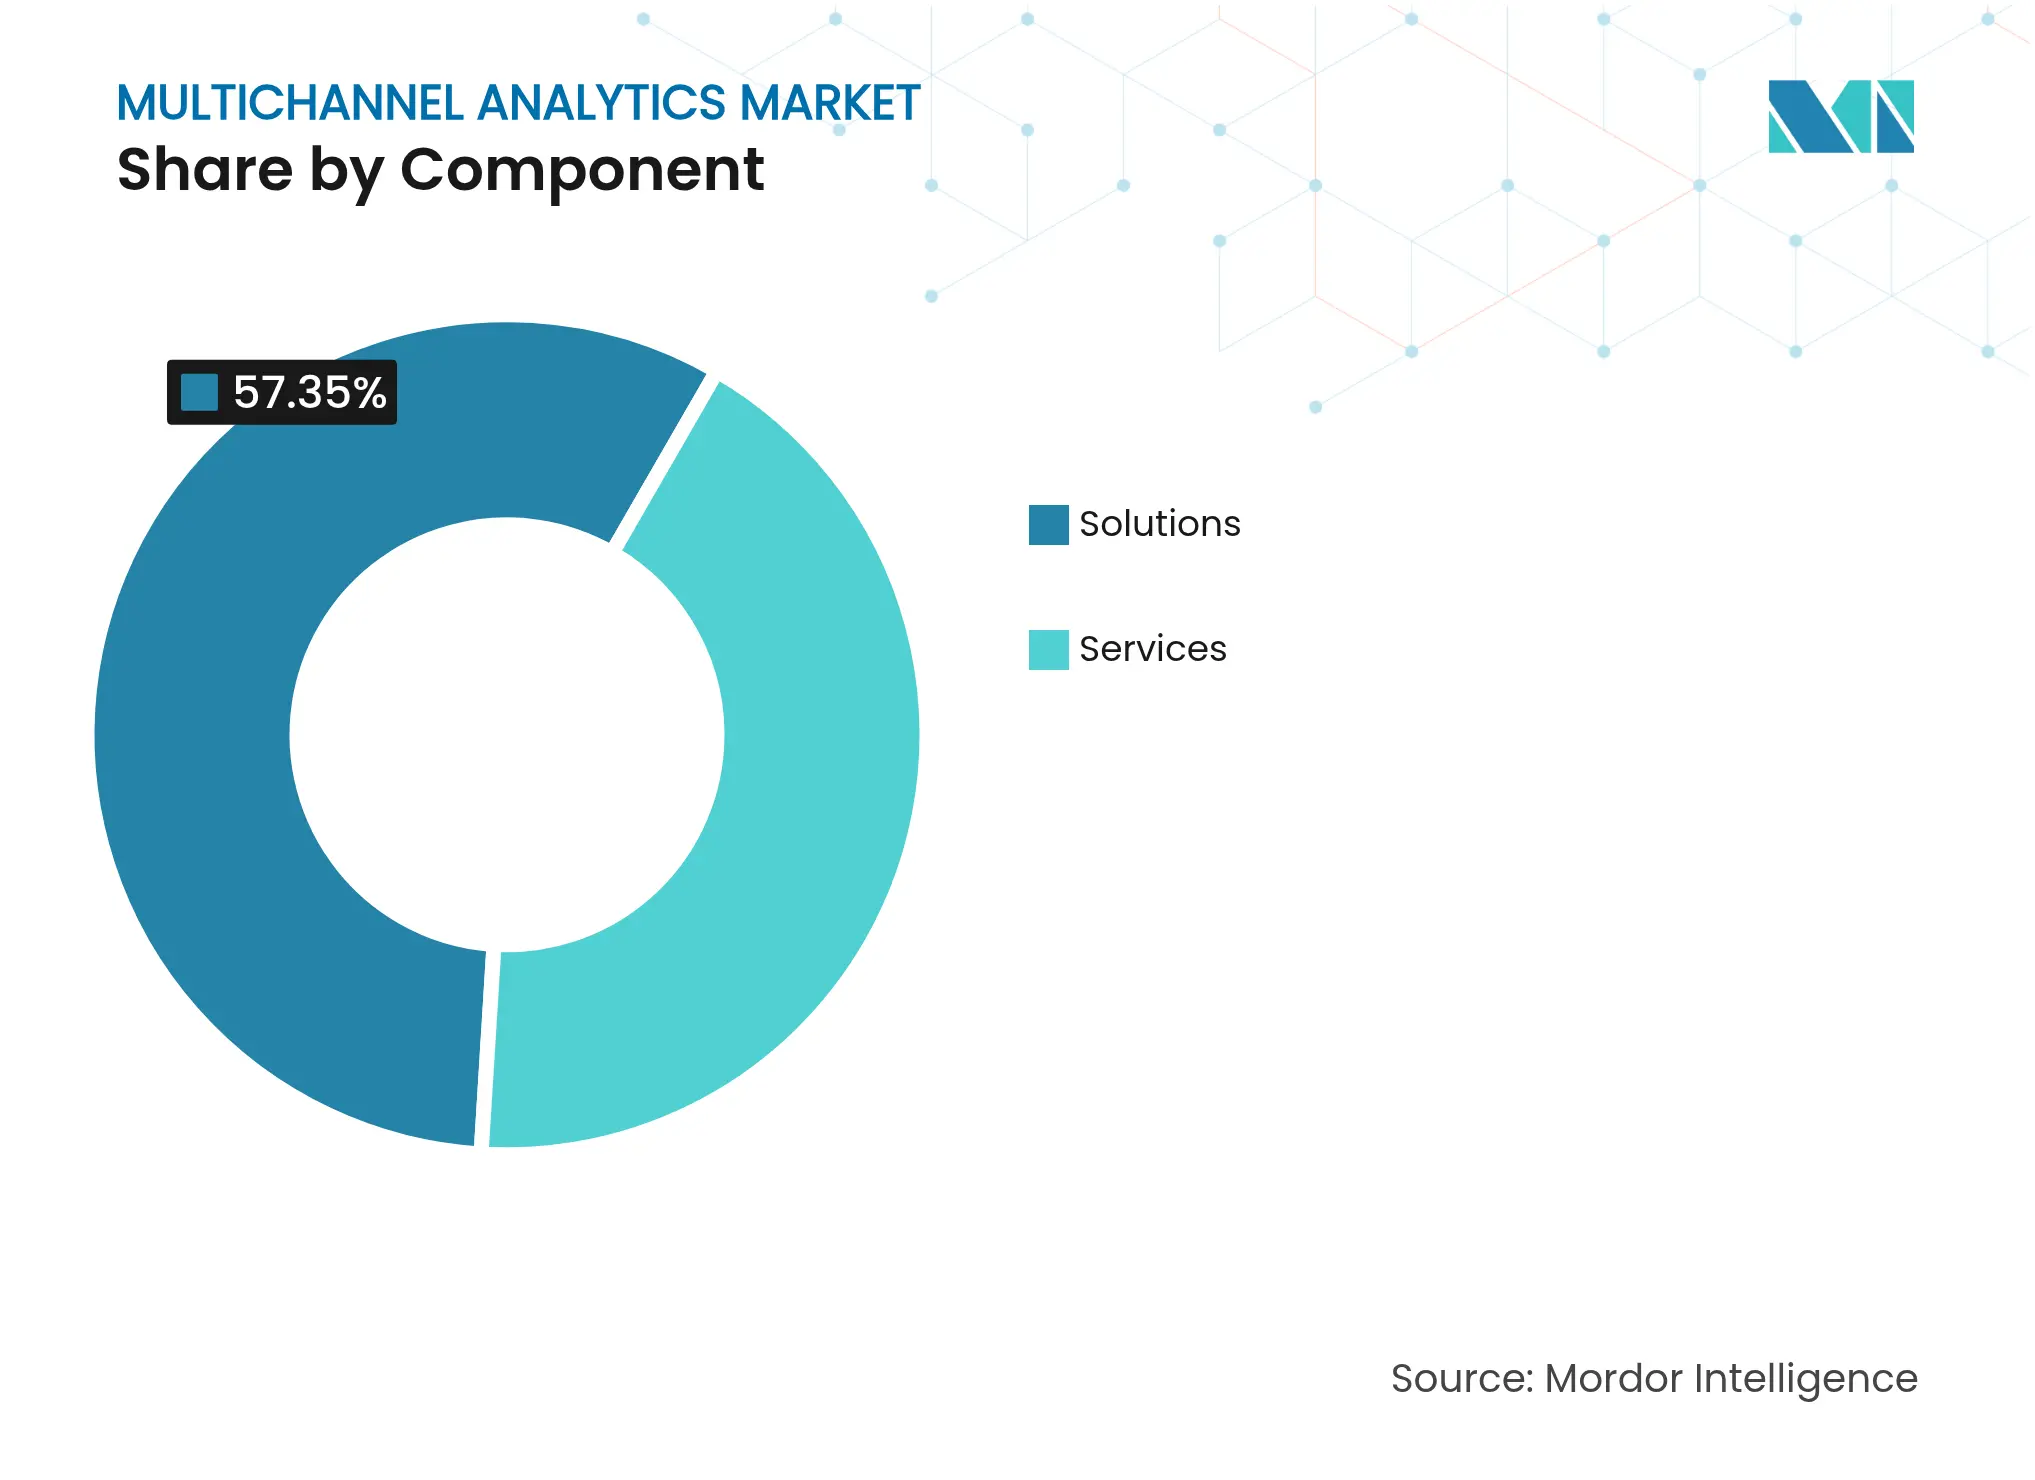
Solutions dominated the multichannel analytics market with 57.35% revenue share in 2025, reflecting a preference for integrated suites that collapse data, decisioning, and activation into one stack. Customer journey orchestration engines are the breakout sub-category, scaling at 16.85% CAGR to 2031 as firms pivot from channel metrics to individual context triggers. Vendors embed AI policies that decide the next best experience across email, app, and call-center, driving upsell and loyalty gains.
Services retained 42.65% share owing to demand for customization, data engineering, and managed optimization. System integrators package domain expertise with low-code accelerators to shorten deployment timelines. Visualization and dashboard modules democratize insights for frontline employees, while query and reporting tools support ad-hoc exploration. The multichannel analytics market continues to reward platforms that expose open APIs and marketplace extensions, fostering ecosystem stickiness.
Note: Segment shares of all individual segments available upon report purchase
By Deployment Mode: Hybrid Cloud Accelerates Growth
Cloud remains the default choice at 70.85% of 2025 spending as firms prize scalability and opex flexibility. Data-sovereignty laws and latency-sensitive workloads, however, are catalyzing hybrid adoption, which is expanding at a 21.2% CAGR. Financial institutions keep PII behind their firewall yet leverage cloud GPUs for model training, illustrating the blended architecture trend. Vendors now offer policy engines that route queries to compliant zones automatically, reducing legal exposure and improving performance.
On-premises deployments persist for organizations with sunk investments or ultra-low-latency requirements. Nevertheless, refactoring monoliths into containerized services inside private clouds allows gradual migration without wholesale re-writes. The multichannel analytics market size attributed to multi-cloud strategies is expected to widen as organizations pursue cost arbitrage and avoid lock-in.
By Enterprise Size: SMEs Embrace Analytics Innovation
Large enterprises accounted for 61.20% of 2025 spend, leveraging dedicated data teams and larger ad budgets to justify enterprise-wide roll-outs. Yet organizational silos and legacy tech can delay ROI, pushing these firms toward center-of-excellence models that standardize tooling and governance.
SMEs are the fastest-growing cohort at 15.7% CAGR due to subscription-based pricing and templated AI playbooks. Cloud credits, accelerator programs, and managed services minimize upfront spend and skills gaps.As data-mesh principles become mainstream, SMEs exploit interoperability to plug specialized apps into core CDPs without vendor lock-in.

Recognized by Experts. Trusted by Leaders.
A trusted intelligence partner to global decision-makers across 90+ countries.


By End-user Industry: Retail Leads, Healthcare Accelerates
Retail & e-commerce led spend with a 26.55% stake, driven by omnichannel inventory optimization and personalized promotions that lift basket sizes. Retailers deploying predictive analytics improved stock accuracy and marketing ROI, fortifying margins in a low-loyalty environment.
Healthcare & life-sciences is rising at an 17.95% CAGR as payers and providers shift from episodic interactions to continuous engagement via portals, wearables, and telehealth. Multichannel analytics supports care-gap alerts and personalized treatment nudges, boosting adherence. BFSI maintains an 18% share for fraud and risk use cases, while media & entertainment taps real-time behavioral scoring to optimize streaming recommendations.
By Application: Personalization Drives Future Growth
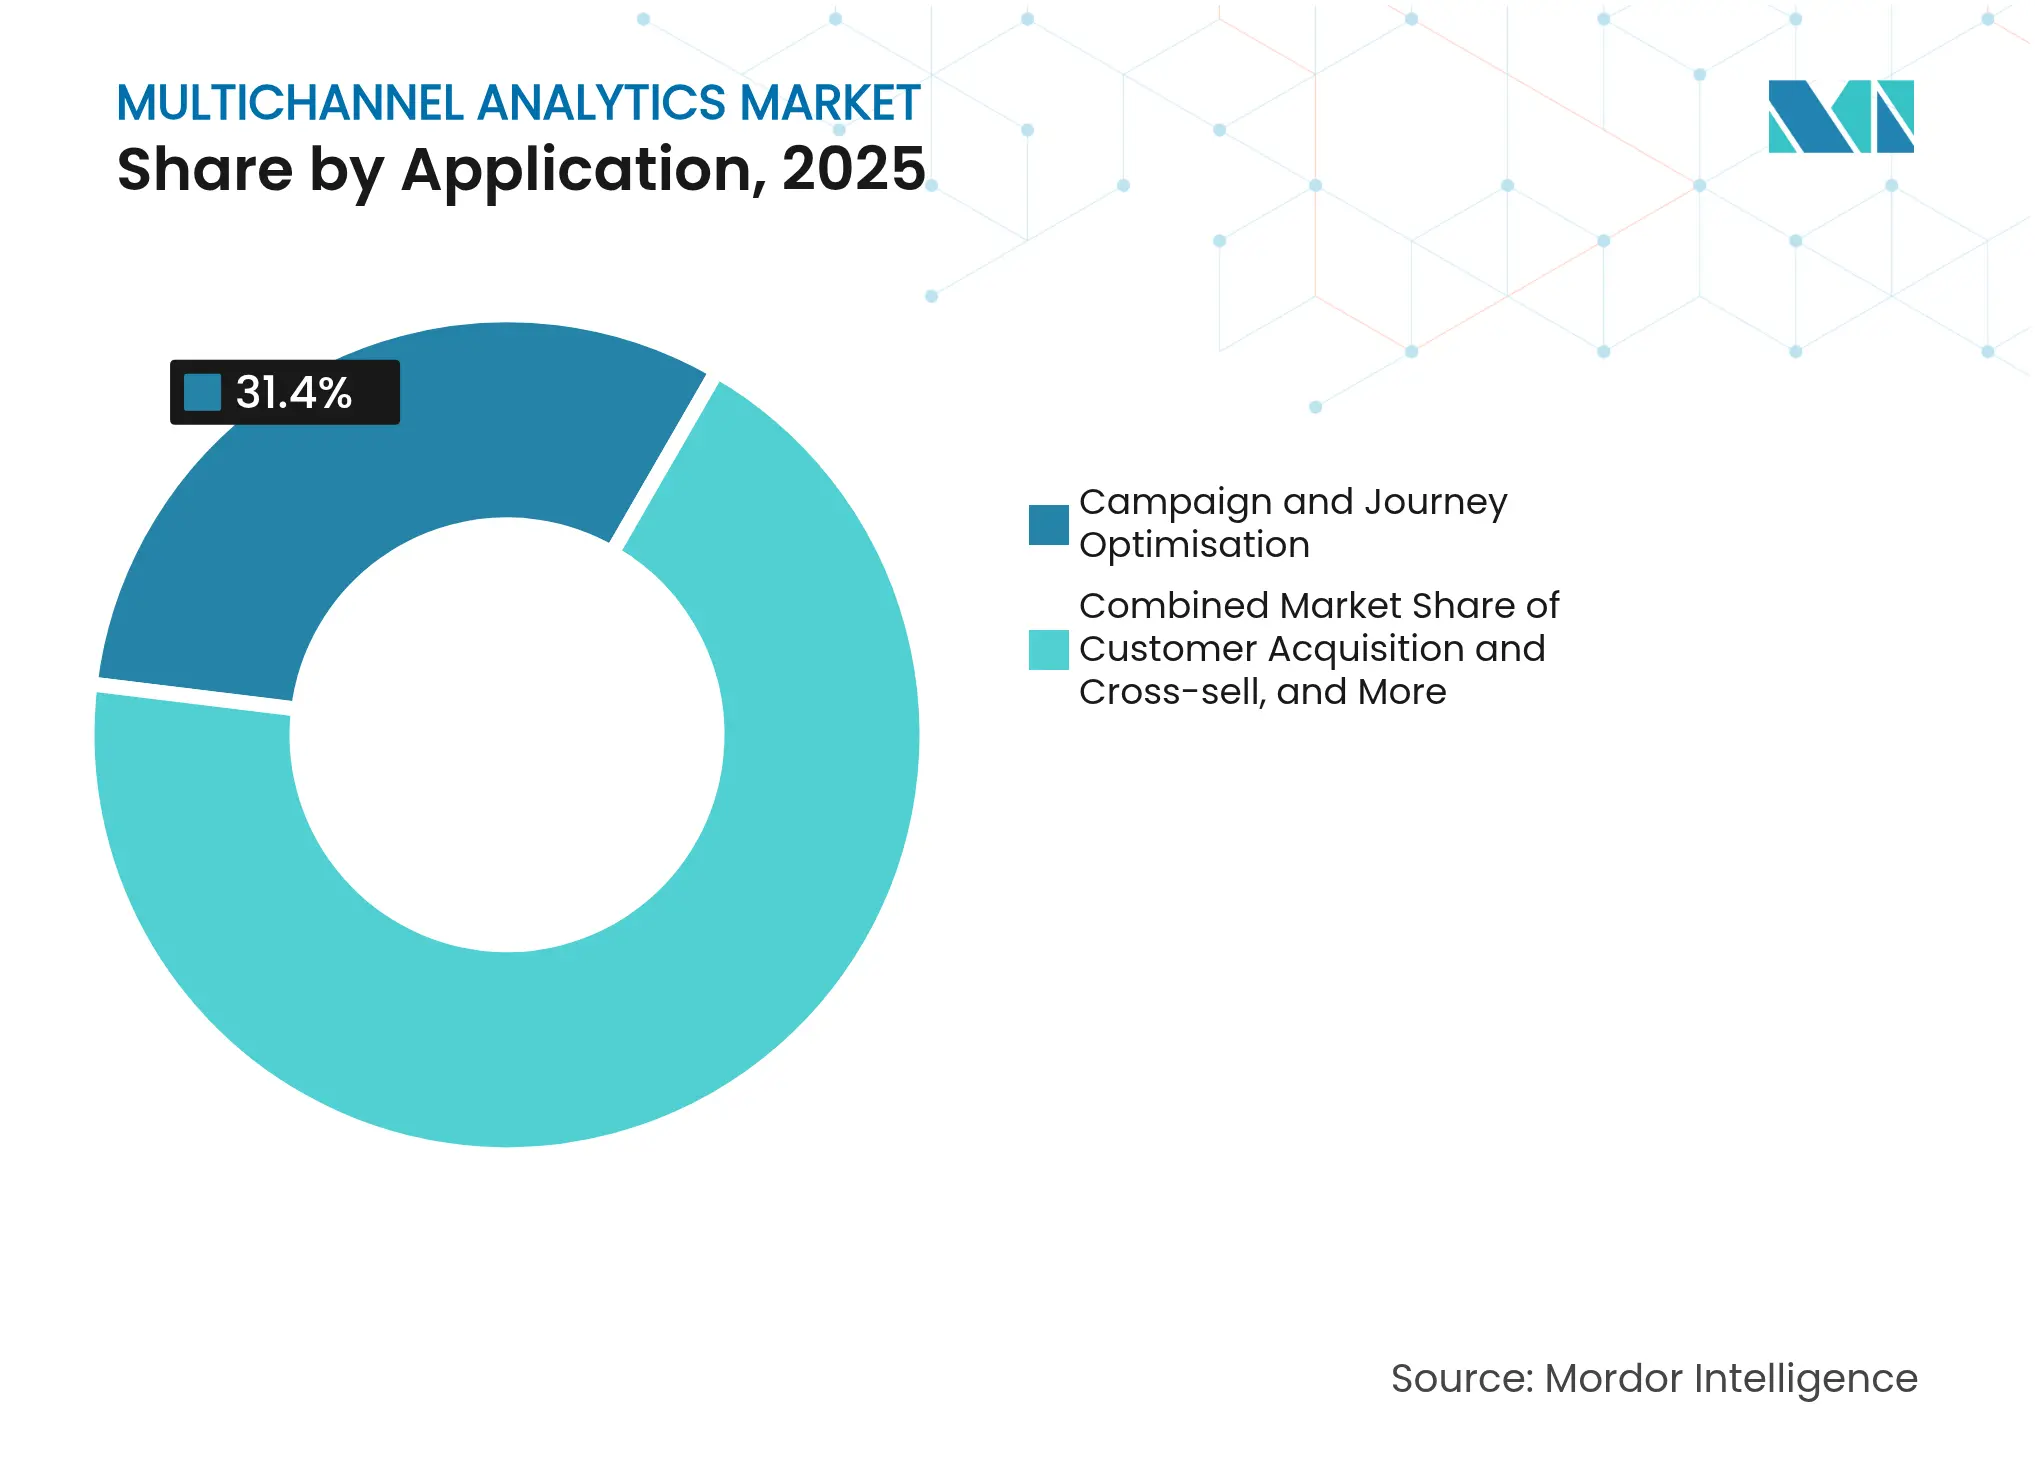
Campaign & journey optimization retained the top slot with 31.40% of 2025 revenues, powered by AI-driven experimentation that tailors creative, timing, and channel mix. Customer acquisition and cross-sell followed at 27.6%, leveraging propensity models to raise conversion among look-alike audiences.
Personalized recommendation engines deliver the highest growth at 21.05% CAGR. Retail adopters see revenue lifts up to 40% when deploying real-time recommenders on product-detail pages. Fraud & risk analytics reduce losses by double digits in omnichannel banking, while churn analytics prioritize retention offers for high-value segments.
Note: Segment shares of all individual segments available upon report purchase
By Channel Type: OTT/Connected-TV Emerges as Growth Leader
Web & mobile interactions provided 40.20% of 2025 data volumes, remaining foundational to the multichannel analytics industry. Social media contributed 33.15%, buoyed by social-commerce checkouts and influencer campaigns that require unified attribution.
OTT/Connected-TV is the fastest-growing channel at 22.9% CAGR as addressable inventory expands and measurement improves. Advertisers connect CTV exposure data with e-commerce sales, proving return on ad spend and reallocating linear budgets. Email continues to drive retention, while in-store IoT devices feed real-time shelf-interaction data into cloud analytics for demand sensing.
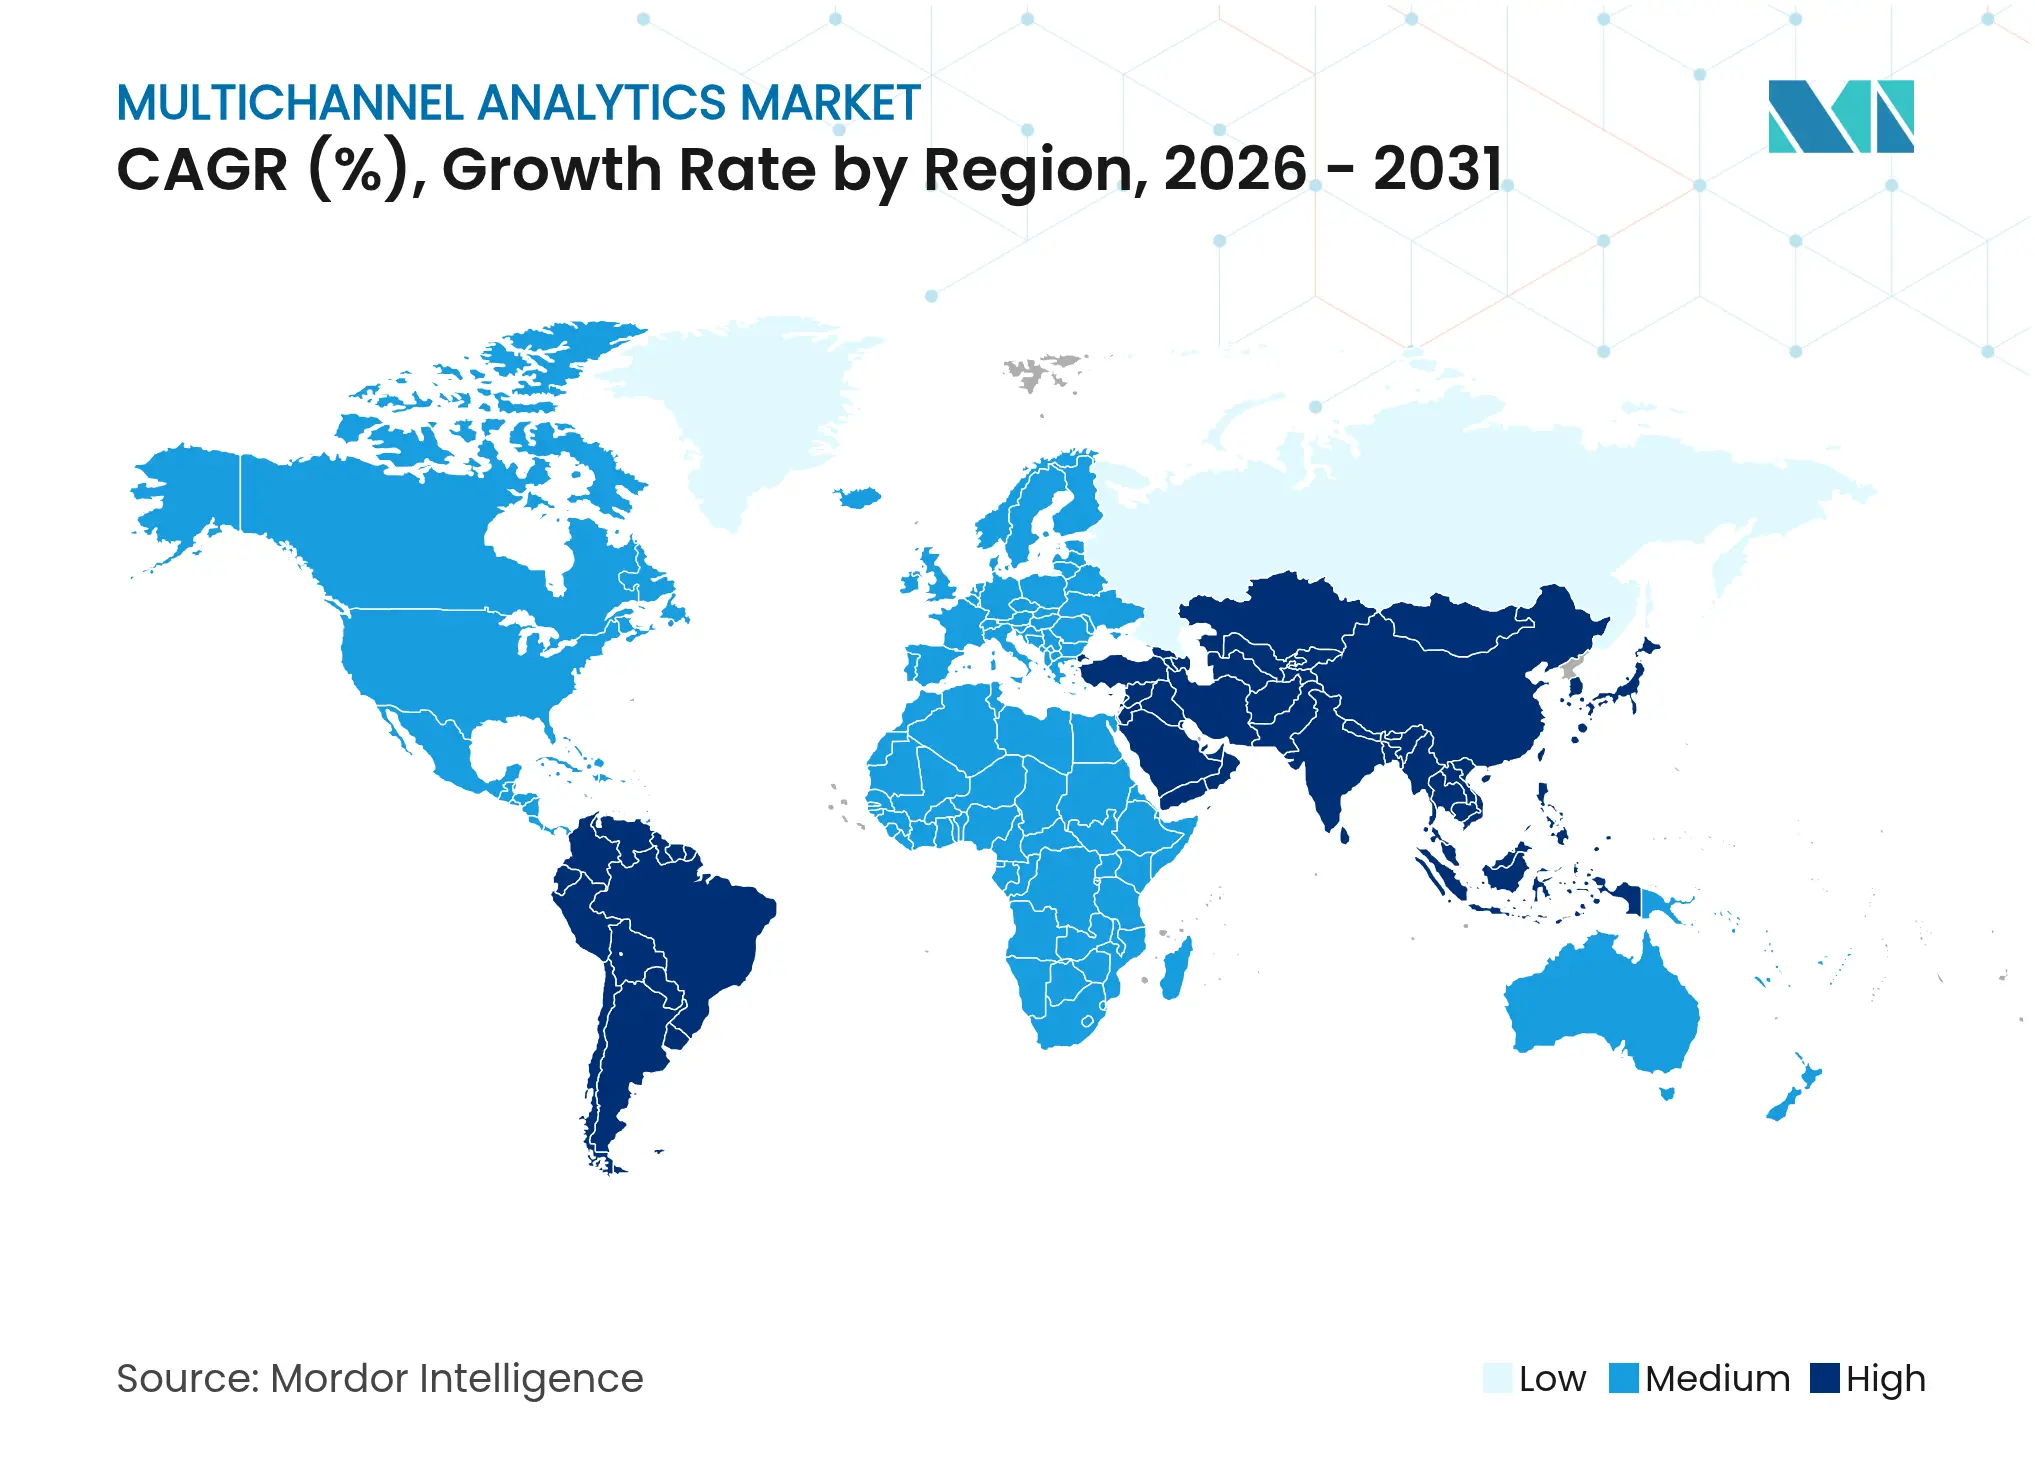
North America comprised 38.10% of 2025 revenue, supported by mature marketing-technology stacks and aggressive first-party data strategies. U.S. enterprises deploy privacy-preserving clean rooms to exploit consented data without violating upcoming sovereignty rules.Canadian retailers localize CDPs to meet provincial privacy acts, while Mexican brands adopt pay-as-you-go platforms to close capability gaps with U.S. partners.
Europe represented 28.25% share, with the GDPR shaping strict consent orchestration and edge anonymization. German SMEs record 13.4 ROI multiples on analytics investments, proving viability despite tighter budgets.The U.K. embraces hybrid cloud to reconcile FCA guidance with performance needs, and French telcos leverage AI to reduce churn in competitive quad-play markets.
Asia-Pacific is set to register a 16.6% CAGR to 2031, propelled by China’s live-commerce boom and Southeast Asia’s mobile-first demographics. Japanese retailers, though earlier in the curve, pilot QR-code-driven in-store personalization as e-commerce penetration lags peers. India’s SME base experiments with low-code dashboards despite data-collection hurdles. Australia and New Zealand adopt multi-cloud for data-locality compliance, while South Korea leverages 5G to stream behavioral data from IoT touchpoints.
The Middle East & Africa is smaller but rapidly modernizing, with GCC banks investing in omnichannel fraud analytics and South African grocers trialing edge-AI shelf monitoring. Diverse regulatory landscapes necessitate fragmented deployment patterns, reinforcing vendor demand for policy-aware orchestration layers.
Market Concentration
The multichannel analytics market shows moderate concentration, with Adobe, Salesforce, Microsoft, and IBM leading end-to-end suites that bundle data, AI, and activation. Adobe’s Q4 2024 revenue grew 11.1%, outpacing peer averages of 8.9%, driven by Experience Cloud cross-sell. Salesforce integrates real-time CDP with Slack to close the loop between insights and frontline action, while Microsoft converges Azure Synapse and Dynamics 365 to shorten data-activation cycles. IBM targets regulated verticals with watsonx-governed AI pipelines.
Specialists such as Amplitude, Mixpanel, and Snowflake differentiate on depth of product analytics, speed, or open-format data sharing. Braze secures a leader position in Gartner’s multichannel marketing hubs for the second year, reflecting strength in cross-channel messaging orchestration. Stackline partners with Amazon to offer multi-retailer attribution, signaling a move from single-channel optimization to holistic commerce measurement. Start-ups focusing on privacy-by-design analytics attract capital as executive awareness of data-risk climbs.
Competitive strategy centers on ecosystem expansion, AI R&D, and compliance alignment. Market leaders buy niche AI firms to fill functional gaps, while challengers forge cloud-provider alliances to gain distribution. Open APIs, marketplace extensions, and usage-based licensing emerge as decisive selection factors for buyers wary of lock-in.

*Disclaimer: Major Players sorted in no particular order
1. INTRODUCTION
2. RESEARCH METHODOLOGY
3. EXECUTIVE SUMMARY
4. MARKET LANDSCAPE
5. MARKET SIZE AND GROWTH FORECASTS (VALUE)
6. COMPETITIVE LANDSCAPE
7. MARKET OPPORTUNITIES AND FUTURE OUTLOOK
Market Definitions and Key Coverage
Segmentation Overview
Detailed Research Methodology and Data Validation
Primary Research
Desk Research
Market-Sizing & Forecasting
Data Validation & Update Cycle
Why Mordor's Multichannel Analytics Baseline Stands Firm
Benchmark comparison
| Market Size | Anonymized source | Primary gap driver | ||
|---|---|---|---|---|
USD 26.17 B (2025) | Mordor Intelligence | - | Anonymized source:Mordor Intelligence | Primary gap driver:- |
USD 26.4 B (2024) | International Consultancy A | Excludes services revenue and uses higher assumed cloud license discounting | ||
USD 19.1 B (2024) | Research House B | Counts web analytics spend only, omits social and in-store data feeds |
Accelerating Additive Manufacturing Adoption in India
3 Min Read
Pricing Strategy for Semiconductor Components
3 Min Read
When decisions matter, industry leaders turn to our analysts. Let’s talk.