Dark Analytics Market Size and Share
Market Overview
| Study Period | 2020 - 2031 |
|---|---|
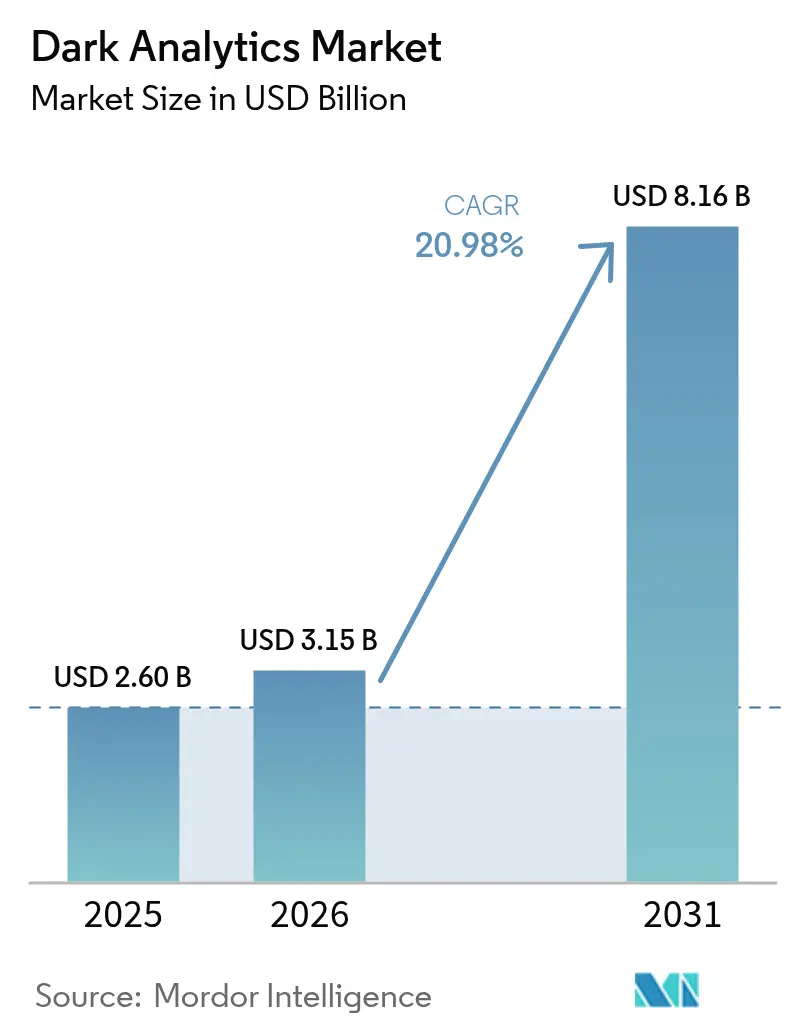
| Market Size (2026) | USD 3.15 Billion |
| Market Size (2031) | USD 8.16 Billion |
| Growth Rate (2026 - 2031) | 20.98% CAGR |
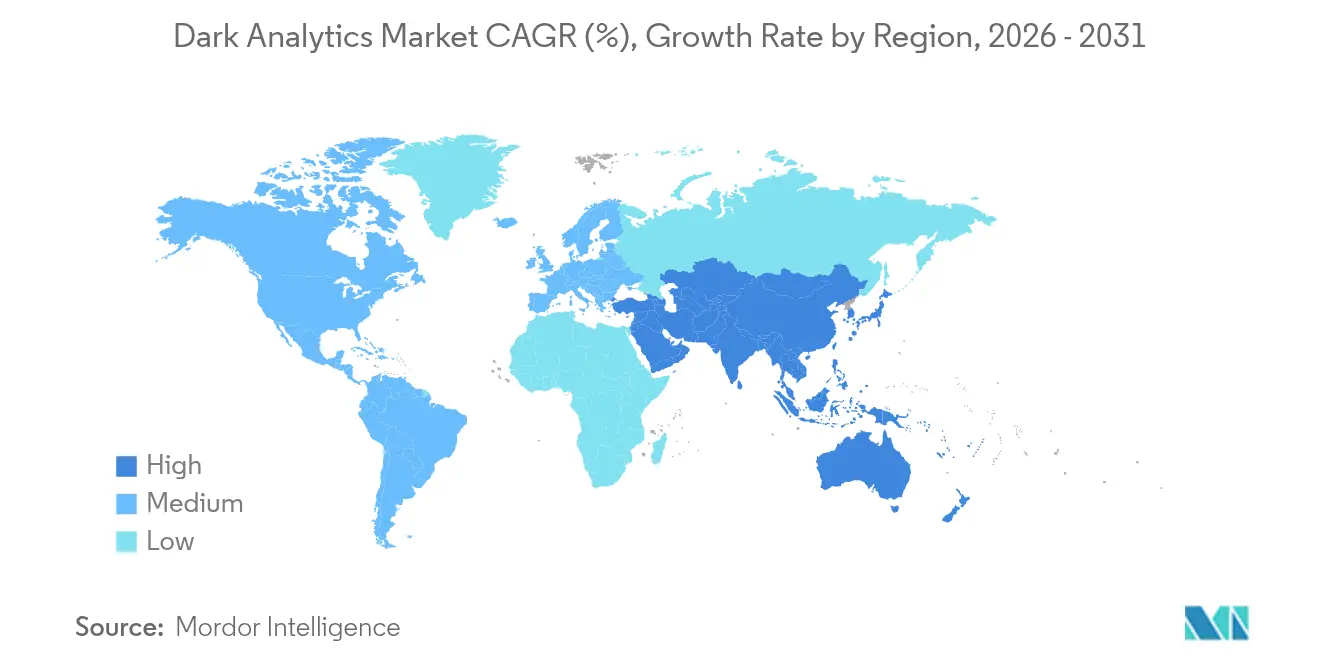
| Fastest Growing Market | Asia Pacific |
| Largest Market | North America |
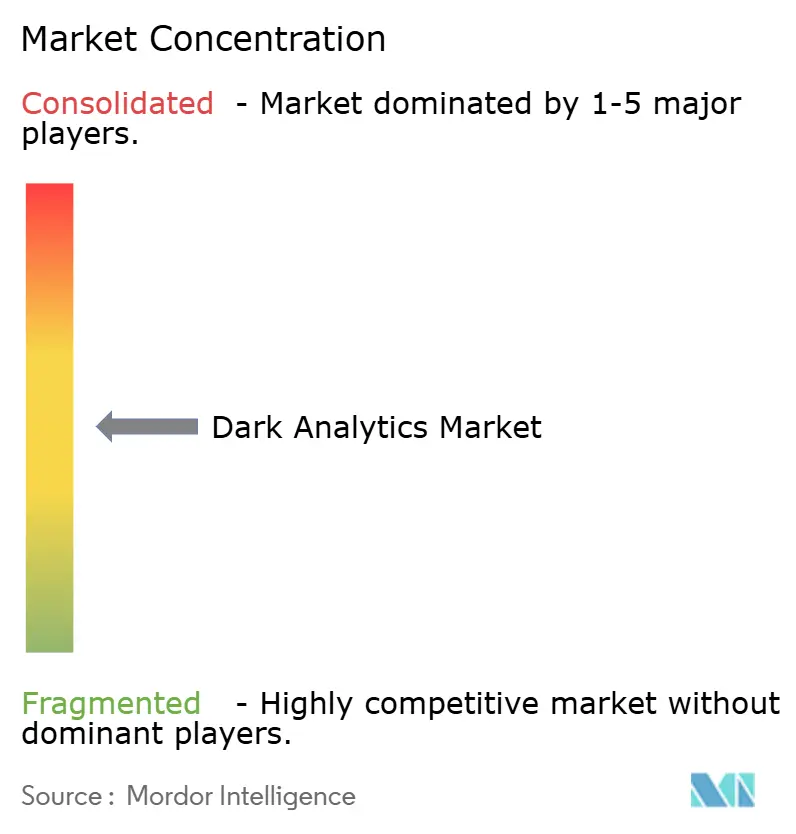
| Market Concentration | Medium |
Major Players *Disclaimer: Major Players sorted in no particular order Image © Mordor Intelligence. Reuse requires attribution under CC BY 4.0. | |
Dark Analytics Market Analysis by Mordor Intelligence
Dark analytics market size in 2026 is estimated at USD 3.15 billion, growing from 2025 value of USD 2.6 billion with 2031 projections showing USD 8.16 billion, growing at 20.98% CAGR over 2026-2031. This growth mirrors enterprises’ realization that nearly 80% of corporate information is still unstructured and therefore invisible to conventional analytics systems. Artificial intelligence, machine learning, and cloud-native platforms now combine to turn these dormant data troves into real-time operational intelligence. Rapid proliferation of Internet-of-Things (IoT) devices, lower cloud-storage costs, and expanding regulatory mandates that require extensive log retention are further accelerating demand for dark-data processing. Competitive momentum is shifting toward providers that embed large language models, vector search, and synthetic-data generation, which together enable faster model training and stronger privacy controls. [1]Pure Storage, “The Relationship Between IoT and Big Data,” purestorage.com
Key Report Takeaways
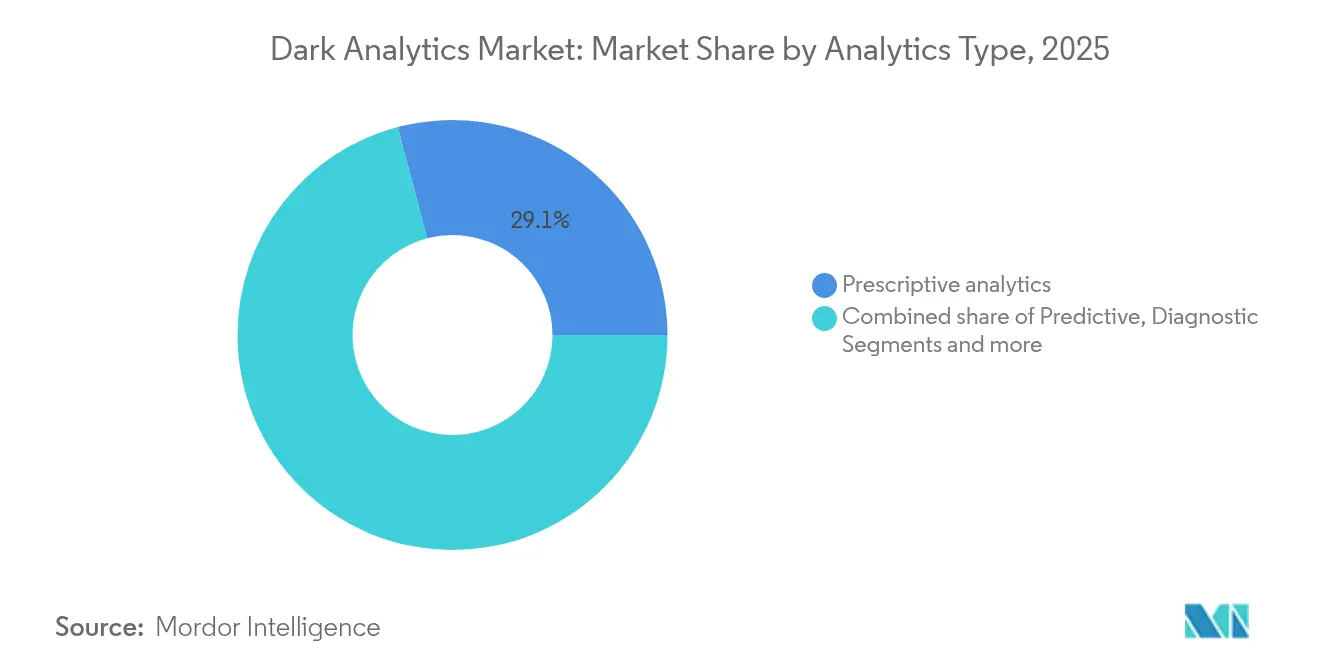
- By analytics type, predictive analytics led with 42.30% of dark analytics market share in 2025, while prescriptive analytics is projected to grow at a 27.2% CAGR through 2031.
- By deployment model, cloud retained 66.20% revenue share of the dark analytics market size in 2025; edge and hybrid environments are expanding at a 25.1% CAGR to 2031.
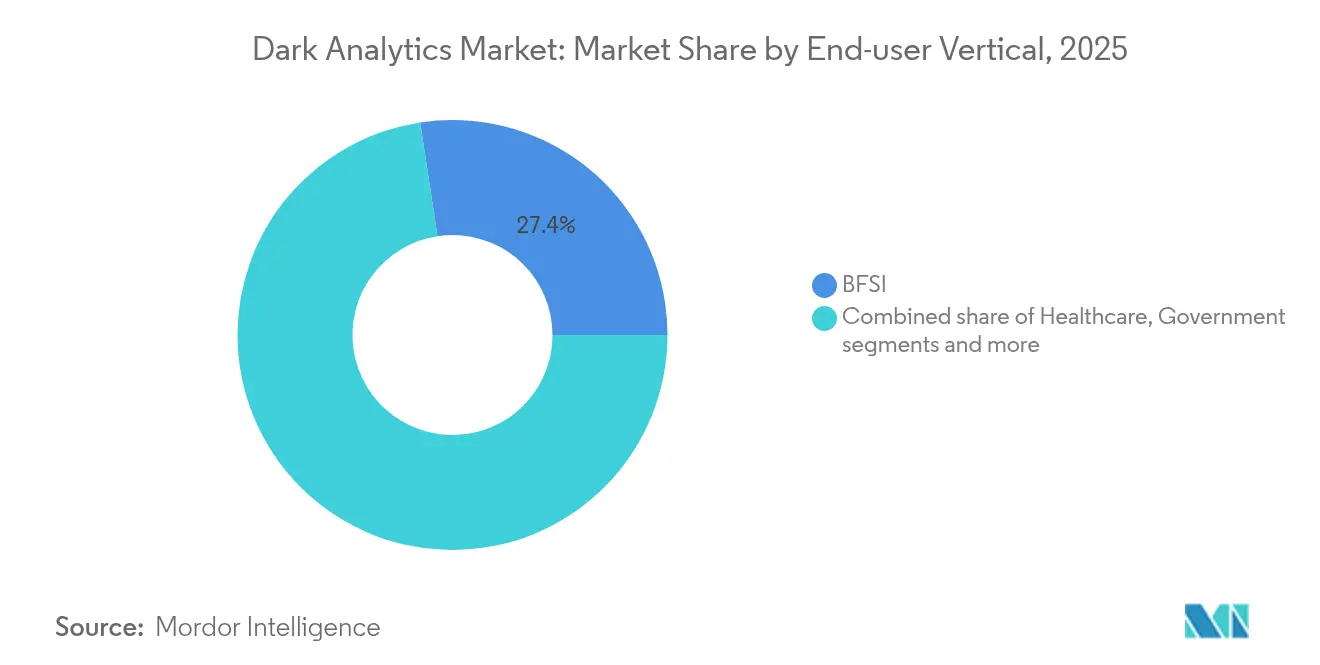
- By end-user, financial services commanded 27.40% share of the dark analytics market size in 2025, whereas healthcare records the fastest 24.1% CAGR to 2031.
- By geography, North America accounted for 36.60% of the dark analytics market size in 2025, while Asia-Pacific is poised to rise at a 23.7% CAGR through 2031.
Note: Market size and forecast figures in this report are generated using Mordor Intelligence’s proprietary estimation framework, updated with the latest available data and insights as of 2026.
Global Dark Analytics Market Trends and Insights
Drivers Impact Analysis*
| Driver | (~) % Impact on CAGR Forecast | Geographic Relevance | Impact Timeline |
|---|---|---|---|
| AI/ML-first security analytics adoption | +6.2% | Global, North America and EU leading | Medium term (2–4 years) |
| Exponential IoT data growth | +5.8% | Asia-Pacific core, spill-over worldwide | Long term (≥ 4 years) |
| Falling cloud-storage costs | +3.4% | Global, strong effect in emerging economies | Short term (≤ 2 years) |
| Zero-trust mandates expanding log windows | +2.9% | North America & EU, expanding into Asia-Pacific | Medium term (2–4 years) |
| Growth of synthetic data to unlock dark data | +2.7% | Technology hubs worldwide | Long term (≥ 4 years) |
| Source: Mordor Intelligence | |||
AI/ML-First Security Analytics Adoption
Security-centric architectures are redefining the dark analytics market as 91% of United States banks now use AI to detect fraud, a practice that could save USD 40 billion in losses by 2027. Chief information-security officers report that advanced threats driven by adversarial AI have made autonomous response indispensable, with 78% acknowledging material impacts on their defensive posture. Financial institutions illustrate the shift through deployments such as MongoDB’s vector-search integration with OpenAI, which supports real-time analysis across structured and unstructured transaction streams. Large language models now interpret intricate security logs, but the rise of shadow AI—72% of generative-AI activity occurs outside official oversight—creates novel exposure risks that only sophisticated monitoring can address. [2]Darktrace, “State of AI Cybersecurity Report 2025,” darktrace.com
Exponential IoT Data Growth
IoT devices are creating zettabyte-scale unstructured data at a 40% CAGR, fundamentally reshaping storage and analytics economics. Manufacturers achieve sizable gains when they harness this dark data: Jaguar Land Rover cut supply-chain query times from three weeks to 45 minutes by applying graph analytics to real-time sensor feeds. By 2025, 75% of enterprise-generated data will be processed outside traditional data centers, a trend that is driving edge adoption. Pairing edge compute with lightweight AI allows millisecond-level pattern recognition in mission-critical settings, including automated industrial machinery and connected healthcare equipment.
Falling Cloud-Storage Costs
An estimated 30–40% yearly decline in cloud-storage pricing, combined with enhanced compression and smarter tiering, is removing the financial barriers that once limited small firms from adopting dark analytics market solutions. Economies of scale now encourage businesses to extend data-retention policies, creating larger historical reservoirs for longitudinal modelling. Yet data-center electricity demand has lifted information-technology carbon emissions to roughly 4% of global totals, prompting climate-focused taxes that could reverse part of the cost advantage and push enterprises toward greener lifecycle management strategies. Synthetic training data is helping contain storage footprints, because it reduces the need to hold every original record while still enriching model performance.
Zero-Trust Mandates Expanding Log Retention Windows
Zero-trust architecture obliges exhaustive recording of user sessions, network interactions, and application events, dramatically growing unstructured log repositories that feed the dark analytics market. Financial institutions face strict Digital Operational Resilience Act (DORA) rules that intensify incident-logging demands, spurring investment in tooling capable of parsing multi-year security telemetry. Natural-language processing is increasingly used to summarize voluminous log files into actionable threat narratives, freeing specialists to focus on remediation rather than manual review. Effective pipeline orchestration and fine-grained data-enrichment are now seen as vital cost-control levers for organizations that must reconcile compliance with budget realities.
Restraints Impact Analysis*
| Restraint | (~) % Impact on CAGR Forecast | Geographic Relevance | Impact Timeline |
|---|---|---|---|
| Skills gap in data engineering & data science | –4.1% | Global, most acute in emerging markets | Medium term (2–4 years) |
| Escalating compliance cost (GDPR, CCPA, DORA) | –3.2% | EU and North America primarily | Short term (≤ 2 years) |
| Rising carbon-footprint taxes on data at rest | –1.8% | EU leading, gradual global adoption | Long term (≥ 4 years) |
| Source: Mordor Intelligence | |||
Skills Gap in Data Engineering & Data Science
Fifty-eight percent of data-center operators struggled to fill engineering roles during 2025, creating a bottleneck in dark analytics market deployment. Modern projects demand multidisciplinary skills that span distributed computing, domain knowledge, and machine-learning operations. Asia-Pacific’s rapid digitization inflates wages for scarce professionals, putting smaller enterprises at a disadvantage. Low-code frameworks alleviate some pressure by simplifying pipeline creation, yet advanced use cases such as multimodal inference still require seasoned talent. Many firms opt for managed platforms to bridge the gap, although this introduces concentration risk and can constrain customization flexibility. [3] IEEE Spectrum, “Data Centers Seek Engineers Amid a Talent Shortage,” spectrum.ieee.org
Escalating Compliance Cost (GDPR, CCPA, DORA)
Data-protection rules oblige companies to map, classify, and potentially delete records on request, a process that costs USD 648,000 per million identities handled. Dark repositories rich in emails, voice notes, and chat transcripts often lack complete metadata, making subject-access requests. DORA further obliges European financial firms to maintain detailed ICT incident archives, adding layers of operational rigor and expense. Companies respond with automated discovery and policy engines, yet the capital needed can delay analytics rollouts and lower the overall return on investment.
*Our forecasts treat driver/restraint impacts as directional, not additive. The impact forecasts reflect baseline growth, mix effects, and variable interactions.
Segment Analysis
By Analytics Type: Prescriptive Tools Shift Decisions from Insight to Action
Prescriptive analytics is scaling at a 27.2% CAGR, underscoring a move from hindsight toward automated decision orchestration. Predictive methods retained the largest 42.30% slice of dark analytics market share in 2025 by providing probabilistic forecasts that feed planning cycles. The dark analytics market size attributable to prescriptive engines could swell to USD 3.2 billion by 2031 if current adoption momentum continues. Natural-language overlays now let business users pose conversational “what-if” questions, which models answer with ranked recommendations. Manufacturers have embraced this evolution, building digital twins that simulate entire supply networks so staff can test adjustments without interrupting production.
Descriptive and diagnostic techniques retain relevance because they uncover baseline patterns and root causes that feed higher-order optimization. Descriptive dashboards are improving through real-time connectors that fuse operational technology data with enterprise resource planning streams, broadening situational awareness. Diagnostic analytics in healthcare combines imaging notes, lab results, and clinician commentary to trace adverse outcomes back to specific process lapses, forming the foundation for later prescriptive interventions. Collectively, these layers reinforce each other, ensuring the dark analytics industry can serve both strategic foresight and daily tactical execution.


By Deployment Model: Edge and Hybrid Designs Anchor Latency-Sensitive Workloads
Cloud maintained a commanding 66.20% of dark analytics market share in 2025, benefiting from continuous service upgrades and pay-as-you-go elasticity. Even so, the segment representing edge and hybrid configurations is forecast to capture an extra USD 1.52 billion of dark analytics market size by 2031 as companies shift sensitive workloads closer to origin points. Demand is strongest in manufacturing, energy, and autonomous systems that require sub-second inference. The edge computing sector itself is expected to reach USD 61.54 billion in 2025, providing abundant processing headroom for analytics models.
Enterprises frequently blend public clouds with private on-premises resources, balancing sovereignty mandates against global scalability. This hybrid coordination raises architectural complexity: data synchronization, model governance, and zero-trust controls must function seamlessly across nodes. Providers now package turnkey edge gateways with embedded GPUs and lightweight orchestration to reduce integration overhead. Early adopters report faster anomaly detection in power grids and real-time adjustments of autonomous-guided vehicles, results that reinforce the economic case for distributed processing.
By Data Source: Unstructured Inputs Fuel Multimodal Intelligence
Unstructured inputs—voice recordings, images, free-text logs, and video streams—represent the fastest-moving slice of the dark analytics market, outpacing structured and semi-structured categories. Over the forecast horizon, unstructured data workloads are projected to form more than half of incremental dark analytics market size gains. Large language models now distil themes from customer feedback, while computer-vision engines spot defects in high-resolution production imagery within milliseconds. Semi-structured telemetry such as JSON logs expands in tandem with IoT rollouts, necessitating schema-flexible storage and real-time parsing.
Synthetic data generation removes privacy barriers by producing statistically representative but non-identifiable records, a capability that the healthcare sector uses to share imaging libraries for algorithm training without exposing patient information SAS. Structured databases keep their foothold in regulatory-heavy fields, supplying ground-truth labels and consistent keys that unify more chaotic inputs. The interplay among source types ensures that analytics pipelines can accommodate any format, enhance resiliency and widen applicability across domains.
By End-User Vertical: Healthcare Adoption Rises on Patient-Centric Use Cases
Financial services led 2025 spending with 27.40% of dark analytics market size, harnessing pattern-recognition to curb fraud, refine credit risk, and fulfil stringent auditing rules. Healthcare, however, is registering the fastest 24.1% CAGR through 2031 as providers mine physician notes, CT scans, and wearable telemetry to predict disease progression and tailor treatment regimens. UnitedHealth Group, for instance, now runs more than 1,000 AI applications, demonstrating the scale at which unstructured clinical data can improve diagnostics and operational efficiency.
Public-sector institutions are also ramping efforts to detect benefit fraud and optimize urban services through integrated sensor grids. Telecommunications carriers leverage call-detail records and network logs to pinpoint congestion hotspots and pre-empt service degradation. Retail chains interpret social-media sentiment alongside point-of-sale data to fine-tune promotions and inventory. Such diverse adoption signals that the dark analytics industry is becoming a foundational layer for data-driven decision culture across virtually every sector.
Geography Analysis
North America captured 36.60% of dark analytics market size in 2025 owing to its mature cloud ecosystem, early AI uptake, and supportive policy environment. Federal agencies emphasize secure data-sharing, encouraging enterprises to adopt privacy-enhanced analytics frameworks. Heavy investments in specialized hardware underline the region’s commitment: Oracle alone earmarked USD 40 billion for Nvidia accelerators to back OpenAI’s Texas facility, a move expected to reinforce regional leadership in AI compute. Canada focuses on natural-resources optimization, while Mexico pushes analytics in automotive and electronics manufacturing to bolster export competitiveness.
Asia-Pacific is advancing at a 23.7% CAGR as governments throughout China, India, and Southeast Asia finance next-generation data centers and talent pipelines. China accounts for 37.5% of regional big-data spending, leveraging sovereign clouds that align with national cybersecurity regulations. India’s IT-services sector exports turnkey analytics solutions worldwide, using cost advantages and deep engineering pools to capture incremental demand. Japan and South Korea concentrate on industrial automation, exploiting edge AI for high-precision robotics and quality assurance. Cross-border data-flow rules remain a challenge, prompting multinationals to deploy localization strategies such as in-country edge clusters.
Europe maintains meaningful share despite stringent GDPR and proliferating AI-governance proposals. The dark analytics market benefits from legacy manufacturing bases across Germany, France, and Italy that seek predictive maintenance to lift asset uptime. DORA regulations are raising resilience standards, thereby increasing demand for advanced analytics that evaluates ICT incidents and supply-chain exposures. The United Kingdom, through its financial-services focus, accelerates adoption of synthetic data for model validation, while Nordic nations pioneer green-data-center practices to reduce analytics-related carbon footprints.
Collectively, Latin America and the Middle East & Africa represent smaller but fast-growing opportunity pools, each characterized by mobile-first consumer behaviour and fintech innovation. Both regions benefit from hyperscale expansions that lower compute costs and broaden access to sophisticated analytics tools. Telecommunications data monetization and public-sector digital identity programs are emerging as primary use cases that could elevate regional penetration in the latter half of the decade.

Competitive Landscape
The dark analytics market is moderately concentrated. Established cloud and software providers have integrated ingestion, storage, vector search, and model-deployment within single platforms, allowing clients to engage multiple data types through unified APIs. At the same time, specialist vendors differentiate on speed or vertical expertise. SAP’s alliance with Databricks converges enterprise resource planning data with Lakehouse architectures, closing gaps between transactional records and exploratory analytics. Oracle’s partnership with Palantir places visualization and model-building atop a secure sovereign-cloud stack aimed at regulated sectors.
Mergers and acquisitions intensify as incumbents add capabilities: Datasite’s purchase of Grata provides AI-driven deal sourcing to complement corporate-finance workflows. Qlik continues consolidating real-time data-integration start-ups to bolster conversational BI and agentic-AI features. Meanwhile, open-source ecosystems such as Apache Iceberg and Delta Lake attract momentum by delivering vendor-neutral governance and performance enhancements. Edge-analytics appliance suppliers compete on ruggedized hardware plus pretrained models tuned to industrial codecs, showcasing how hardware-software co-design can unlock performance in harsh environments.
Security analytics is carving out a distinct sub-segment. Vendors that streamline high-volume log processing gain advantage as zero-trust frameworks swell telemetry footprints. Integration of privacy-preserving synthetic data into training pipelines is another differentiator, especially for healthcare and finance. Pricing pressure drives interest in pay-per-event models that align costs with observable risk reduction. New entrants succeed when they apply proprietary domain models—for example, anomaly-detection algorithms tailored to energy grids or retail payment flows—rather than generic AI toolkits.
Dark Analytics Industry Leaders
IBM
Microsoft
Amazon Web Services
SAP
Palantir Technologies
- *Disclaimer: Major Players sorted in no particular order

Recent Industry Developments
- June 2025: Oracle forms a strategic alliance with Palantir to deliver Foundry and Gotham on Oracle Cloud Infrastructure, targeting commercial and government demand for advanced data visualization and modelling.
- June 2025: Datasite acquires Grata, an AI-native private-market intelligence provider, funded by USD 500 million from CapVest Partners to expand deal-sourcing analytics.
- May 2025: Oracle commits USD 40 billion in Nvidia chips for OpenAI’s Texas data center, reinforcing United States dominance in large-scale AI infrastructure.
- April 2025: Dataminr secures USD 100 million from Fortress Investment Group to scale its real-time AI platform that processes terabytes of public-source data.


Global Dark Analytics Market Report Scope
Dark analytics is the analysis of dark data present in enterprises. Dark data is information that is obtained through various computer network operations but is not utilized in any way, shape, or form. All that businesses stack and store for use in various business operations is just raw data or information in the form of text, tables, and figures.
The dark analytics market is segmented by type (predictive, prescriptive, and descriptive), end-user vertical (BFSI, healthcare, and government), and geography.
The market sizes and forecasts are provided in terms of value (USD million) for all the above segments.
| Predictive |
| Prescriptive |
| Diagnostic |
| Descriptive |
| On-premise |
| Cloud |
| Edge / Hybrid |
| Structured |
| Semi-Structured |
| Unstructured |
| BFSI |
| Healthcare |
| Government |
| Telecommunications |
| Retail and E-commerce |
| Manufacturing |
| Others (Energy, Media, etc.) |
| North America | United States |
| Canada | |
| Mexico | |
| South America | Brazil |
| Argentina | |
| Rest of South America | |
| Europe | United Kingdom |
| Germany | |
| France | |
| Italy | |
| Rest of Europe | |
| Asia-Pacific | China |
| Japan | |
| India | |
| South Korea | |
| Rest of Asia-Pacific | |
| Middle East | Israel |
| Saudi Arabia | |
| United Arab Emirates | |
| Turkey | |
| Rest of Middle East | |
| Africa | South Africa |
| Egypt | |
| Rest of Africa |
| By Analytics Type | Predictive | |
| Prescriptive | ||
| Diagnostic | ||
| Descriptive | ||
| By Deployment Model | On-premise | |
| Cloud | ||
| Edge / Hybrid | ||
| By Data Source | Structured | |
| Semi-Structured | ||
| Unstructured | ||
| By End-user Vertical | BFSI | |
| Healthcare | ||
| Government | ||
| Telecommunications | ||
| Retail and E-commerce | ||
| Manufacturing | ||
| Others (Energy, Media, etc.) | ||
| By Geography | North America | United States |
| Canada | ||
| Mexico | ||
| South America | Brazil | |
| Argentina | ||
| Rest of South America | ||
| Europe | United Kingdom | |
| Germany | ||
| France | ||
| Italy | ||
| Rest of Europe | ||
| Asia-Pacific | China | |
| Japan | ||
| India | ||
| South Korea | ||
| Rest of Asia-Pacific | ||
| Middle East | Israel | |
| Saudi Arabia | ||
| United Arab Emirates | ||
| Turkey | ||
| Rest of Middle East | ||
| Africa | South Africa | |
| Egypt | ||
| Rest of Africa | ||


Key Questions Answered in the Report
What is driving the rapid expansion of the dark analytics market?
The main catalysts are exploding IoT data volumes, declining cloud-storage costs, and regulatory mandates that require detailed log retention, all of which push enterprises to unlock value from previously untapped unstructured data.
Which analytics type is growing fastest within dark data initiatives?
Prescriptive analytics leads with a 27.2% CAGR through 2031 because it transforms insights into real-time, actionable recommendations that optimize business processes.
Why are edge and hybrid deployments gaining momentum?
They allow latency-sensitive workloads to run nearer to data sources, meeting sovereignty requirements and enabling millisecond-level inference in manufacturing, energy, and autonomous-system applications.
How do regulations such as DORA affect dark analytics adoption?
While they raise compliance costs, these regulations also expand log-data pools that analytics platforms can mine for resilience insights, thereby creating both a challenge and a growth opportunity.
Which region will lead future growth?
Asia-Pacific is expected to post a 23.7% CAGR to 2031, driven by large-scale digital-transformation programs in China, India, and Southeast Asia and by substantial state investment in data-center infrastructure.
How can organizations overcome the talent shortage in data engineering?
Many firms adopt low-code platforms, partner with managed-service providers, and invest in training to build multidisciplinary teams that can handle complex dark-data pipelines and machine-learning operations.
Page last updated on:


