
Clickstream Analytics Market Size and Share
Market Overview
| Study Period | 2020 - 2031 |
|---|---|
| Market Size (2026) | USD 2.08 Billion |
| Market Size (2031) | USD 2.77 Billion |
| Growth Rate (2026 - 2031) | 5.83 % |
| Fastest Growing Market | Asia Pacific |
| Largest Market | North America |
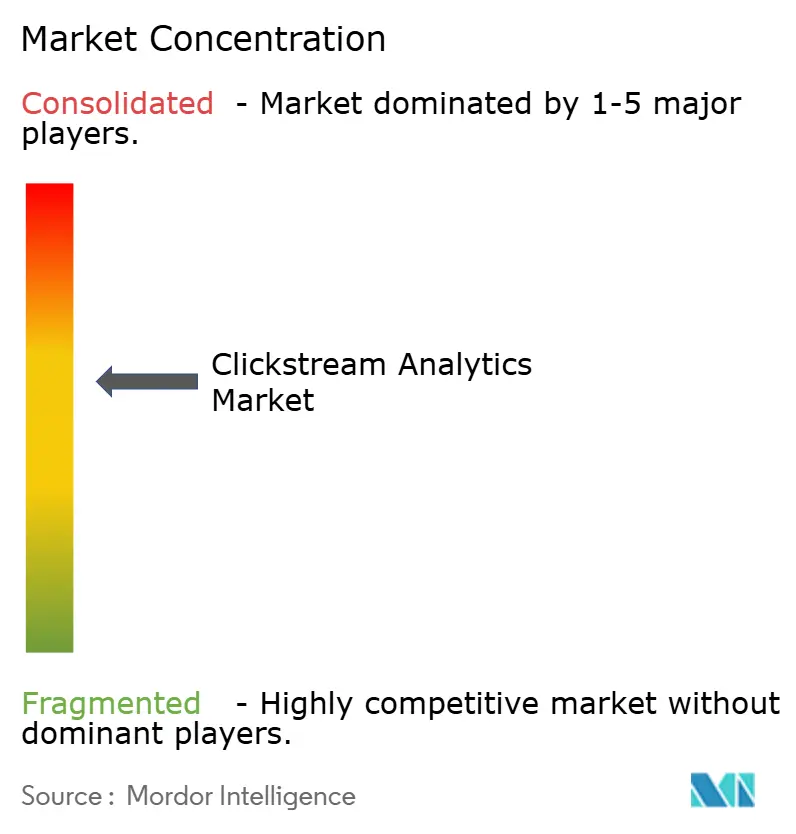
| Market Concentration | Medium |
Major Players *Disclaimer: Major Players sorted in no particular order Image © Mordor Intelligence. Reuse requires attribution under CC BY 4.0. | |
Clickstream Analytics Market Analysis by Mordor Intelligence
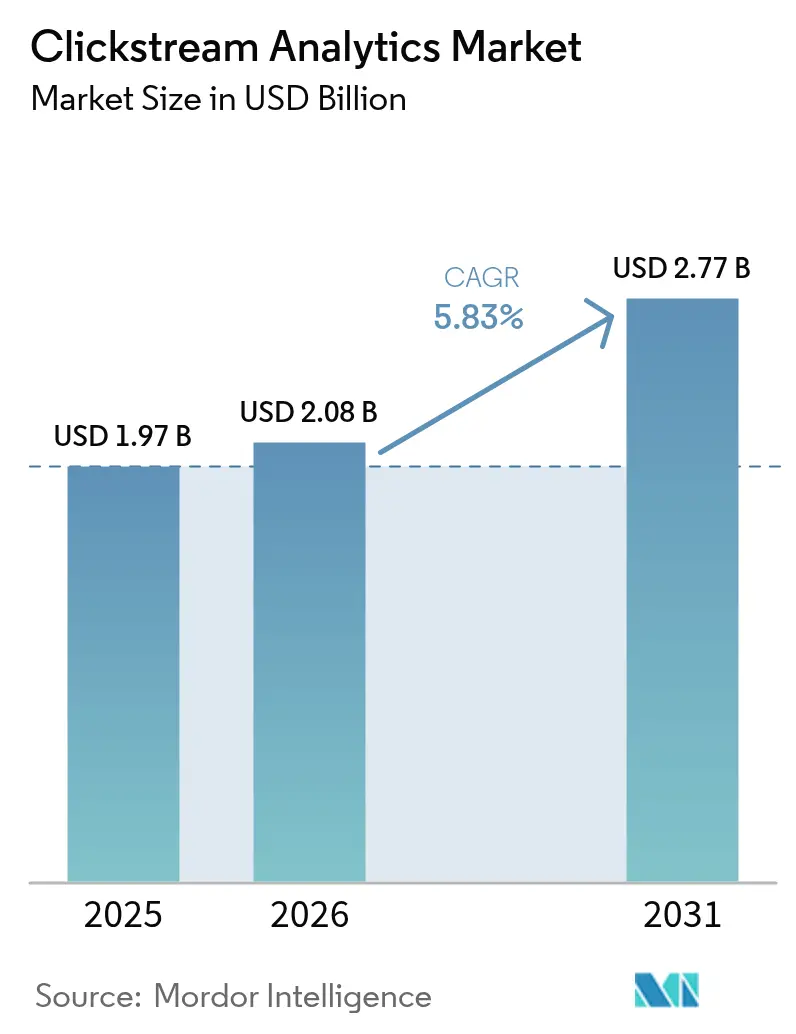
The clickstream analytics market size was valued at USD 1.97 billion in 2025 and estimated to grow from USD 2.08 billion in 2026 to reach USD 2.77 billion by 2031, at a CAGR of 5.83% during the forecast period (2026-2031). Adoption is steadily shifting from simple page-view counters to AI-native customer intelligence platforms that ingest billions of events in real time. Growth is reinforced by cloud-native architectures that compress deployment cycles, privacy-first data strategies that future-proof measurement frameworks and rapid advances in machine-learning models that convert raw behavioural data into predictive insights. Vendors increasingly bundle identity resolution, consent orchestration and edge processing in a single stack, positioning the clickstream analytics market as a core pillar of enterprise experience clouds. Strategic buyers are extending into the space through acquisition, creating a balanced competitive environment where innovation and compliance carry equal weight. [1]Adobe Press Release, “Experience Cloud AI Agents Drive 1,300% Retail Traffic Uplift,” adobe.com
Key Report Takeaways
- By offering, software solutions led with 70.45% revenue share in 2025, while the services segment is projected to grow at a 14.47% CAGR through 2031. By application, website and app optimization captured 38.62% of clickstream analytics market share in 2025; fraud detection and compliance are advancing at a 16.34% CAGR to 2031. By end-user industry, retail and e-commerce accounted for 27.58% share of the clickstream analytics market size in 2025, whereas BFSI is set to expand at a 14.88% CAGR through 2031. By deployment model, on-premises and hybrid solutions held 63.12% of the 2025 base, but cloud deployments are climbing at a 17.05% CAGR to the end of the decade. By geography, North America commanded 41.35% of 2025 revenue; Asia Pacific is forecast to post the fastest 12.86% CAGR to 2031.
Note: Market size and forecast figures in this report are generated using Mordor Intelligence’s proprietary estimation framework, updated with the latest available data and insights as of 2026.
Market Trends and Insights
Drivers Impact Analysis of Clickstream Analytics Market*
| Driver | (~) % Impact on CAGR Forecast | Geographic Relevance | Impact Timeline |
|---|---|---|---|
| Proliferation of omni-channel customer journeys across mobile & web | 1.20% | Global, with higher impact in North America & APAC | Medium term (2-4 years) |
| AI-based real-time personalization boosting ROI of clickstream suites | 1.80% | Global, concentrated in developed markets | Short term (≤ 2 years) |
| Cookieless future driving first-party behavioural data investments | 0.90% | North America & EU primarily, expanding globally | Long term (≥ 4 years) |
| Accelerating e-commerce penetration in emerging Asia & LatAm | 1.10% | APAC & Latin America focus, spillover to MEA | Medium term (2-4 years) |
| Cloud-native analytics lowering TCO for mid-market adopters | 0.70% | Global, with emphasis on SME-dense regions | Short term (≤ 2 years) |
| 5G rollout expanding high-velocity data volumes | 0.50% | Advanced markets first, gradual global expansion | Long term (≥ 4 years) |
| Source: Mordor Intelligence | |||
AI-Based Real-Time Personalization Boosting ROI of Clickstream Suites
AI-driven engines now translate event streams into next-best-action recommendations in milliseconds, with enterprises reporting 31.5% gains in customer satisfaction and 28.3% uplifts in conversion when deploying real-time models. Adobe’s Experience Cloud recently embedded generative agents that trigger content variants instantaneously across web, mobile and storefront screens. Luxury retailer Burberry cut clickstream processing latency by 99%, allowing in-store associates to access digital behaviour before engaging shoppers. Such near-zero-latency decisioning underpins the clickstream analytics market’s transition from descriptive dashboards to predictive monetization levers. [2]Burberry Corporate Blog, “Store Associates Access Real-Time Digital Signals,” burberryplc.com
Proliferation of Omni-Channel Customer Journeys Across Mobile and Web
Consumers routinely hop between smartphones, desktops, social feeds and super-apps, leaving fragmented digital breadcrumbs at every touchpoint. Super-app ecosystems in Asia aggregate commerce, payments and social functions, producing multi-dimensional clickstream data that demands unified identity stitching. European monthly mobile data usage is poised to leap from 15 GB in 2022 to 75 GB by 2030, magnifying event volumes to be captured and analysed. Mercado Libre ties first-party clickstream data across its marketplace and fintech arms to fuel an advertising network that diversifies revenue beyond core retail. Mastery of cross-device journeys has therefore become a prerequisite for brands seeking sustained share in the clickstream analytics market.
Cookieless Future Driving First-Party Behavioural Data Investments
With third-party cookies heading toward full deprecation, enterprises are rebuilding measurement stacks around server-side tracking and consent banners. GDPR, CCPA and India’s DPDP Act collectively cement first-party data as the most reliable behavioural asset, pushing firms to own collection pipelines end to end. Several large retailers have replaced off-the-shelf web analytics with proprietary low-latency collectors that preserve 100% data fidelity under opt-in regimes. PSCU, the US credit-union service organization, blocked USD 35 million in fraud within 18 months by harnessing teller-to-app clickstream sequences as a proprietary signal layer.
Indonesia foresees online sales swelling from USD 52.93 billion in 2023 to USD 86.81 billion in 2028, while Latin American cross-border commerce is expanding 34% annually. Alternative payment rails already process close to 40% of the region’s basket values, spawning distinct browsing and checkout behaviours that standard Western data models fail to capture. African digital commerce is projected to hit USD 72 billion by 2026, catalysing demand for culturally tuned algorithms that decode mobile-first interaction rituals. Clickstream vendors attuned to local nuances are best positioned to outgrow global averages in the clickstream analytics market.
Restraints Impact Analysis of Clickstream Analytics Market*
| Restraint | (~) % Impact on CAGR Forecast | Geographic Relevance | Impact Timeline |
|---|---|---|---|
| Stringent privacy regulations (GDPR, CCPA, DPDP Act) | -0.80% | EU, North America, expanding to APAC | Short term (≤ 2 years) |
| Third-party cookie deprecation limiting data enrichment | -0.60% | Global, with higher impact in advertising-dependent sectors | Medium term (2-4 years) |
| High integration complexity with legacy data stacks | -0.40% | Enterprise-heavy regions, particularly North America & EU | Long term (≥ 4 years) |
| Shortage of advanced analytics talent | -0.30% | Global, acute in emerging markets | Long term (≥ 4 years) |
| Source: Mordor Intelligence | |||
Stringent Privacy Regulations (GDPR, CCPA, DPDP Act)
Regulators intensified enforcement in 2024, forcing redesigns of pixel tags and replay scripts and triggering litigation that raised compliance costs. Oracle’s adtech arm saw USD 1.7 billion in revenue erosion between 2022 and 2024 as privacy crackdowns curtailed third-party datasets. Multinational brands must now juggle consent taxonomies, regional data-retention mandates and cross-border transfer clauses, inflating total cost of ownership for clickstream deployments and temporarily slowing project approvals.
Third-Party Cookie Deprecation Limiting Data Enrichment
Browser blocking of third-party identifiers undermines cross-domain attribution models that once underpinned digital advertising. Early adopters report noticeable gaps in funnel mapping as cookie coverage dwindles, compelling investment in server-side tagging and durable identity graphs. Smaller firms face skill and budget constraints that delay migration, leaving segments of the clickstream analytics market under-instrumented until newer ID frameworks mature.
*Our forecasts treat driver/restraint impacts as directional, not additive. The impact forecasts reflect baseline growth, mix effects, and variable interactions.
Clickstream Analytics Market Segment Analysis
By Offering:
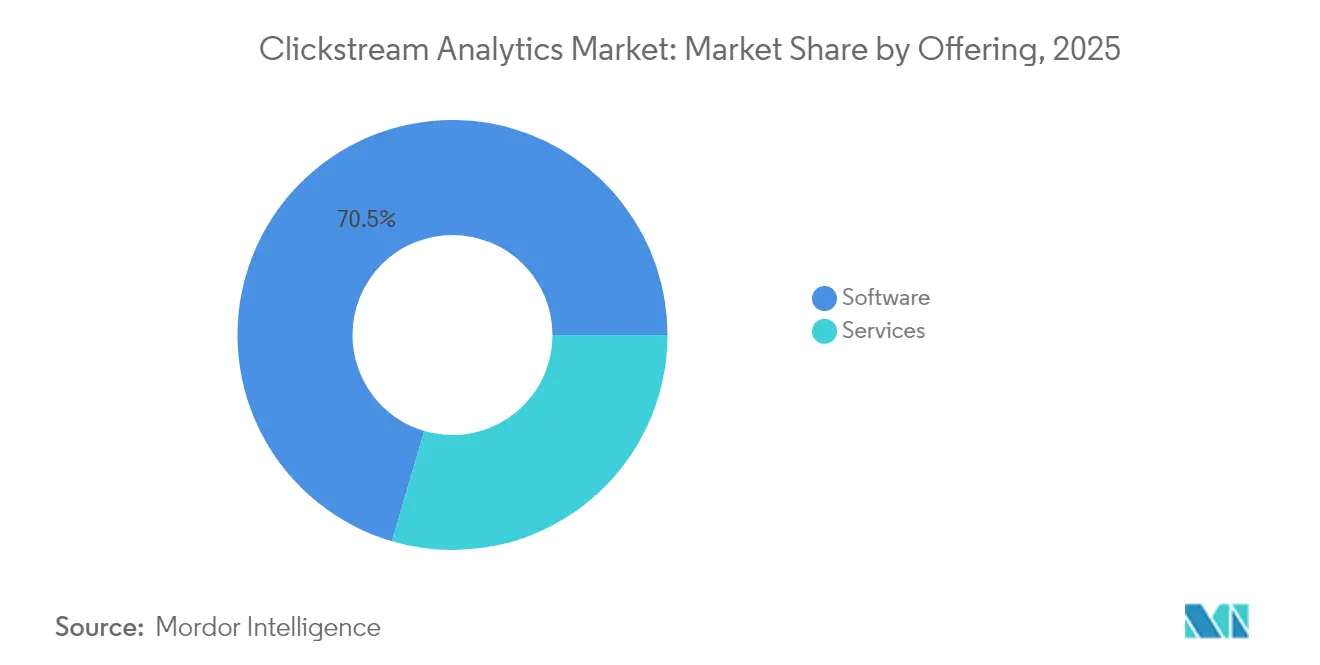
Specialist Services Scale Past Software’s Wide LeadSoftware retains the lion’s share at 70.45% in 2025, cementing its role as the core purchase for enterprises consolidating data capture, streaming transformation and visualization within one interface. AI modules that auto-cluster behaviours, coupled with cloud’s pay-as-you-ingest economics, sustain wallet share among global brands. Yet services revenues are compounding at 14.47% annually to 2031 as buyers confront privacy rewiring, SDK upgrades and complex legacy integrations. Advisory teams deliver blueprints for server-side collection, configure consent layers and fine-tune event taxonomies, ensuring clients extract full value from their software spend. Managed analytics further thrive as mid-sized enterprises outsource 24×7 operation of low-latency pipelines, uplifting recurring service income inside the clickstream analytics market size equation without the capex drag of on-premises clusters.



By Application:
Fraud Detection Surges Beyond Optimization’s Broad BaseConversion optimisation and user-experience tuning form the historical nucleus of clickstream spending, explaining the segment’s dominant 38.62% revenue in 2025. Retailers iterate checkout flows, A/B messages and asset loads to shrink bounce rates, while media platforms monitor engagement depth to calibrate content layouts. Alongside, click-path analysis identifies bottlenecks that product squads address in agile sprints. Meanwhile, fraud detection and compliance are sprinting at a 16.34% CAGR as banks, payment gateways and i-gaming apps embrace behavioural biometrics to flag anomalies in session cadence or mouse trajectories. PSCU’s USD 35 million fraud-loss avoidance showcases the financial stakes and growth headroom for this application subset, reinforcing its weight inside the evolving clickstream analytics market share narrative.
By End-User Industry:
BFSI Momentum Challenges Retail SupremacyRetail and e-commerce control 27.58% of 2025 outlays, leveraging personalisation engines to elevate basket sizes and refine stock allocation. Gift-finder widgets, dynamic pricing and same-day delivery ETAs all hinge on granular clickstream feedback loops. Despite that lead, banking, financial services and insurance is expanding 14.88% each year to 2031. Axis Bank’s personalised nudges drove 45% of term-deposit bookings and 70% of instant-loan bookings, highlighting direct revenue lift from behavioural cues processed in near real time. As regulators tighten transaction monitoring, BFSI institutions see clickstream telemetry as critical risk infrastructure, translating into sustained wallet expansion within the clickstream analytics market size for that vertical.
By Deployment Mode:
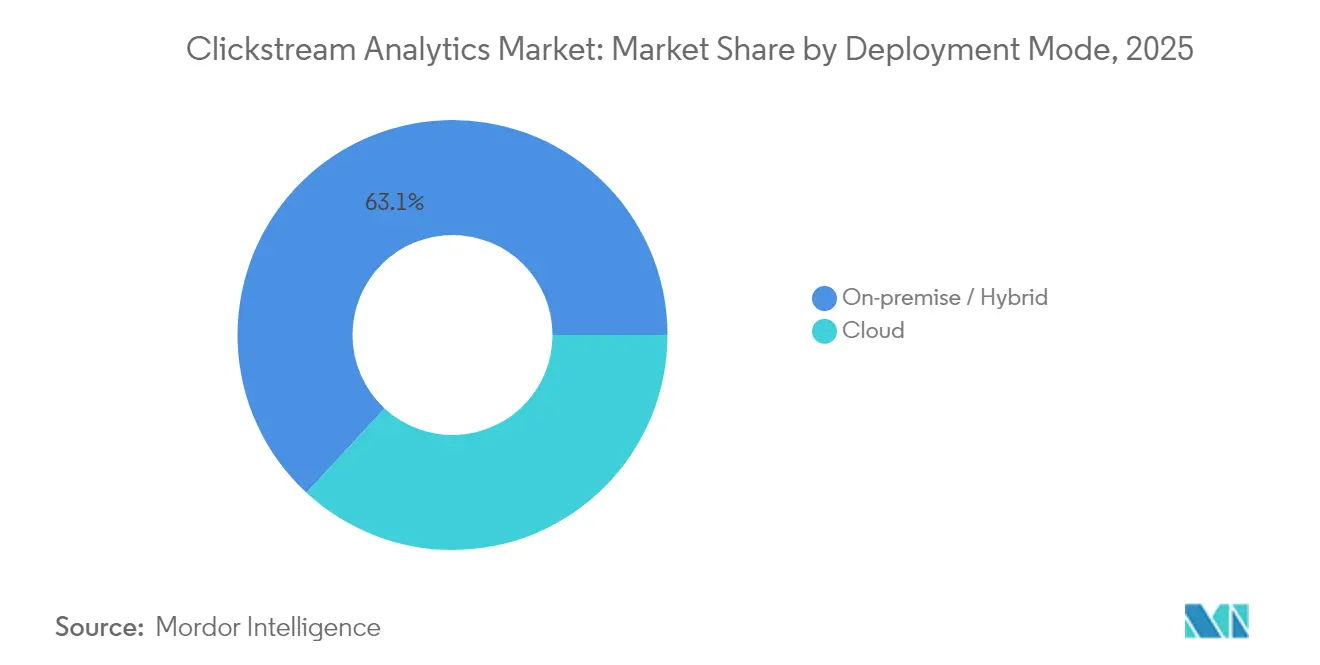
Cloud Velocity Redefines TCO CalculusLegacy on-premises and hybrid estates still represent 63.12% of installed revenue in 2025, particularly across telecom, federal and healthcare clients bound by data-sovereignty statutes. Nonetheless, cloud subscriptions are ballooning at 17.05% CAGR, propelled by elastic-scale economics and managed-security certifications from hyperscalers. Google Cloud, AWS and Microsoft Azure market turnkey reference architectures that spin up in hours rather than quarters, enabling mid-market adopters to leapfrog costly infrastructure cycles. As edge regions multiply and encryption matures, sceptical CIOs convert, tilting future growth steeply toward SaaS and PaaS formats inside the broader clickstream analytics market.
Geography Analysis
North America, APAC, Europe, LATAM and Africa Clickstream Analytics Market
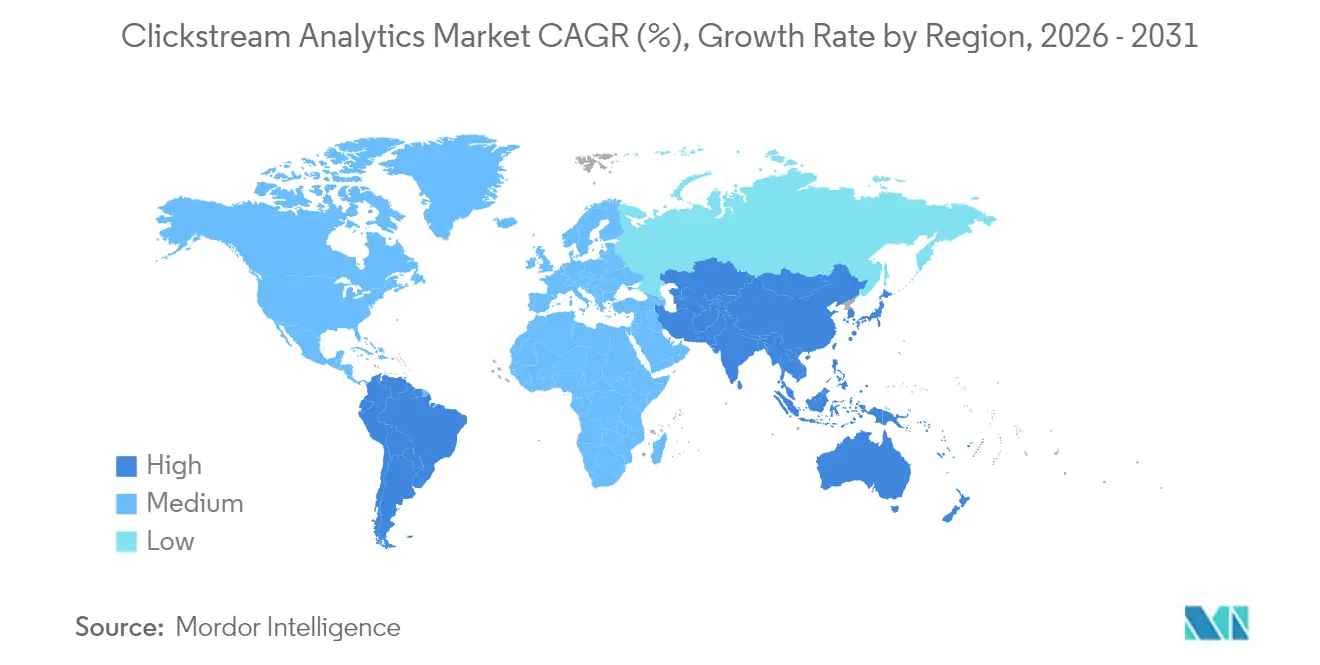
North America commanded 41.35% of 2025 revenue, anchored by high digital-ad budgets, deep AI talent pools and proactive privacy statutes. Adobe logged a 1,300% traffic spike in retail sites supported by generative chatbots between July 2024 and February 2025. Federal privacy proposals now mirror CCPA rigor, prompting brands to embed advanced consent workflows, raising baseline demand in the clickstream analytics market.Asia Pacific is the standout growth engine, forecast at 12.86% CAGR to 2031. Indonesia alone is scaling e-commerce turnover from USD 52.93 billion in 2023 to USD 86.81 billion by 2028, injecting millions of new behavioural records daily. Viacom18’s Indian streaming platform parses 700 GB to 1 TB of data each day to personalise 45,000 hours of video. Cloud vendors have expanded regional zones to satisfy data-localisation rules, unlocking rapid SaaS uptake across the clickstream analytics market.Europe records steady albeit regulated expansion. GDPR entrenches first-party data dependence, spurring innovation in differential-privacy and on-device processing that safeguards user rights while preserving insight value. Latin America’s 34% rise in cross-border e-commerce and Africa’s projected USD 72 billion digital commerce by 2026 provide fresh white space where localised algorithms and lightweight mobile SDKs will define competitive advantage over the medium term.

Regulatory Landscape
Clickstream analytics deployments are primarily shaped by privacy and tracking rules that govern storage and access on user devices, as well as downstream processing of behavioral data. In the EU, GDPR applies to personal data processing, while the ePrivacy Directive (Article 5(3)) sets consent requirements for cookies and similar technologies. The European Data Protection Board (EDPB) finalized Guidelines 2/2023 in October 2024, clarifying that consent-style requirements extend beyond cookies to tracking pixels, URL-based tracking, IP-only tracking, and fingerprinting. Enterprises have consequently been redesigning tagging, session replay, and identity workflows to fit consent and purpose limitations across channels.
Regulatory direction remains active through 2025-2026. The European Commission withdrew the proposed ePrivacy Regulation in February 2025, leaving the ePrivacy Directive framework in place. Separately, the Digital Omnibus package (COM(2025) 837 final), proposed on November 19, 2025, introduces a potential new GDPR Article 88a to bring cookie-consent concepts into the GDPR text, though it had not been adopted as of mid-2026. EU AI governance also carries more weight for AI-enabled personalization and fraud analytics, with the EU AI Act becoming generally applicable in August 2026 and adding transparency and risk-management requirements. Large buyers are increasingly treating these controls alongside GDPR DPIAs when clickstream models influence regulated outcomes.
Value Chain Analysis
The clickstream analytics value chain typically begins with data capture, commonly via client-side SDKs for mobile (Android/iOS) and JavaScript tags for web. Server-side collection is increasingly used to improve resilience under consent constraints and browser limitations. Event streams then run through ingestion and buffering layers, including Apache Kafka and managed offerings such as Amazon Kinesis Data Streams or Amazon MSK, followed by processing that covers filtering, cleansing, enrichment, and sessionization. Downstream outputs are structured into warehouse or lakehouse formats, often using table formats such as Delta/Iceberg/Hudi, which enables teams to query data, train ML models, and maintain governance-friendly schemas.
The later stages focus on analytics, activation, and operations. Reporting and visualization translate journeys into dashboards, funnel analytics, and anomaly alerts, while activation connects to experience and marketing stacks for personalization and experimentation. Services partners and internal data engineering teams support ongoing taxonomy design, consent orchestration, and pipeline reliability, which becomes more prominent as enterprises modernize legacy environments and adopt cloud reference architectures such as AWS solutions for clickstream analytics. M&A and platform consolidation also shape the value chain by pulling telemetry and related capabilities into broader observability and security analytics offerings, including Cisco closing its Splunk acquisition (USD 28 billion) to broaden analytics reach across high-volume event data.
Competitive Landscape
The field is moderately fragmented. Giants such as Adobe, Google and Oracle cross-sell clickstream modules inside experience and cloud stacks, leveraging massive channel footprints. Google’s GA4 rollout embeds predictive audiences and consent mode, while Oracle enhances Fusion Analytics with server-side measurement add-ons. Mid-cap specialists—Amplitude, Mixpanel, Heap—win developer loyalty through schema-less event capture and intuitive UI. AI-native challengers like StarTree push real-time OLAP over Apache Pino to millisecond SLA levels, attracting fintechs and adtechs. MandA momentum persists: Cisco’s USD 28 billion buyout of Splunk augments threat analytics reach, Fivetran’s purchase of Census fuses extract-load with reverse ETL for closed-loop activation and DoubleVerify’s USD 85 million Rockerbox deal layers attribution onto brand-safety metrics. Competitive playbooks increasingly hinge on latency reduction, consent automation and verticalized models, characteristics that will continue to redraw share contours inside the clickstream analytics market. [4]Cisco Newsroom, “Cisco Closes USD 28 Billion Splunk Acquisition,” cisco.com
Clickstream Analytics Industry Leaders
Fuji Electronic Industrial Co., Ltd.
Dr. Fritsch GmbH & Co KG
FCT Systeme GmbH
Thermal Technology LLC
Desktop Metal Inc.
- *Disclaimer: Major Players sorted in no particular order
Clickstream Analytics Market Companies Covered in this Report
- Adobe Inc.
- Google LLC
- Oracle Corp.
- IBM Corp.
- Microsoft Corp.
- SAP SE
- Hewlett Packard Enterprise
- Splunk Inc.
- Talend Inc.
- Verto Analytics Inc.
- Webtrends Corp.
- Mixpanel Inc.
- Amplitude Inc.
- Contentsquare SA
- Heap Inc.

Market Opportunities and Future Outlook
One clear whitespace is measurement tooling that treats AI-originated traffic and automation as first-class channels, rather than noise to be filtered. In July 2026, WISLR launched AI Channel Analytics to track LLM and AI referrer traffic (including AI-attributed leads and sales) at the server level. This points to growing demand for frameworks that distinguish human journeys from AI crawls and assistant activity, and it creates room for vendors to extend clickstream schemas, attribution logic, and identity resolution to cover AI agents and bot-like browsing patterns while keeping auditability for marketing and fraud teams.
Privacy-first architectures are another opportunity area, especially those that reduce reliance on client-side identifiers while aligning with tightening interpretations of tracking rules. In the UK, the Data (Use and Access) Act 2025 introduced new exceptions to PECR Regulation 6 for specific analytics and functional storage/access technologies, and the ICO issued finalized Storage and Access Technologies guidance in April 2026. That guidance pushes organizations to document lawful basis and legitimate-interest assessments even when consent exemptions apply. At the same time, the EU policy discussion continues via the Digital Omnibus proposal (COM(2025) 837), which includes a controller-only consent-free path for audience measurement, although national enforcement remains fragmented. Together, these changes support demand for stacks that combine consent orchestration, server-side tagging, regional data controls, and configurable retention, so enterprises can standardize measurement across geographies without rebuilding pipelines for each regulator interpretation.
Recent Industry Developments in Clickstream Analytics Market
- July 2026: Cloudflare introduced Precursor, a behavioral validation engine that collects continuous client-side signals to map full user journeys within its Security Analytics stack. The solution broadens behavioral telemetry beyond request-level logs, reinforcing convergence between security analytics and clickstream-style journey analysis for fraud and bot mitigation use cases.
- May 2025: Fivetran agreed to acquire Census, combining its connector ecosystem with reverse ETL to operationalize data in downstream systems. The deal strengthens closed-loop activation from clickstream-derived models by reducing friction between event collection, warehouse modeling, and audience or CRM sync.
- March 2024: Cisco closed its USD 28 billion acquisition of Splunk, expanding its footprint in high-volume event analytics across observability and security operations. The integration supports enterprise demand to unify behavioral and operational telemetry, influencing platform buying decisions for real-time analytics pipelines adjacent to clickstream workloads.


Clickstream Analytics Market Report Scope and Research Methodology
Market Definition and Coverage
This market covers tools and related services that capture and analyze digital click and event trails from websites and apps, so businesses can map journeys, identify drop-offs, and improve experiences. It is measured in revenue generated from clickstream analytics software and services sold to end users.
Scope exclusions: This sizing excludes general web hosting, ad buying and ad serving spend, and one-off custom IT projects that are not primarily clickstream analytics.
Segments Covered in This Report
- By Offering
- Software
- Services
- By Application
- Click-Path Optimization
- Website / App Optimization
- Customer Analysis
- Fraud Detection and Compliance
- By End-user Industry
- Retail and E-commerce
- Media and Entertainment
- Telecom and IT
- BFSI
- Transport and Logistics
- Energy and Utilities
- By Deployment Mode
- Cloud
- On-premise / Hybrid
- By Geography
- North America
- United States
- Canada
- Mexico
- South America
- Brazil
- Argentina
- Europe
- Italy
- Spain
- France
- United Kingdom
- Germany
- Asia-Pacific
- India
- China
- Japan
- Middle East
- Turkey
- United Arab Emirates
- Saudi Arabia
- Africa
- Kenya
- South Africa
- Nigeria
- North America
Data Sources, Market Sizing, and Validation
Desk Research
Desk work starts by mapping where clickstream data is created and where it gets monetized, and then aligning that with how software and services are typically priced. We refer to public sources such as the US Census Bureau for e-commerce signals, the US Bureau of Labor Statistics for IT wage inflation, and the Federal Reserve Economic Data series for broader macro patterns that influence enterprise software budgets.
We also review regulatory and technical context from sources such as the Federal Trade Commission, the European Commission, and standards bodies like NIST, since privacy and consent rules can change data-collection practices and affect deployment demand. To ground the model in what vendors report, we use company filings, earnings transcripts, investor presentations, and credible press, and we supplement this with paid subscriptions for company financials and intelligence, patent databases, and news and financials where it helps fill gaps. These sources are illustrative only, and many other public references were used to collect, cross-check, and clarify data points.
Primary Interviews and Surveys
Primary work is used to validate buying patterns for clickstream analytics across industries that generate heavy digital traffic, and to pressure-test the split between software subscriptions and related services. We spoke with a mix of solution providers, service partners, and enterprise users across APAC, EMEA, and the Americas to confirm typical deal sizes, deployment choices (cloud versus hybrid), and the most common use cases that drive renewals.
Distribution of primary research fieldwork respondents
| Company type | Respondent position | Region |
|---|---|---|
| Top tier: 36% | CXOs: 12% | APAC: 45% |
| Mid tier: 46% | Functional/Unit leaders: 42% | EMEA: 29% |
| Smaller Players: 18% | Managers: 46% | Americas: 26% |
Market-Sizing & Forecasting
The core sizing logic uses a top-down approach where enterprise analytics and digital-experience software spending is reconstructed into a clickstream analytics demand pool using adoption and deployment ratios by region and industry, then allocated across software and services. The totals are corroborated with selective bottom-up approximations, such as sampled subscription price points multiplied by estimated active customer counts, along with channel checks on service attach rates, before final numbers are adjusted.
Inputs used in the model include website and app traffic growth indicators, e-commerce penetration trends, shifts toward first-party data collection, cloud adoption rates for analytics workloads, and the observed mix of use cases like click path optimization, website or app optimization, and customer analysis. Where direct disclosure is limited, gaps are handled by using range-based assumptions validated in interviews, and by keeping ratios consistent with comparable patterns in digital analytics spending.
For forecasting, we rely on scenario analysis supported by a small set of leading indicators, because privacy rule changes, cookie deprecation timing, and cloud migration pace can shift purchasing behavior unevenly. Growth rates are reviewed with practitioners so the assumptions stay realistic across regions, covering both software renewals and services expansion.
Data Validation & Update Cycle
Outputs are checked against independent signals like software budget growth, digital commerce activity, and the expected pace of cloud analytics deployments, and any outliers are investigated before acceptance. If a regional split or an offering mix moves too sharply versus these signals, we revisit assumptions and, when needed, re-contact interviewees to confirm what changed.
A multi-step review is followed so calculations, unit economics, and growth drivers are verified by another analyst before sign-off. The dataset is refreshed annually, and interim updates are made when material events occur, such as major privacy enforcement actions or clear shifts in cloud adoption. Before delivery, a fresh review pass is completed so the final view reflects the latest available information.
Mordor Intelligence's Clickstream Analytics Market Sizing Compared With Other Published Estimates
Published market sizes for clickstream analytics can appear far apart even when they cover similar use cases, because the counted revenue pool and the timing of the base year are not always handled the same way. Differences also come from how firms treat services, how they convert currencies, and whether cloud migration and privacy changes are modeled as near-term accelerators or longer shifts.
The main gap comes from whether adjacent customer journey tools and broader web analytics suites are bundled into the same category, where Mordor Intelligence counts clickstream analytics revenue only when it is directly tied to click and event stream capture, processing, and analysis across software plus related services. Other gaps tend to come from using aggressive adoption curves for retail and e-commerce, assuming faster ASP uplift for new analytics capabilities, or projecting a single global growth rate without validating regional deployment constraints.
Benchmark comparison
| Source | Market Size | Gaps in Research Methodology |
|---|---|---|
| Mordor Intelligence | USD 2.08 B (2026) | |
| Industry Publisher A | USD 2.11 B (2025) | Uses a 2025 base year and may blend clickstream analytics with broader digital analytics spending categories, which can pull in adjacent tools and lift the total for the same time window. |
| Global Publisher B | USD 2.10 B (2025) | Includes a wider application set like basket analysis and personalization as a defined part of clickstream analytics, and its longer forecast horizon can rely on higher assumed adoption and feature-driven ASP expansion. |
Taken together, the spread is mostly explained by scope choices and base-year alignment rather than arithmetic. By keeping the revenue definition tied to clearly stated clickstream functions, and by validating key ratios like cloud share and services attach through interviews, our estimate stays traceable to inputs that can be checked and repeated.


Key Questions Answered in the Report
What is the current size of the clickstream analytics market?
The clickstream analytics market is valued at USD 2.08 billion in 2026.
How fast is the clickstream analytics market expected to grow through 2031?
It is projected to expand at a 5.83% CAGR during 2026-2031, reaching USD 2.77 billion by 2031.
Which segment is growing fastest within the clickstream analytics market?
Services, covering consulting and managed analytics, is forecast to rise at 14.47% CAGR through 2031.
Why is fraud detection becoming a key application for clickstream analytics?
Financial and e-commerce firms are leveraging behavioural patterns to stop real-time fraud, a need that is driving a 16.34% CAGR for the segment.
Which region offers the strongest growth outlook?
Asia Pacific is expected to post the fastest 12.86% CAGR to 2031, powered by booming e-commerce and mobile-first user bases.
How are privacy regulations influencing technology choices?
GDPR, CCPA and similar laws are steering organisations toward first-party data collection, consent orchestration and compliant server-side tracking, reshaping vendor roadmaps across the market.
Page last updated on:





