Sporting Goods Market Size and Share
Market Overview
| Study Period | 2021 - 2031 |
|---|---|
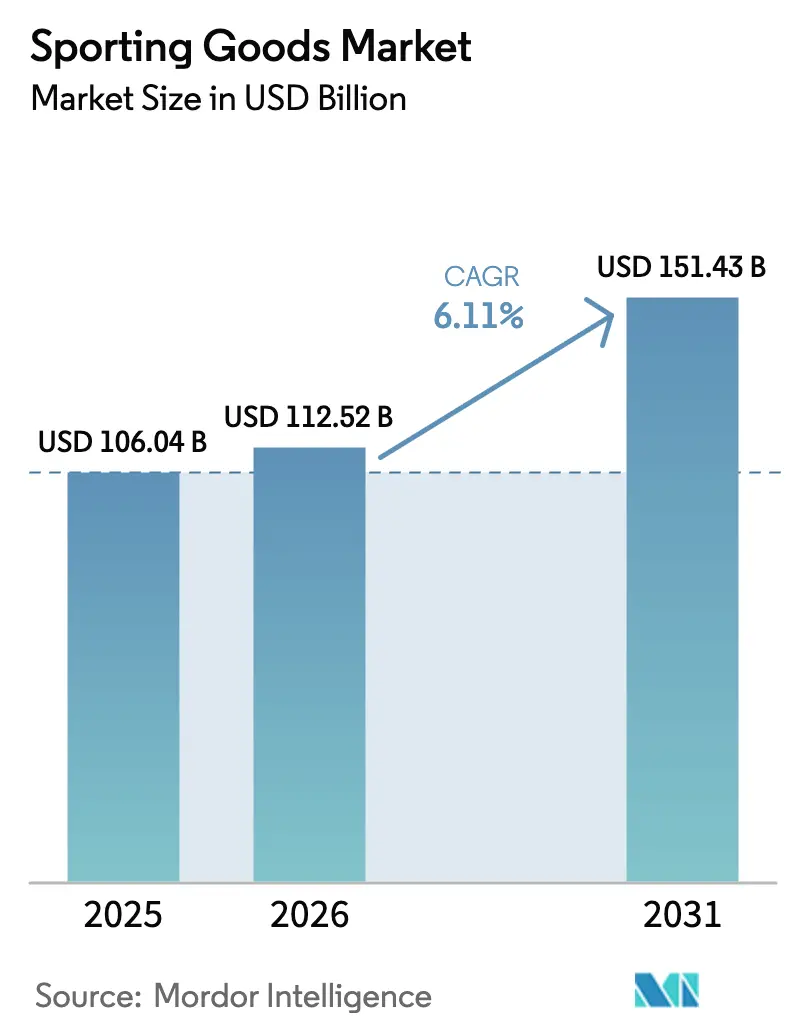
| Market Size (2026) | USD 112.52 Billion |
| Market Size (2031) | USD 151.43 Billion |
| Growth Rate (2026 - 2031) | 6.11% CAGR |
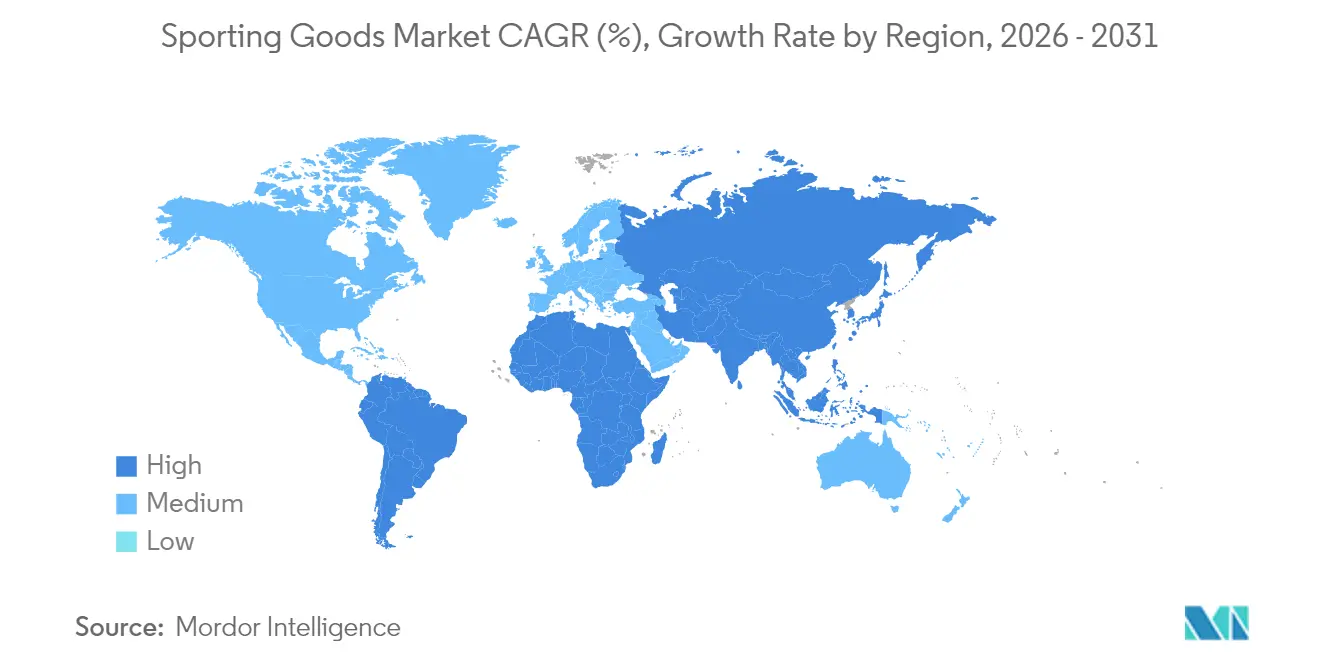
| Fastest Growing Market | Asia Pacific |
| Largest Market | North America |
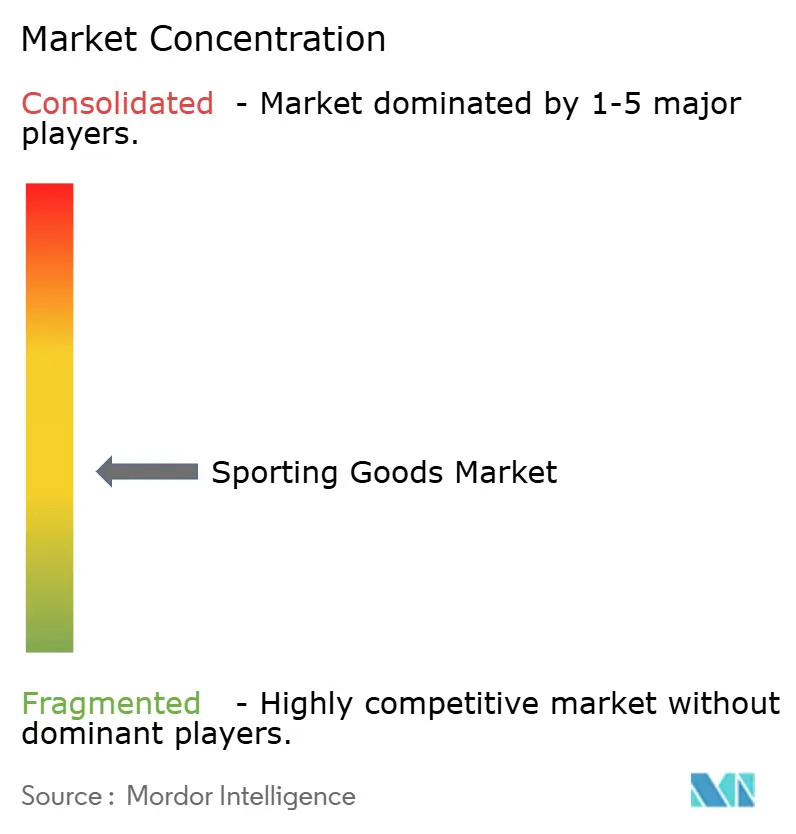
| Market Concentration | Medium |
Major Players
*Disclaimer: Major Players sorted in no particular order Image © Mordor Intelligence. Reuse requires attribution under CC BY 4.0. |
|
Sporting Goods Market Analysis by Mordor Intelligence
The sporting goods market size is expected to grow from USD 106.04 billion in 2025 to USD 112.52 billion in 2026 and is forecast to reach USD 151.43 billion by 2031 at 6.11% CAGR over 2026-2031. This growth is driven by changing consumer lifestyles, increased government initiatives promoting fitness, and advancements in material technology. Sporting goods are gaining popularity as they cater to preventive healthcare needs, provide entertainment, and serve as a means of social expression. The expansion of digital retail and the adoption of additive manufacturing have significantly reduced production lead times and improved product customization, enabling brands to quickly respond to niche market demands. Additionally, the growing focus on sustainability is pushing supply chains toward circular models. At the same time, stricter measures against counterfeit products are helping to protect brand reputation and maintain high-quality standards.
Key Report Takeaways
- By product type, equipment led with 37.64% sporting goods market share in 2025, whereas accessories posted the fastest 7.02% CAGR outlook to 2031.
- By sport type, outdoor sporting commanded 61.45% of the 2025 base, but adventure sports is projected to register a 6.47% CAGR through 2031.
- By end user, men represented 53.02% of revenue in 2025, while the women segment is set to grow quickest at 7.72% CAGR.
- By distribution channel, offline outlets retained 62.28% revenue share in 2025; online sales are expected to expand at 8.42% CAGR to 2031.
- By geography, North America held 41.96% of 2025 revenue, yet Asia-Pacific is on track for an 8.36% CAGR to 2031.
Note: Market size and forecast figures in this report are generated using Mordor Intelligence’s proprietary estimation framework, updated with the latest available data and insights as of 2026.
Global Sporting Goods Market Trends and Insights
Drivers Impact Analysis*
| Drivers | (~) % Impact on CAGR Forecast | Geographic Relevance | Impact Timeline |
|---|---|---|---|
| Rising health-and-fitness consciousness | +1.8% | Global, with strongest impact in North America and Europe | Medium term (2-4 years) |
| Innovation in materials and product design | +1.5% | Global, led by Asia-Pacific manufacturing hubs | Long term (≥ 4 years) |
| Influence of major sporting events | +1.2% | Global, with event-specific regional spikes | Short term (≤ 2 years) |
| E-commerce and direct-to-consumer sales expansion | +1.0% | Global, accelerated in Asia-Pacific and North America | Medium term (2-4 years) |
| Social media and influencer marketing | +0.8% | Global, particularly strong in North America and Europe | Short term (≤ 2 years) |
| Rising participation of women and youth in diverse sporting activities | +0.9% | Global, with strongest growth in North America and Europe | Long term (≥ 4 years) |
| Source: Mordor Intelligence | |||
Rising health-and-fitness consciousness
Outdoor recreation is witnessing a surge in participation, driven by shifting consumer preferences and a heightened emphasis on health and fitness. In 2024, the Outdoor Industry Association noted a 2.2% rise in outdoor recreation participation from 2023, with 58.6% of the U.S. population aged 6 and older taking part[1]Outdoor Industry Association, "Share of population who take part in outdoor sports in the United States from 2014 to 2024", oia.outdoorindustry.org. This uptick signals a notable shift in consumer behavior, largely fueled by a growing fitness awareness post-pandemic. Importantly, this trend spans multiple demographics: seniors experienced a 7.4% rise in participation, closely trailed by a 5.6% increase among the youth. Such data underscores a rising multi-generational appetite for specialized fitness equipment. Worldwide, governments are increasingly acknowledging and advocating for the crucial role of exercise in public health. For instance, India's National Sports Policy 2025 aims to introduce extensive fitness programs and enhance sports infrastructure, all to promote healthier living. This shifting perspective elevates sporting goods from being mere luxuries to essential tools for preventive healthcare. Additionally, corporate wellness programs are significantly boosting their investments in fitness equipment, expanding the business-to-business (B2B) sales arena beyond traditional retail boundaries.
Innovation in materials and product design
Companies like Nike are leading the charge in advanced materials science, developing particulate foam cushioning systems that adjust to varying loads during athletic activities. Sustainability is at the forefront of material innovation, as seen in ASICS' NIMBUS MIRAI, which boasts an upper made of 87.3% recyclable polyester and an FF BLAST™ PLUS ECO midsole derived from 24% renewable sources. With looming restrictions from the European Union, there's a growing focus on PFAS-free alternatives. Research is honing in on polydimethylsiloxane and cellulose-based materials, particularly for triboelectric nanogenerators in wearable sports applications. Adidas showcases the potential of 3D printing with its CLIMACOOL shoe, featuring lattice structures crafted through additive manufacturing for enhanced 360° airflow. The integration of smart textiles is gaining momentum, highlighted by fiber battery patents that allow energy storage directly within athletic apparel, powering wearable devices. While these cutting-edge innovations command premium pricing, they also benefit from reduced manufacturing costs due to automation, leading to expanded profit margins throughout the value chain.
Influence of major sporting events
As the Paris 2024 Olympics draw near, Chinese sports exports have experienced a positive year-on-year growth, driven by the predictable demand surges associated with Olympic and major championship cycles. The event's strong emphasis on sustainability has encouraged companies like Uniqlo and ASICS to adopt more recycled materials in their products while improving transparency around carbon emissions. Nike's A.I.R. project exemplifies the effectiveness of event-driven marketing by introducing athlete-inspired innovations created using AI and rapid prototyping, which helps build lasting brand recognition. Furthermore, regional hosting of major events has significantly boosted local demand, particularly in emerging sports markets such as Saudi Arabia and India, where increased visibility has accelerated growth. Beyond the event period, these impacts continue to deliver long-term benefits through enhanced infrastructure and a steady rise in sports participation within host regions.
E-commerce and direct-to-consumer sales expansion
Digital transformation is driving significant changes across the industry. Dick's Sporting Goods reported a 4.5% increase in comparable sales, supported by the expansion of its omni-channel capabilities, which enhance both in-store and online customer experiences. Lululemon achieved 12% growth in Q3 2024 by prioritizing its direct-to-consumer strategy, with digital platforms accounting for a major share of its revenue. In 2024, China's cross-border e-commerce market reached 2.63 trillion yuan, playing a crucial role in facilitating the global distribution of sporting goods and expanding market access for brands[2]Government of China, "China's foreign trade hits new high in 2024", gov.cn. Amazon recorded a 13% rise in net sales, reaching USD 143.3 billion, showcasing its dominance in sporting goods distribution. This growth is further strengthened by AWS, which enables advanced analytics to improve inventory management and operational efficiency. Social commerce, particularly through influencer-driven campaigns, has emerged as a powerful tool for connecting with younger audiences and driving sales. Additionally, direct-to-consumer models are helping brands eliminate retail margins while leveraging customer data to create personalized shopping experiences, giving them a competitive edge in the rapidly evolving market.
Restraint Impact Analysis*
| Restraint | (~) % Impact on CAGR Forecast | Geographic Relevance | Impact Timeline |
|---|---|---|---|
| Proliferation of counterfeit products | -0.9% | Global, particularly affecting Asia-Pacific and North America | Medium term (2-4 years) |
| Injury and safety risks from equipment | -0.6% | Global, with stricter enforcement in North America and Europe | Long term (≥ 4 years) |
| Complex and fragmented regulatory landscape | -0.4% | Global, with highest impact in Europe and North America | Long term (≥ 4 years) |
| Resource and labor issues | -0.5% | Asia-Pacific manufacturing hubs, spill-over to global supply chains | Medium term (2-4 years) |
| Source: Mordor Intelligence | |||
Proliferation of counterfeit products
Counterfeiting remains a critical issue for global markets, prompting authorities to adopt stricter measures to curb its impact. In 2023, European authorities seized a record-breaking counterfeit items, valued at EUR 3.4 billion, with China continuing to dominate as the primary source of these goods[3]European Commission, "EU seizes record 152 million fake items worth 3.4 billion EUR in 2023", europa.eu. E-commerce platforms, particularly through low-value shipment channels, have inadvertently contributed to the proliferation of counterfeit products. The CBP has highlighted that the rapid expansion of digital commerce is making enforcement efforts increasingly complex. Major global events, such as Euro 2024 and the Paris Games, have witnessed a spike in counterfeit activities, with OLAF confiscating over 630,000 fake items during these events. Counterfeiting not only undermines brand reputation and reduces legitimate sales but also poses significant safety risks due to the use of substandard materials. Addressing this growing problem requires stronger collaboration between customs authorities and brand protection teams to safeguard market stability and consumer trust.
Injury and safety risks from equipment
As adventure sports participation grows across various age groups, concerns about equipment-related injuries are creating significant liability challenges, which are slowing market growth. The Consumer Product Safety Commission (CPSC) has intensified its focus on safety by updating regulations for recreational off-highway vehicles and introducing new safety requirements for various sports products. In Europe, adventure sports equipment must comply with strict standards, such as EN 959:2018, which outlines safety requirements and testing methods for rock anchors and climbing gear. Similarly, ASTM International regularly updates sports equipment standards, addressing areas like impact absorption in athletic footwear and performance specifications for baseball bats. Rising insurance costs, driven by product liability risks, are adding financial pressure on manufacturers and retailers, particularly smaller companies with limited legal resources. To improve safety in climbing activities, the UIAA is promoting standardized accident reporting and safety labeling to better track and analyze incident data. However, meeting regulatory compliance requirements is increasing product development costs and extending timelines. These challenges are slowing the pace of innovation and making it harder for new players to enter the market.
*Our forecasts treat driver/restraint impacts as directional, not additive. The impact forecasts reflect baseline growth, mix effects, and variable interactions.
Segment Analysis
By Product Type: Equipment Dominance Faces Accessories Disruption
In 2025, the equipment segment holds a dominant 37.64% market share, driven by high-value products such as fitness machines, outdoor gear, and protective equipment, which command premium prices. The integration of advanced technology plays a key role in this growth. For instance, Garmin's fitness division achieved a 28% revenue increase by innovating in wearables and smart cycling computers. Traditional equipment categories are expanding due to the rising popularity of home fitness, while adventure sports equipment sees growth as more people participate in outdoor activities. The acquisition of Wattbike by Interactive Strength for USD 65 million highlights the premium appeal of specialized fitness equipment. Wattbike's products are used by over 1,000 elite sports teams and 3,500 gyms worldwide, showcasing their global reach. The segment remains resilient because of the essential role equipment plays in athletic performance and the high replacement costs, which encourage customer loyalty.
The accessories segment is the fastest-growing category, with a projected CAGR of 7.02% through 2031. This growth reflects consumers' increasing preference for frequent upgrades and personalized sports technology. Nike's launch of the Athena and Zeus sunglasses, featuring Max Extreme Lens technology and over 40% recycled materials, demonstrates how accessories can combine premium pricing with sustainability. Wearable technology is a significant driver for this segment, with innovations like fiber battery patents enabling energy storage directly in athletic apparel. Smart accessories, such as fitness trackers and performance monitors, generate recurring revenue and are more affordable, encouraging frequent purchases compared to larger equipment investments. This segment also benefits from the growing sports lifestyle trend, as accessories allow consumers to express their athletic identity even outside active participation.


By Sport Type: Outdoor Sports Leadership Challenged by Adventure Growth
In 2025, Outdoor Sports continues to dominate the market with a 61.45% share, driven by traditional activities such as running, cycling, and hiking. These activities attract participants across all age groups due to their accessibility and health benefits. U.S. data show that the value added of the outdoor recreation economy accounted for 2.3% (UAD 639.5 billion) of current-dollar gross domestic product (GDP) for the nation in 2023. Activities like hiking and cycling require minimal specialized skills but offer substantial fitness advantages, making them appealing to a broad audience. Additionally, government initiatives, such as infrastructure development and trail expansions, have further encouraged participation across various regions.
Adventure Sports is the fastest-growing segment, with a projected CAGR of 6.47% through 2031. This growth is fueled by increasing participation in specialized outdoor activities and greater demographic diversity. According to the Outdoor Industry Association Report 2025, participation in core outdoor activities has risen by 12.8% among Black Americans and 11.8% among Hispanic Americans, creating new opportunities for market expansion. The segment also benefits from advancements in safety standards, such as EN 959:2018 for rock anchors and UIAA certification requirements, which ensure product quality and create entry barriers for new players. The UIAA's establishment of a Working Group on accident reporting highlights the industry's focus on safety by compiling global data on climbing incidents. Additionally, this segment is characterized by premium pricing, as specialized equipment for climbing, mountaineering, and extreme sports commands higher margins due to technical specifications and strict safety certifications.
By End User: Women's Participation Drives Market Transformation
In 2025, men hold a 53.02% share of the sporting goods market, reflecting their position as the primary consumers across professional, recreational, and fitness categories. This steady demand is driven by their active involvement in strength training, competitive sports, and outdoor activities that require specialized equipment. For example, Nike's A.I.R. project, featuring male athlete Victor Wembanyama, highlights how companies are focusing on male-oriented product development by using advanced technologies like AI and rapid prototyping. Men also tend to spend more on premium products, particularly in categories such as golf equipment and outdoor adventure gear, where they exhibit strong brand loyalty. Additionally, professional and collegiate male athletes continue to drive demand for sports equipment, especially in team sports and individual performance categories.
Women are the fastest-growing segment in the sporting goods market, with a projected CAGR of 7.72% through 2031. This growth is fueled by record-high participation of 235,735 female student-athletes in the NCAA across all divisions during the 2023-24 season. The NCAA's decision to allocate USD 25 million over three years for the Division I Women's Basketball Championship highlights the increasing institutional support for women's sports, leading to improvements in equipment and facilities. Companies are also focusing on creating women-specific products, such as athletic footwear designed for female biomechanics, better-sized equipment, and aesthetically appealing designs. Emerging sports like women's wrestling are gaining traction, with participants increasing from 769 to 1,171. This expanding demographic, combined with a 95% graduation success rate for Division I female athletes, is driving demand for specialized sports products across various categories.

By Distribution Channel: Digital Transformation Accelerates Retail Evolution
In 2025, offline channels hold a 62.28% market share, highlighting the continued importance of physical retail in sporting goods purchases. Customers value these stores for trying products, receiving expert advice, and enjoying the convenience of immediate purchases. Dick's Sporting Goods exemplifies the strength of this channel, achieving a 4.5% growth in comparable sales while operating 724 locations across the United States. The company differentiates itself from online competitors by offering unique in-store experiences, such as batting cages and golf simulators. Physical stores also provide instant product availability and personalized fitting services, which are particularly critical for high-value equipment and technical gear. Specialty sporting goods retailers, like Hibbett, leverage their expertise and community connections. Hibbett operates over 1,150 stores, primarily in underserved areas, and maintains strong vendor partnerships, especially with Nike. These physical locations act as brand experience centers, allowing customers to test products and receive professional guidance, offering a level of service that online platforms cannot replicate.
Online channels are growing rapidly, with an 8.42% CAGR projected through 2031. This growth reflects changing consumer shopping habits, driven by advancements in digital platforms and the integration of social commerce. In 2024, China's cross-border e-commerce market reached 2.63 trillion yuan, showcasing its role in enabling global sporting goods distribution. Lululemon is a prime example of successful digital transformation, using direct-to-consumer strategies to drive growth while maintaining its premium brand image through a seamless blend of online and offline experiences. Amazon also plays a significant role in this channel, achieving a 13% increase in net sales to USD 143.3 billion. The company leverages AWS to optimize inventory and provide personalized recommendations, enhancing customer satisfaction. Online platforms enable specialized brands to reach global markets while utilizing customer data for tailored experiences. Companies investing in digital infrastructure and social media integration gain a competitive edge in this rapidly evolving channel.
Geography Analysis
In 2025, North America holds a 41.96% share of the market, driven by its strong sports culture, high disposable income, and well-developed retail infrastructure. The region's demand for sports equipment and apparel is consistently supported by major sporting events, professional leagues, and collegiate athletics. U.S.-based companies like Nike reported revenues of USD 51.4 billion in fiscal 2024, while Dick's Sporting Goods showed resilience with a 4.5% growth in comparable sales. Government initiatives, such as Title IX enforcement, are boosting youth sports participation and encouraging investments in women's athletics, which is increasing the demand for specialized equipment. Additionally, the Consumer Product Safety Commission (CPSC) continues to update safety standards across various product categories to ensure consumer protection.
Asia-Pacific is the fastest-growing region, with a projected CAGR of 8.36% through 2031. This growth is driven by strong manufacturing capabilities and a growing middle class participating in sports activities. In 2024, China's foreign trade reached 43.85 trillion yuan, with sporting goods exports from manufacturing hubs like Yiwu increasing by 44% year-on-year. India's National Sports Policy 2025 and the Production Linked Incentive scheme, with investments of INR 1.61 lakh crore, highlight the government's focus on improving sports infrastructure and manufacturing. Companies like Amer Sports are benefiting from this growth, reporting a 23% increase in revenue in the Greater China and Asia-Pacific markets. Rising disposable incomes and urbanization are boosting domestic consumption, while the region's cost-effective manufacturing supports global exports. Japan and Australia, as mature markets, demand premium products, while Southeast Asian countries are seeing rapid growth in sports participation across various categories.
Europe remains a key player in the market, known for its premium brand heritage and leadership in sustainability. The EU's Ecodesign for Sustainable Products Regulation is driving innovation in textile and footwear manufacturing. The region also enforces strict measures against counterfeit products, with authorities seizing 152 million fake items in 2023. PUMA reported a 4.4% growth in currency-adjusted sales, with direct-to-consumer channels growing by 16.6% and contributing 27.5% of total sales. Football continues to dominate the region, driving demand for apparel and equipment, while adventure sports equipment benefits from the popularity of Alpine tourism and outdoor recreation. South America, the Middle East, and Africa are emerging markets with significant growth potential due to increasing sports participation and infrastructure development. However, these regions face challenges such as economic instability and limited retail distribution networks.

Competitive Landscape
The sporting goods market is moderately fragmented, with global brands and regional players competing across various product categories. Leading companies like Nike, Inc., Adidas Group, Puma SE, Under Armour, Inc., and Decathlon SA focus on innovation, endorsements, and expanding their distribution networks to maintain a strong market presence. Global brands dominate due to their extensive reach and strong brand recognition, while regional players effectively cater to price-sensitive and niche customer groups. This mix of premium and mass-market offerings creates a competitive environment that provides opportunities for new entrants, even as established players continue to hold significant influence.
Technology is playing an increasingly important role in setting brands apart. Nike is at the forefront with its A.I.R. project, which uses AI-driven design, and its development of smart materials aimed at improving athletic performance. Patent activity is rising, particularly in wearable recovery technology. For example, Nike has partnered with Hyperice to develop innovations in "wearable recovery," while Adidas is advancing sports ball monitoring systems that offer real-time performance data. These technological advancements are shaping the future of the market and driving competition.
Opportunities are growing in segments such as women's sports equipment, adventure sports gear, and smart wearables. New players are leveraging social commerce and influencer partnerships to challenge established brands and attract consumers. The market increasingly rewards companies that combine technological innovation with sustainable practices and strong direct-to-consumer engagement, positioning themselves for long-term success in this evolving industry.
Sporting Goods Industry Leaders
-
Nike, Inc.
-
Adidas Group
-
Puma SE
-
Under Armour, Inc.
-
Decathlon SA
- *Disclaimer: Major Players sorted in no particular order

Recent Industry Developments
- June 2025: Polar, one of the leaders in wearable fitness technology, announced its plans to launch a revolutionary device and create a new product category. The company claims that this upcoming wrist-worn device will be its first to feature a screen-free and subscription-free design. It aims to track health, sleep, activity, and fitness seamlessly in the background—without notifications, distractions, or the need for a display.
- March 2025: NordicTrack has launched the Ultra 1, a premium treadmill that combines modern aesthetics with state-of-the-art fitness technology. The Ultra 1 is equipped with advanced features, including a cushioned, impact-absorbing deck for enhanced comfort, aviation-inspired metal controls for precision, and a smart wearable ring that allows users to make adjustments effortlessly. Furthermore, the treadmill's uprights house deluxe surround speakers, providing runners with high-quality sound for their music or streaming content, creating a fully immersive workout environment.
- December 2024: LVMH Luxury Ventures Fund (LLV) has acquired a minority stake in the Norwegian luggage and backpack brand Db, marking its first investment in Norway and only its second in Scandinavia after Our Legacy. This strategic investment will support Db plans for global expansion by leveraging LVMH’s luxury expertise.
- March 2024: G-FORM® has introduced a new sustainable mountain bike protection line aimed specifically at gravity riders, blending advanced safety features with environmental responsibility. The new line includes the Terra and Mesa knee and elbow guards, as well as the MX Spike Chest + Back Shirt, all designed to deliver a lightweight, breathable, yet robust shield for the most extreme mountain biking conditions, supporting both rider confidence and eco-friendly values.


Global Sporting Goods Market Report Scope
| Equipment |
| Proctective Gears |
| Sports Bags |
| Accessories |
| Outdoor Sports |
| Indoor Sports |
| Adventure Sports |
| Other Sport (Wheel/Gear Sports) |
| Women |
| Men |
| Kids |
| Off-line |
| On-line |
| North America | United States |
| Canada | |
| Mexico | |
| Rest of North America | |
| Europe | Germany |
| United Kingdom | |
| Italy | |
| France | |
| Spain | |
| Netherlands | |
| Poland | |
| Belgium | |
| Sweden | |
| Rest of Europe | |
| Asia-Pacific | China |
| India | |
| Japan | |
| Australia | |
| Indonesia | |
| South Korea | |
| Thailand | |
| Singapore | |
| Rest of Asia-Pacific | |
| South America | Brazil |
| Argentina | |
| Colombia | |
| Chile | |
| Peru | |
| Rest of South America | |
| Middle East and Africa | South Africa |
| Saudi Arabia | |
| United Arab Emirates | |
| Nigeria | |
| Egypt | |
| Morocco | |
| Turkey | |
| Rest of Middle East and Africa |
| By Product Type | Equipment | |
| Proctective Gears | ||
| Sports Bags | ||
| Accessories | ||
| By Sport Type | Outdoor Sports | |
| Indoor Sports | ||
| Adventure Sports | ||
| Other Sport (Wheel/Gear Sports) | ||
| By End User | Women | |
| Men | ||
| Kids | ||
| By Distribution Channel | Off-line | |
| On-line | ||
| By Geography | North America | United States |
| Canada | ||
| Mexico | ||
| Rest of North America | ||
| Europe | Germany | |
| United Kingdom | ||
| Italy | ||
| France | ||
| Spain | ||
| Netherlands | ||
| Poland | ||
| Belgium | ||
| Sweden | ||
| Rest of Europe | ||
| Asia-Pacific | China | |
| India | ||
| Japan | ||
| Australia | ||
| Indonesia | ||
| South Korea | ||
| Thailand | ||
| Singapore | ||
| Rest of Asia-Pacific | ||
| South America | Brazil | |
| Argentina | ||
| Colombia | ||
| Chile | ||
| Peru | ||
| Rest of South America | ||
| Middle East and Africa | South Africa | |
| Saudi Arabia | ||
| United Arab Emirates | ||
| Nigeria | ||
| Egypt | ||
| Morocco | ||
| Turkey | ||
| Rest of Middle East and Africa | ||


Key Questions Answered in the Report
What is the expected global value of the sports goods market in 2031?
The sporting goods market is projected to reach USD 151.43 billion by 2031, supported by a 6.11% CAGR during 2026-2031.
Which product category currently leads revenue?
Equipment leads with a 37.64% share in 2025, anchored by high-value fitness machinery and protective gear.
Which region is forecast to grow fastest?
Asia-Pacific is poised for an 8.36% CAGR thanks to policy incentives, rising incomes, and robust export capacity.
Why are online channels gaining share so quickly?
AI-powered personalization, live-stream commerce, and cross-border logistics allow brands to reach buyers directly while improving margins.
Page last updated on:


