
Field Hockey Equipment Market Size and Share
Market Overview
| Study Period | 2021 - 2031 |
|---|---|
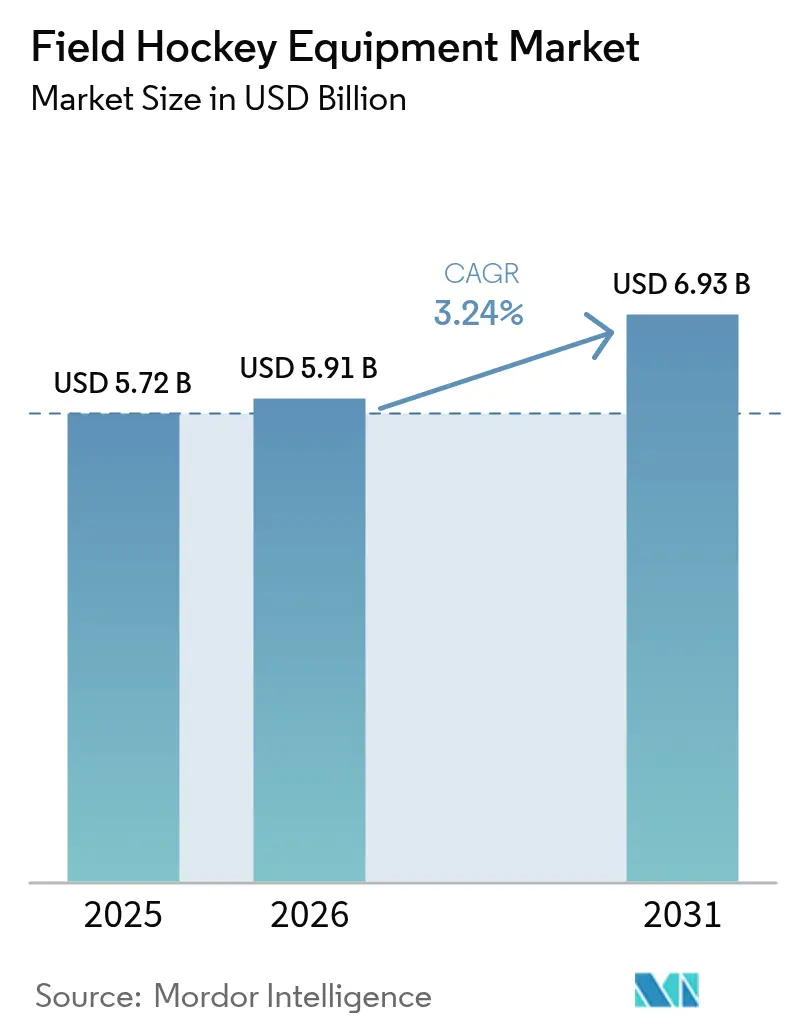
| Market Size (2026) | USD 5.91 Billion |
| Market Size (2031) | USD 6.93 Billion |
| Growth Rate (2026 - 2031) | 3.24 % |
| Fastest Growing Market | Europe |
| Largest Market | Asia Pacific |
| Market Concentration | Medium |
Major Players *Disclaimer: Major Players sorted in no particular order Image © Mordor Intelligence. Reuse requires attribution under CC BY 4.0. | |
Field Hockey Equipment Market Analysis by Mordor Intelligence
The field hockey equipment market size was valued at USD 5.72 billion in 2025 and estimated to grow from USD 5.91 billion in 2026 to reach USD 6.93 billion by 2031, at a CAGR of 3.24% during the forecast period (2026-2031). Adoption is expanding beyond longstanding European hubs as televised leagues, equal-prize women’s tournaments, and school programs increase demand for equipment. Broadcast contracts tied to the FIH Pro League and Hockey India League funnel fresh sponsorship cash toward clubs, driving sales of replica sticks, branded balls, and team apparel. Material innovation centered on carbon-fiber and graphene keeps premium stick prices high while enabling lighter shafts that tempt frequent upgrades. Regulatory mandates, most notably the FIH face-mask rule, effective January 2025, compress replacement cycles for protective gear. Meanwhile, turf expansion is shifting repeat-purchase patterns toward footwear, with players replacing turf shoes every 12-18 months to prevent ankle and knee trauma.
Key Report Takeaways
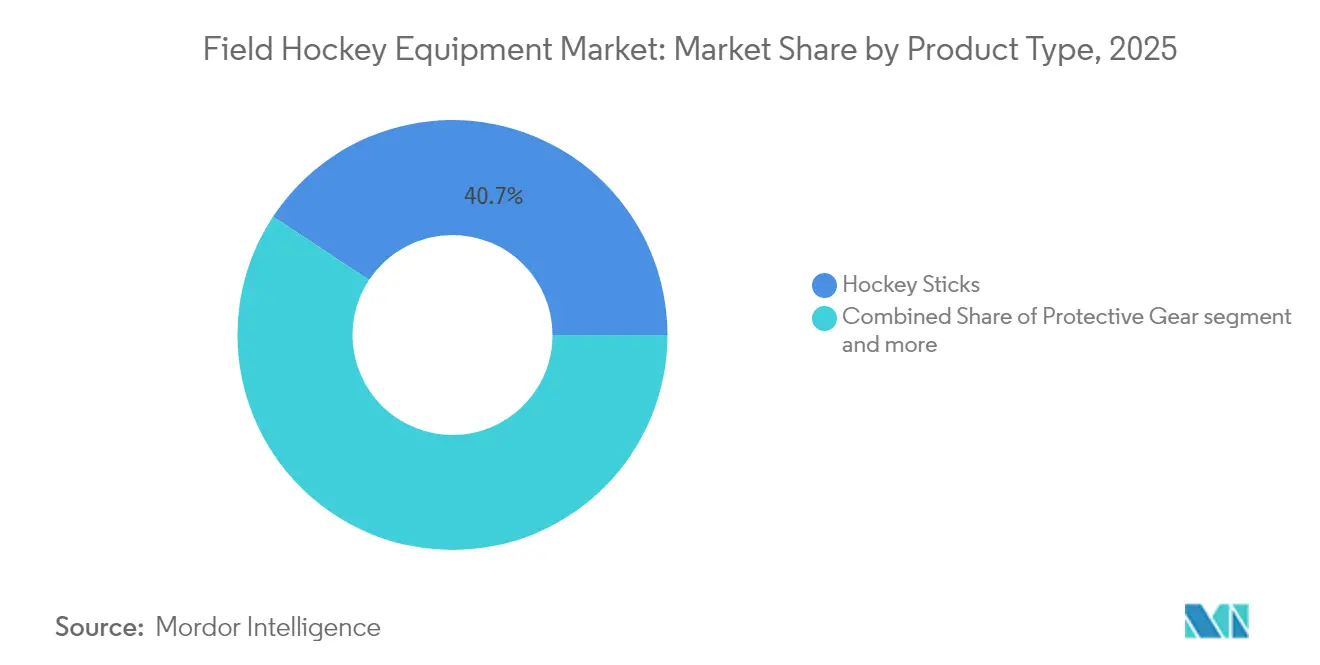
- By product type, composite and wooden sticks captured 40.72% of the field hockey equipment market share in 2025; footwear is projected to advance at a 3.86% CAGR through 2031.
- By end user, individual players held 66.78% of the field hockey equipment market size in 2025, while institutional buyers trailed with a lower CAGR of 3.74% toward 2031.
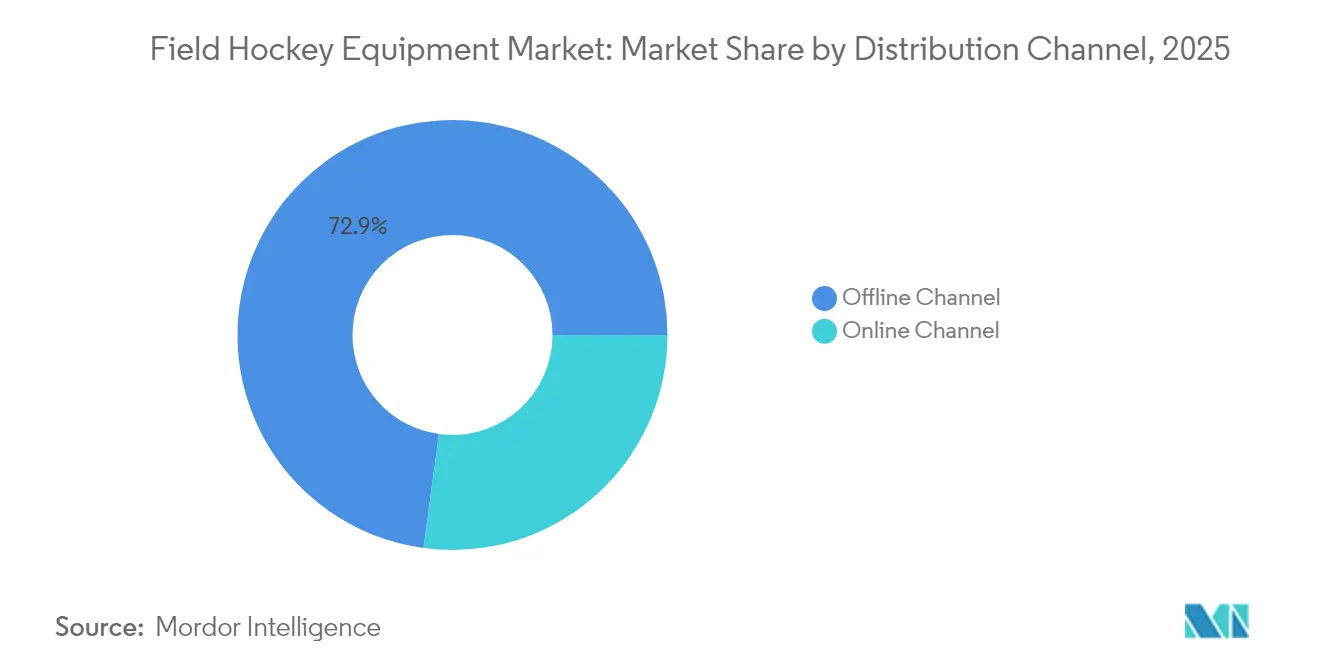
- By distribution channel, offline channels accounted for 72.85% of the revenue in 2025. Online platforms, on the other hand, are growing at a 4.96% CAGR, driven by free-return policies and virtual consultations.
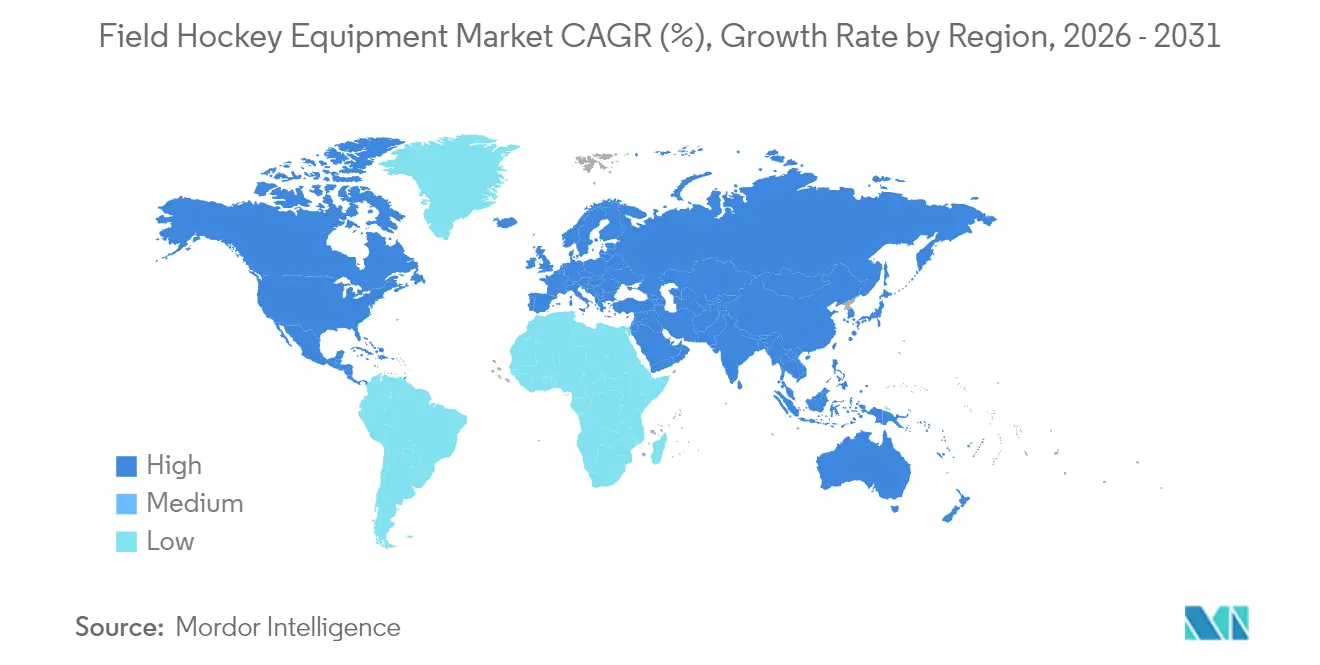
- By geography, Europe led the field hockey equipment market with a 38.02% market share in 2025; the Asia-Pacific region is forecast to post the fastest regional expansion at a 4.23% CAGR through 2031.
Note: Market size and forecast figures in this report are generated using Mordor Intelligence’s proprietary estimation framework, updated with the latest available data and insights as of 2026.
Market Trends and Insights
Drivers Impact Analysis of Field Hockey Equipment Market*
| Driver | (~) % Impact on CAGR Forecast | Geographic Relevance | Impact Timeline |
|---|---|---|---|
| Rising international tournaments and broadcast deals | +0.7% | Europe, Asia-Pacific, global streaming reach | Medium term (2–4 years) |
| Growing women’s participation | +0.6% | Europe, Asia-Pacific, North America | Long term (≥ 4 years) |
| Innovation in composite stick materials | +0.5% | Europe, North America | Short term (≤ 2 years) |
| Expansion of school-level sports programs | +0.4% | North America, Asia-Pacific, Africa | Long term (≥ 4 years) |
| Shift toward turf-optimized footwear | +0.3% | Netherlands, Germany, Australia, global turf sites | Medium term (2–4 years) |
| Rise of protective-gear regulations | +0.3% | Europe, Asia-Pacific, North America | Short term (≤ 2 years) |
| Source: Mordor Intelligence | |||
Rising International Tournaments and Broadcast Deals
Global visibility for hockey is expanding rapidly, with more than 600 annual FIH Pro League matches now streamed worldwide. Broadcasters such as Viacom18 in India and the BBC in the United Kingdom have secured multi-year rights deals, boosting sponsor exposure, according to the International Hockey Federation[1]. India’s revitalized Hockey India League has injected INR 925 crore (approximately USD 111 million) in franchise investments, a surge that is driving higher sales of replica sticks and team apparel, according to Hockey India[2]. Increased media coverage is also shortening the innovation-to-consumer cycle, as recreational players purchase signature sticks only weeks after they appear on televised matches. Meanwhile, the Watch.Hockey digital platform is widening access in markets like Kenya and Malaysia, helping stimulate grassroots participation. Tournament cycles further lift short-term demand for consumables, including balls and training bibs, as clubs allocate 15–20% additional budget during championship years.
Growing Women’s Participation in Field Hockey
The FIH’s equal-prize structure is prompting national federations to scale up women’s competitions, with England Hockey targeting a 50% gender balance by 2027. India’s league relaunch features six women’s franchises, catalyzing new endorsement activity for sticks engineered with narrower grips and lighter flex profiles, according to Hockey India. In the United States, the NCAA's expansion to nearly 300 colleges now supports more than 7,000 female athletes who view equipment purchases as performance investments rather than discretionary purchases, according to USA Field Hockey. Brands such as Osaka are responding by developing women-specific footwear with enhanced ankle stability, helping drive recurring seasonal purchases. This demographic shift is also strengthening demand for mid-tier composite sticks, as incoming players seek meaningful performance upgrades without committing to elite-level price points.
Innovation in Composite Stick Materials
Grays’ graphene-enhanced GR10000 model reduces vibration while preserving power transfer, supporting its GBP 329.99 premium positioning, according to Grays of Cambridge. Material parity is widening as suppliers such as Sigmatex and Toray license aerospace-grade carbon prepregs to multiple manufacturers, lifting baseline performance across brands. As a result, differentiation increasingly shifts toward bow geometry, feel, and athlete endorsements rather than proprietary materials. Osaka’s Pro Tour LTD, built with multi-directional carbon layers, maintains its “pop” for longer, addressing user concerns over premature flex degradation. Because carbon sticks tend to fail suddenly, many athletes replace them pre-emptively, accelerating turnover in the premium segment even as longevity still outperforms traditional wood sticks. At the same time, small brands like Ritual now have access to the same high-quality raw materials, enabling them to compete in mid-price tiers once dominated by long-established players.
Expansion of School-Level Sports Programs
USA Field Hockey’s collaboration with Skyhawks Sports Academy has introduced more than 20,000 children to the sport through equipment-inclusive clinics, lowering entry barriers for families and supporting grassroots expansion. In Australia, the Sporting Schools program reached 63,597 students in 2024, a 53% year-on-year increase, driven by subsidized starter kits supplied by Hockey Australia[3]. India’s Khelo India Youth Games are equipping rural clubs with composite sticks, generating early-stage demand that evolves into higher-value purchases as player skills progress. Across Africa, Kenya established more than 50 new clubs following the 2024 Africa Cup, driving significant growth in entry-level orders for balls, sticks, and footwear. These school- and youth-based pathways foster early brand familiarity, positioning manufacturers to secure long-term loyalty and capture higher-margin upgrade purchases as competitors enter the market.
Restraints Impact Analysis of Field Hockey Equipment Market*
| Restraint | (~) % Impact on CAGR Forecast | Geographic Relevance | Impact Timeline |
|---|---|---|---|
| High cost of premium composite sticks | –0.4% | Africa, South America, Southeast Asia, lower-income clubs | Medium term (2–4 years) |
| Injury concerns limiting youth participation | –0.3% | North America, Europe, Asia-Pacific | Long term (≥ 4 years) |
| Slow integration of smart/tech-enabled gear | –0.2% | Elite centers in Europe, Australia; low retail uptake elsewhere | Long term (≥ 4 years) |
| Inconsistent equipment regulations | –0.2% | Disparities between FIH, national federations | Medium term (2–4 years) |
| Source: Mordor Intelligence | |||
High Cost of Premium Composite Sticks
Premium sticks priced above GBP 300 exceed monthly incomes in regions such as Kenya and Argentina, reinforcing perceptions of field hockey as an elite sport, according to Grays of Cambridge. In the Netherlands, youth membership declined by 12.6% between 2018 and 2023, with equipment costs cited as a key contributor to attrition, according to the Royal Dutch Hockey Association (KNHB)[4]. Retailers attempt to ease affordability by discounting previous-season models by 25-30%, but this conditions consumers to wait for markdowns, weakening full-price launch sales. Mid-range fiberglass sticks, typically priced at GBP 130-180, offer a cost compromise, yet they are heavier and less responsive, which can deter competitive players. Meanwhile, limited financing or rental schemes, beyond a handful of Dutch clubs, continue to constrain uptake in emerging markets.
Injury Concerns Limiting Youth Participation
According to the U.S. Centers for Disease Control and Prevention (CDC), field hockey ranks seventh among youth sports for concussion incidence, with 60% of cases resulting from stick or ball contact[5]. A 2024 study in Korea reported an overall injury rate of 27.3%, predominantly involving ankle and knee trauma, contributing to parental hesitation. FIH regulations mandate the use of masks only for penalty corners, leaving head impacts during open play largely unprotected. In the United States, high school field hockey participation remains modest relative to soccer, partly because school districts prioritize lower-risk sports. Without consistent access to rehabilitation support, injured players often discontinue their participation, thereby reducing the long-term talent pool.
*Our forecasts treat driver/restraint impacts as directional, not additive. The impact forecasts reflect baseline growth, mix effects, and variable interactions.
Field Hockey Equipment Market Segment Analysis
By Product Type:
Composite Sticks Lead Revenue, Footwear Captures MomentumIn 2025, sticks accounted for 40.72% of the global field hockey equipment market, driven by composite shafts retailing between GBP 200 and 330 from brands such as Grays of Cambridge. Wooden sticks remain primarily confined to schools and nostalgia-driven segments, priced below GBP 50. Footwear, with a projected CAGR of 3.86%, is the fastest-growing category, supported by the proliferation of artificial turf in Europe and Australia. Premium turf shoes, priced between USD 120 and 210, feature toe guards and lateral cleats that mitigate injury risk. Protective gear is gaining regulatory attention, though adoption beyond helmets and masks remains uneven due to comfort concerns. Balls and accessories remain steady consumables, with clubs replenishing stock each season.
Composite sticks dominate the market because carbon fiber preserves flex consistency, prompting elite players to upgrade for incremental performance gains. However, high prices limit penetration in emerging markets, leading brands to introduce mid-tier fiberglass-carbon hybrids priced under GBP 160. Footwear replacement cycles are shorter, ranging from 12 to 18 months, compared to up to two years for sticks, thereby enhancing lifetime player value. Protective equipment experiences occasional demand spikes around new regulations, with the 2025 mask mandate expected to temporarily boost volumes. Accessories, while low-margin, increase online basket value as consumers add items such as gloves, grip tape, and bags to reach free-shipping thresholds.

By End User:
Individual Players Drive Growth Through Direct-to-Consumer ChannelsIndividual consumers generate 66.78% of global field hockey equipment revenue and are projected to grow at a 4.11% CAGR, driven by robust e-commerce ecosystems. Online portals, such as Longstreth and JustHockey, offer virtual flex consultations and free returns, providing access to broader assortments at prices 10–15% lower than traditional retail. Institutional buyers, such as schools, clubs, and associations, benefit from bulk discounts but typically place orders on an annual cycle, which limits the frequency of purchases. Social media–driven direct sales via Instagram and TikTok influencers accelerate impulse buying immediately after televised matches.
Rising women’s participation further expands the individual segment, as female athletes seek narrower grips and lighter sticks, often overlooked in bulk procurement. Subscription models, charging EUR 30–50 per month for rotating gear, reduce upfront cost barriers while securing predictable revenue streams for brands. In the Netherlands, adult recreational leagues help offset declines in youth participation, with 25–35-year-olds willing to invest in premium equipment. In emerging markets such as Kenya, Malaysia, and rural India, institutional budgets rely heavily on grants, leading to sporadic and unpredictable demand.
By Distribution Channel:
Online Expands, Offline Retains High-Ticket AdvantageOffline retail continues to dominate, accounting for 72.85% of field hockey equipment sales in 2025, as tactile trials remain critical for first-time buyers of sticks and shoes. In-store technologies, such as pressure mapping, allow consumers to evaluate bow geometry and shoe fit in real-time. Nevertheless, online channels are expanding at a 4.96% CAGR through 2031, aided by enhanced sizing guides and free two-way shipping that help bridge the tactile gap. Major e-commerce platforms, including HockeyDirect, now list over 450 stick SKUs, facilitating easy comparison shopping.
Brick-and-mortar outlets achieve higher average order values (USD 200–300) through accessory cross-selling and staff-driven upselling of premium models. Online carts average USD 150–200 but benefit from faster closure via one-click payment tools. The COVID-19 pandemic accelerated digital adoption, raising online penetration to 27.15% in 2025. Hybrid omnichannel strategies are emerging, with stores offering click-and-collect services that combine the efficiency of online ordering with in-store expertise.
Geography Analysis
Europe Field Hockey Equipment Market
Europe accounted for 38.02% of the global field hockey equipment revenue in 2025, driven by strong participation and robust infrastructure. The Netherlands, with 256,565 KNHB members, over 950 pitches, and 325 clubs, remains the regional anchor. Germany sustains junior interest through its 400+ clubs and Olympic pedigree, while Belgium leverages its Tokyo 2020 gold medal to unlock youth funding, according to the German Hockey Federation (DHB). England’s gender-parity initiatives are driving demand for women-specific equipment. However, youth participation has declined in parts of Western Europe due to cost concerns and competition from other sports, which could constrain long-term volumes.
APAC Field Hockey Equipment Market
Asia-Pacific is projected to expand at a 4.23% CAGR through 2031. India’s INR 925 crore Hockey India League restart is fueling capital inflows, while the Khelo India kits distribution initiative equips 36 state units, establishing clear upgrade pathways. Australia’s preparation for the 2032 Brisbane Games is accelerating pitch resurfacing, boosting orders for turf shoes and balls. Malaysia, China, and Japan maintain competitive national teams but lack franchise structures that translate fan engagement into repeat consumer purchases.
The Americas and MEA Field Hockey Equipment Market
North America remains a niche market. Approximately 60,000 U.S. high-school field hockey players pale in comparison to soccer’s 400,000 participants, and turf installation costs above USD 500,000 limit club expansion, per USA Field Hockey. NCAA women’s programs, however, generate a concentrated premium-stick consumer base willing to pay top-tier prices. Canada and Mexico lag, with demand concentrated among immigrant communities and occasional international tournaments. Emerging markets are seeing gradual growth. Kenya established 50 clubs following the 2024 Africa Cup, while South Africa, the UAE, and Argentina experience sporadic expansion but face high tariffs that inflate gear costs. Latin American markets are constrained by currency volatility, which suppresses discretionary imports and limits adoption of high-end composite sticks.
Regulatory Landscape
International play is shaped by the International Hockey Federation (FIH) Rules of Hockey and its FIH Quality Programme, which sets test and approval pathways for match-critical field equipment (for example, goals and rebound boards) and for personal protective equipment used in elite competition. The report scope also includes the FIH face-mask rule effective January 2025, which accelerated compliance-driven replacement cycles for penalty-corner protection in many organized leagues and institutions.
Beyond FIH requirements, manufacturers and distributors also need to meet region-specific safety and product standards that affect design, labeling, and market access. In Europe, protective equipment aligns with EN 13546:2002+A1:2007 and the EU PPE Regulation 2016/425, while in the United States ASTM F2713-18 sets requirements for field hockey eye protectors. Ball compliance is similarly governed by formal specifications (for example, NOCSAE ND 069-14m17) and chemical-safety obligations such as REACH-related conformity statements, which link regulatory adherence to materials selection and upstream supplier controls.
Competitive Landscape
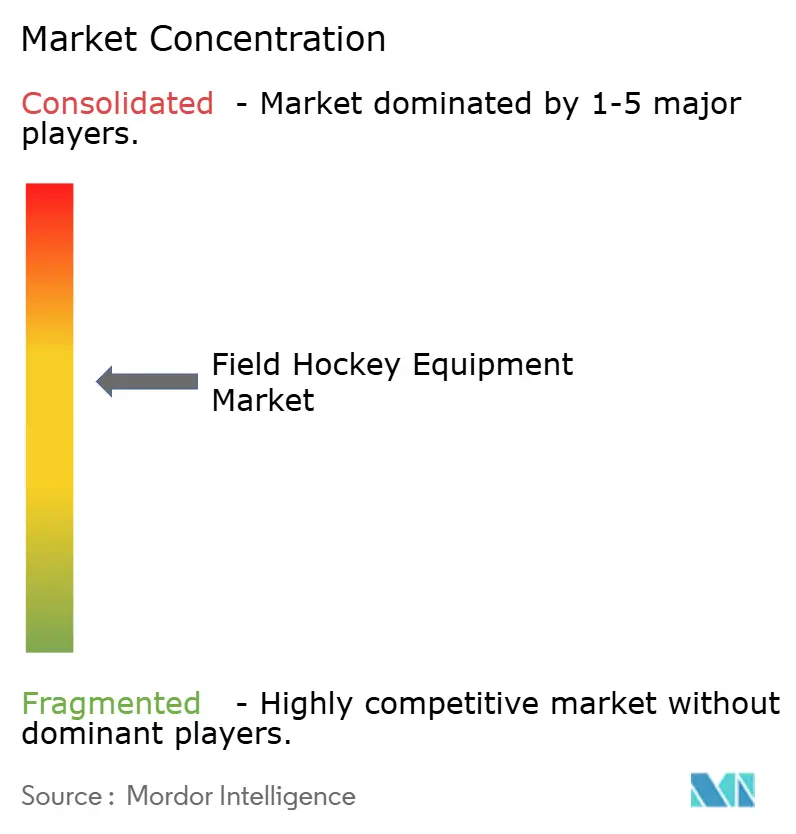
The global field hockey equipment market is moderately fragmented, with leading players such as Adidas, Grays, STX, Osaka, and Gryphon holding significant market shares; however, smaller brands continue to exert competitive pressure. Adidas leverages FIH sponsorships and sells sticks in the EUR 250-380 range; however, its broad sports portfolio dilutes its focus on field hockey-specific research and development. Grays’ graphene-infused GR series exemplifies material-driven premiumization, though similar carbon layups among competitors have intensified commodity-like pricing pressures, forcing differentiation toward bow geometry, flex profiles, and athlete endorsements.
Mid-tier challengers such as Ritual and Princess Sportsgear exploit direct-to-consumer platforms to undercut traditional retail by 20-30%, capturing price-sensitive buyers and reshaping expectations around affordability. Protective-gear specialists OBO and Gryphon quickly capitalized on the 2025 mask mandate, scaling certified products to meet institutional and club orders. Technology innovation remains an untapped frontier: pilot smart sticks incorporating sensors and performance analytics remain prohibitively expensive; however, the first brand to achieve durability and affordability could capture the elite 15% of performance-focused athletes.
Footwear is the most contested segment, fueled by the expansion of artificial turf in Europe, Australia, and Asia-Pacific, which drives frequent replacement cycles. Adidas and Grays compete with Kookaburra and Asics for heel-stability patents, athlete endorsements, and design innovations that reduce injury risk while maintaining performance. Meanwhile, regional labels are increasingly leveraging e-commerce to bypass traditional distribution channels. Dutch company Brabo and Australian brand Dita employ Instagram micro-influencers and flexible drop-shipping models to market composite sticks priced between GBP 160-230, reaching younger and digitally native players.
Subscription-based programs hosted by platforms such as HockeyDirect and JustHockey provide rotating gear for EUR 30-50 per month, enabling players to access premium products without upfront ownership while ensuring continuous brand exposure. This model is pressuring established brands to rethink annual product launch cycles, shift toward mid-tier and entry-level offerings, and explore omnichannel approaches that integrate in-store trials with digital convenience. Overall, competition is intensifying across price tiers, product categories, and distribution channels, as both global incumbents and agile regional players vie for market share in an evolving, performance-driven landscape.
Field Hockey Equipment Industry Leaders
-
Adidas AG
-
Grays of Cambridge (International) Ltd
-
Gryphon Hockey Ltd
-
Osaka World
-
STX LLC
- *Disclaimer: Major Players sorted in no particular order
Field Hockey Equipment Market Companies Covered in this Report
- Grays International
- Gryphon Hockey
- Adidas AG
- STX, LLC
- Osaka Hockey
- Dita Hockey
- Mazon Hockey
- TK Hockey Equipment GmbH
- OBO Hockey
- Voodoo Hockey
- Brabo Hockey
- Princess Sportsgear
- Mercian Sports
- Byte Sports
- Ritual Hockey
- JDH Hockey
- Kookaburra Sport Pty Ltd
- Atlas Hockey
- Slazenger
- CranBarry Inc.
Market Opportunities and Future Outlook
FIH quality and technical specifications create clear demand for suppliers that can deliver certified, competition-ready protective gear and match consumables at scale. A concrete signal is the FIH Quality Programme listing that showed Mercian Hockeys Evolution Facemask as pending certification (August 2025), highlighting the commercial pull of moving products from development into approved status as leagues and institutions standardize around compliant face protection after the January 2025 mask mandate.
Rules and surface changes are also shaping product roadmaps. The FIH Specification for Self-Wetting Balls (Ver. 1 Sept 2024) supports the shift toward non-irrigated dry turfs, giving ball makers a standards-led pathway to meet performance requirements under the updated specification. At the same time, continued expansion in streamed competitions (including FIH Pro League distribution via Watch.Hockey and major broadcast rights holders) and womens participation programs support direct-to-consumer ranges that reduce decision friction through ratings, fit tools, and returns, while extending women-specific grips, flex profiles, and footwear aligned to turf replacement cycles.
Recent Industry Developments in Field Hockey Equipment Market
- June 2026: Adidas launched its 2026/27 field hockey stick and shoe range and revised the stick power rating system, moving from a .1-.8 format to a .10-.95 scale. The updated scale aims to make performance differentiation clearer across models, supporting conversion in both specialist retail and online channels where shoppers compare specifications quickly.
- May 2026: Gray-Nicolls Sports Pty Ltd, within the Grays portfolio, acquired Russell Corp Australia, effective May 4, 2026. The deal expands the groups footprint in the Australian sporting-goods ecosystem and can strengthen regional distribution leverage for hockey equipment through broader retail and club relationships.
- December 2024: Nike entered the British hockey stick market with its first collection, offering Laser, Shadow, and Pursuit models in Max, High, and Mid Carbon variants with prices starting around GBP 150. The new global sportswear entrant into sticks increased competitive intensity in the UK, particularly in the mid-to-premium composite segment where brand pull can shift shelf space and consumer trials.
Field Hockey Equipment Market Report Scope and Research Methodology
Market Definition and Coverage
For this study, the field hockey equipment market is defined as the revenue generated from core playing and safety equipment used for field hockey, across retail and institutional purchases, measured in USD.
Scope exclusions: Apparel and general sportswear not designed specifically for field hockey, along with turf installation services, are excluded from this market sizing.
Segments Covered in This Report
- By Product Type
- Hockey Sticks
- Wooden Sticks
- Composite Sticks
- Protective Gear
- Helmets
- Gloves
- Others
- Balls
- Footwear
- Accessories
- Hockey Sticks
- By End User
- Individual Players
- Institutional
- By Distribution Channel
- Offline Channel
- Online Channel
- By Geography
- North America
- United States
- Canada
- Mexico
- Rest of North America
- Europe
- United Kingdom
- Germany
- France
- Italy
- Spain
- Russia
- Netherlands
- Sweden
- Belgium
- Rest of Europe
- Asia-Pacific
- China
- Japan
- India
- Australia
- Malaysia
- South Korea
- Rest of Asia-Pacific
- South America
- Brazil
- Argentina
- Rest of South America
- Middle East and Africa
- United Arab Emirates
- South Africa
- Saudi Arabia
- Kenya
- Rest of Middle East and Africa
- North America
Data Sources, Market Sizing, and Validation
Desk Research
Desk work starts with pinning down the demand pool and the rules that shape replacement cycles, and then mapping these signals back to equipment revenue. We refer to public sources such as FIH rule updates and guidance, national sports-participation releases, school and collegiate athletics portals, and trade statistics from UN Comtrade where relevant for equipment trade flows. For broader context, we also use sources such as the World Bank and OECD for macro indicators that help explain consumer spending and sports participation trends.
To make the model practical, company annual reports, investor presentations, and reputable press coverage are used to understand product mix, pricing direction, and channel shifts between offline stores and online retail. Patent databases are reviewed selectively to sanity-check material trends, for example, composite stick designs and protective gear features that can move average selling prices over time. We also use paid subscriptions for company financials and news intelligence when public disclosures are limited, mainly to confirm revenue ranges and timing of major product launches. These desk sources are not exhaustive, and additional public references were used to collect, cross-check, and clarify the data.
Primary Interviews and Surveys
Primary work is used to test what the desk signals imply in real buying behavior, especially around how often sticks, balls, shoes, and protective gear are replaced across player levels. We speak with manufacturers, distributors, retailers, coaches, and institutional buyers to confirm pricing ranges, channel margins, and how practical rule changes affect demand across APAC, Europe, the Americas, and smaller playing markets. When the inputs disagree, we re-contact a smaller set of respondents to close gaps and keep assumptions consistent across regions.
Distribution of primary research fieldwork respondents
| Company type | Respondent position | Region |
|---|---|---|
| Top tier: 39% | CXOs: 12% | APAC: 52% |
| Mid tier: 41% | Functional/Unit leaders: 33% | EMEA: 30% |
| Smaller Players: 20% | Managers: 55% | Americas: 18% |
Market-Sizing & Forecasting
Sizing is built using top-down and bottom-up logic, but the core build starts from a demand-pool view tied to participation and replacement. In practice, we reconstruct value by linking active player bases and institutional programs to typical equipment baskets, and then applying region-appropriate replacement cycles and price bands for sticks, balls, shoes, protective gear, and accessories.
A few inputs that matter in this market include participation growth by region, the share of players using composite versus wood sticks, safety-rule adoption that can lift protective gear demand, for example, face-mask usage, the offline versus online channel split, and price movement tied to material and design upgrades. Where the data is thin, gaps are handled by using bounded ranges from interviews, then aligning them with observed channel behavior and product mix. After the top-down build is complete, selective bottom-up checks are applied, such as sampled price times volume math for key product categories and channel checks with distributors and retailers, which are then used to adjust the final totals.
For forecasting, we mainly use scenario analysis, since participation, institutional funding, and price movement can shift differently by region. The scenarios are anchored on the most consistent drivers from interviews, and then translated into year-by-year growth paths so the forecast stays explainable and repeatable.
Data Validation & Update Cycle
Validation is done through several passes so the final number is not driven by one assumption. Model outputs are checked against independent signals such as participation direction, major rule or tournament changes, and channel expansion patterns, and then any outliers are reviewed before sign-off. If a region shows a sharp swing that cannot be explained by these signals, we revisit the underlying price bands, replacement cycles, and channel splits and then re-check them with primary contacts.
Reports are refreshed on an annual schedule, and interim updates are triggered when material events occur, such as major rule changes, macro shocks that affect discretionary spend, or visible pricing shifts. Before delivery, an analyst performs a fresh pass of key inputs so clients receive the most current view available at that time.
Mordor Intelligence's Field Hockey Equipment Market Estimate Compared With Other Published Estimates
Published market sizes for field hockey equipment can look far apart, even when they are describing the same sport, because the boundaries are not always consistent. In our experience, the biggest differences usually come from what is counted as equipment, which year is used as the reference point, and how prices and replacement cycles are handled across regions.
By tracking replacement frequency, channel mix, and rule-led protective gear adoption, Mordor Intelligence keeps the 2025 total tied to an equipment-only basket, while some estimates expand the scope to include broader gear and apparel lines or rely on a different base year and price curve.
Benchmark comparison
| Source | Market Size | Gaps in Research Methodology |
|---|---|---|
| Mordor Intelligence | USD 5.72 B (2025) | |
| Global Consultancy A | USD 6.50 B (2024) | Uses a different base year and product list that can fold in wider gear and adjacent apparel-type lines, which tends to raise the starting value versus an equipment-only basket. |
| Industry Publisher B | USD 7.64 B (2024) | Shows a higher 2024 starting point that likely reflects broader scope and more aggressive price assumptions, with less clarity on how replacement cycles and regional channel splits were validated. |
The comparison shows that year choice and what is included in the equipment basket explain much of the spread, and price progression assumptions can widen it further. When the scope is kept tight and the drivers are tied back to participation, replacement, and channel behavior, the resulting market size stays easier to audit and update as conditions change.
Key Questions Answered in the Report
How fast is the field hockey equipment market expected to grow through 2031?
The global market is projected to expand at a 3.24% CAGR, moving from USD 5.72 billion in 2025 to USD 6.93 billion by 2031.
Which product category is growing the quickest?
Turf-optimized footwear shows the fastest momentum, forecast at a 3.86% CAGR as artificial pitches proliferate worldwide.
What share do individual players hold in equipment spending?
Individual players account for 66.78% of 2025 revenue and are set to outpace institutional buyers with a 4.11% CAGR through 2031.
Which region will post the strongest growth?
Asia-Pacific, led by India and Australia, is slated to record a 4.23% CAGR, outstripping mature European markets.
Are smart sticks likely to hit the mass market soon?
Not immediately; high costs and durability challenges delay widespread adoption, though niche demand exists among elite athletes.