Specialty Tea Market Size and Share
Market Overview
| Study Period | 2021 - 2031 |
|---|---|
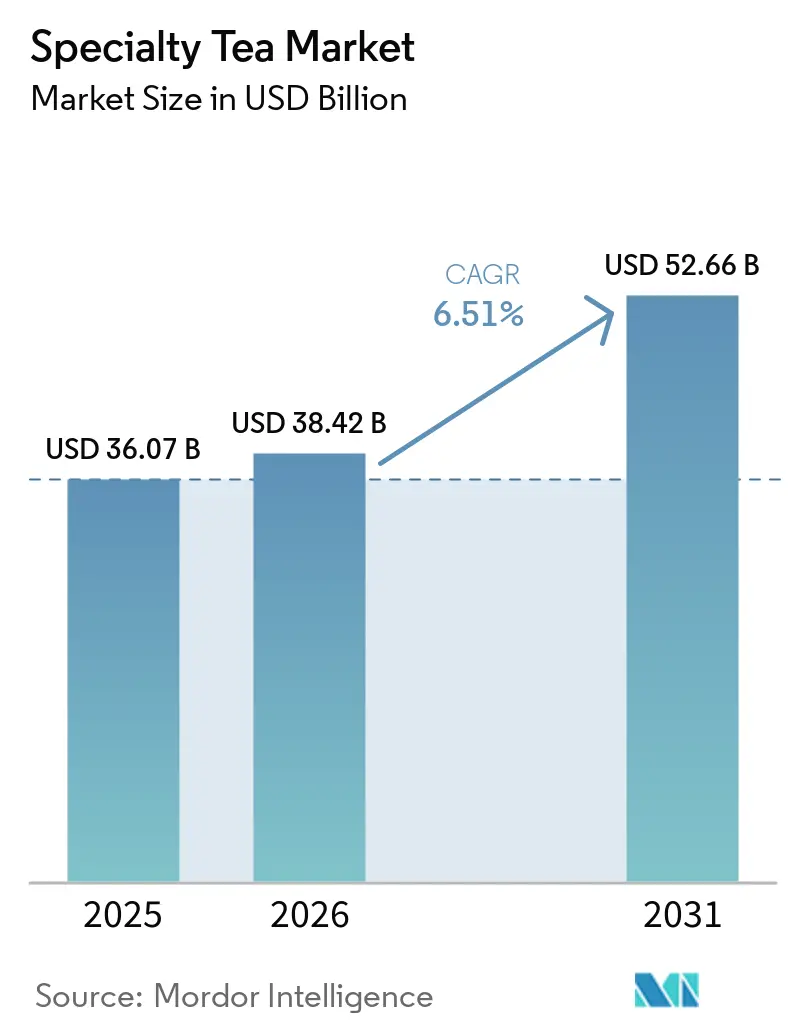
| Market Size (2026) | USD 38.42 Billion |
| Market Size (2031) | USD 52.66 Billion |
| Growth Rate (2026 - 2031) | 6.51% CAGR |
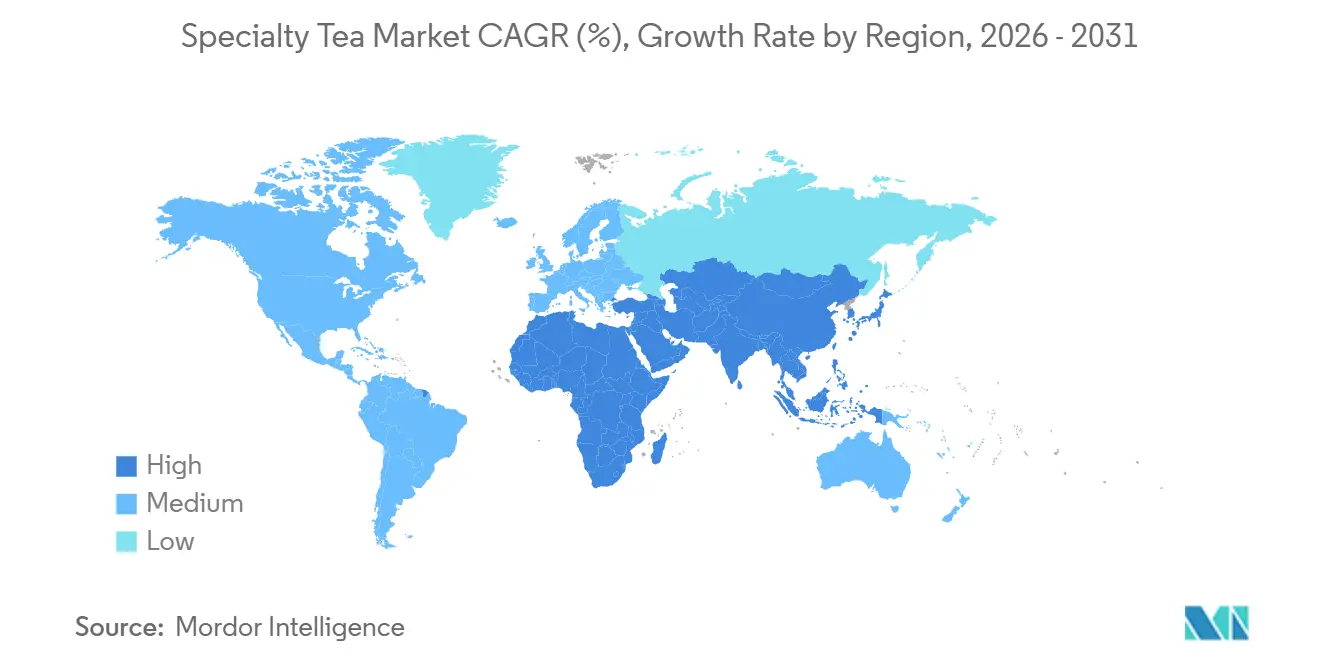
| Fastest Growing Market | Middle East and Africa |
| Largest Market | Asia-Pacific |
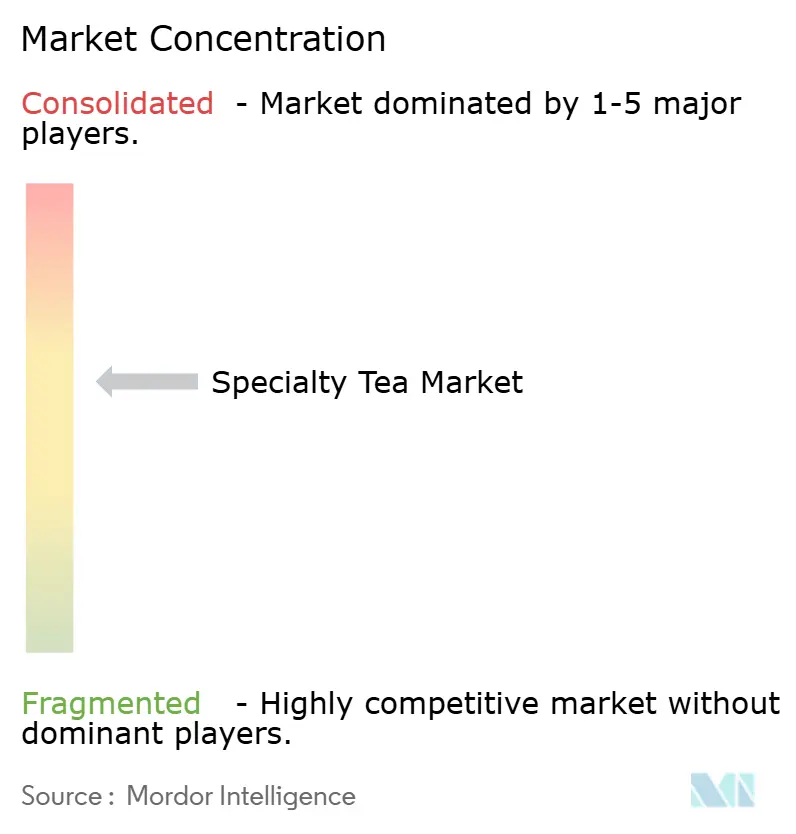
| Market Concentration | Medium |
Major Players
*Disclaimer: Major Players sorted in no particular order Image © Mordor Intelligence. Reuse requires attribution under CC BY 4.0. |
|
Specialty Tea Market Analysis by Mordor Intelligence
The Specialty Tea market size was valued at USD 36.07 billion in 2025 and estimated to grow from USD 38.42 billion in 2026 to reach USD 52.66 billion by 2031, at a CAGR of 6.51% during the forecast period (2026-2031). Consumers are increasingly gravitating towards functional wellness, opting for polyphenol-rich teas instead of traditional refreshments. With a projected CAGR of 8.91%, Green Tea is set to capture a larger share of consumer wallets, even as Black Tea, which commanded 39.62% of the 2025 revenue, remains a significant player. Regulatory shifts are also influencing the market; the USDA's 2024 National Organic Program Identifier rule has tightened the supply of certified teas and elevated price floors. This move incentivizes growers to either certify their produce or enhance their agronomy practices. On-Trade venues, including cafés and hotels, are driving a wave of premiumization. By spotlighting single-origin matcha and cold-brewed oolong, they're outpacing Off-Trade growth. Meanwhile, innovations in packaging, particularly with compostable and recyclable pouches, are not only reducing carbon footprints and enhancing fill efficiency but also bolstering brand narratives centered on sustainability.
Key Report Takeaways
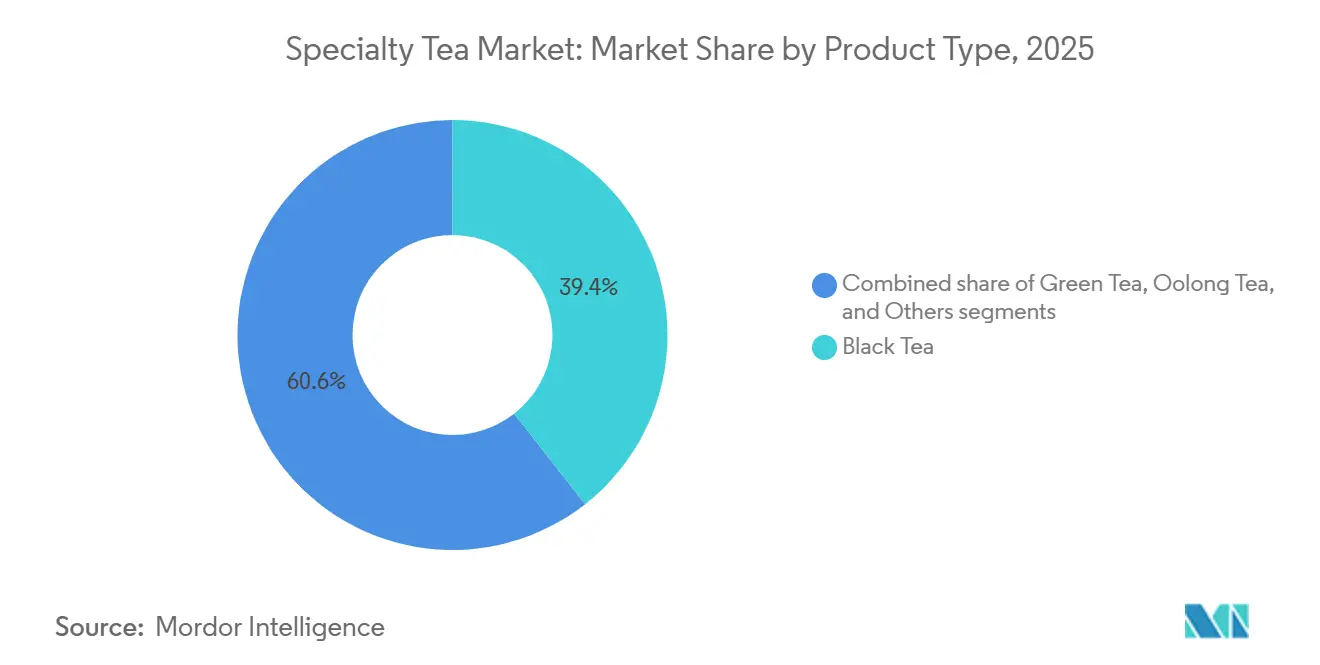
- By product type, Black Tea led with 39.62% Specialty Tea market share in 2025, while Green Tea is projected to post the fastest 8.91% CAGR over 2026-2031.
- By category, Conventional teas commanded 87.71% of 2025 volume; however, the Organic segment is on track for a 9.56% CAGR through 2031.
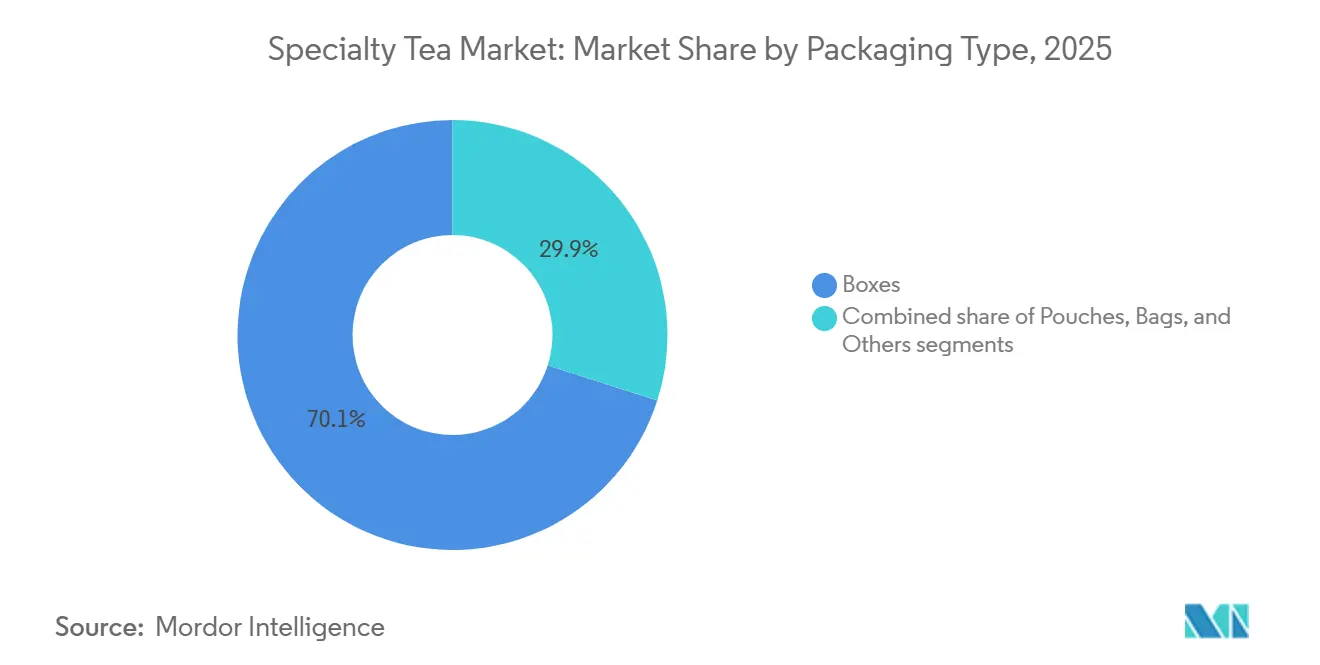
- By packaging, Boxes held a 70.27% revenue share in 2025, yet Pouches are forecast to grow at an 8.43% CAGR.
- By distribution channel, Off-Trade accounted for 72.58% of revenue in 2025, while On-Trade is expected to expand at a 9.79% CAGR during 2026-2031.
- By geography, Asia-Pacific retained 37.51% of 2025 revenue, but the Middle East and Africa region is set to record a 9.81% CAGR through 2031.
Note: Market size and forecast figures in this report are generated using Mordor Intelligence’s proprietary estimation framework, updated with the latest available data and insights as of January 2026.
Global Specialty Tea Market Trends and Insights
Drivers Impact Analysis*
| Driver | (~) % Impact on CAGR Forecast | Geographic Relevance | Impact Timeline |
|---|---|---|---|
| Growing focus on health and wellness | +1.2 | North America, Europe, urban Asia-Pacific | Medium term (2-4 years) |
| Expanding café culture and specialty outlets | +1.0 | North America, Europe, Middle East, China, India | Short term (≤ 2 years) |
| Clean-label and organic preference surge | +0.9 | Europe, North America, Australia, Japan, South Korea | Medium term (2-4 years) |
| Premiumization of artisanal blends | +0.8 | North America, Western Europe, Japan, Singapore | Long term (≥ 4 years) |
| Functional botanicals and adaptogens integration | +0.7 | North America, Australia, urban India, Middle East | Short term (≤ 2 years) |
| Blockchain-enabled provenance verification | +0.3 | Europe, North America, select Asia-Pacific | Long term (≥ 4 years) |
| Source: Mordor Intelligence | |||
Growing focus on health and wellness
With a growing emphasis on physical and mental well-being, consumers are increasingly turning to specialty teas. According to the 2024 IFIC Food and Health Survey, 74% of consumers are choosing foods and beverages for their specific health benefits, particularly for stress relief, improved sleep, and boosted immunity[1]Source: International Food Information Council, “2024 Food & Health Survey,” ific.org. Studies published in 2025 validate that a daily intake of 300-500 mg of EGCG can bolster cardiovascular and cognitive functions. This finding has heightened interest in matcha, known for its superior EGCG concentrations. In response to this trend, Japan exported 8,798 tons of matcha in 2024, fetching JPY 36.4 billion, marking a significant 25% increase. Product developers are now blending Green Tea with ashwagandha and reishi, capitalizing on the calming effects of theanine (200 mg per cup) to offer stress relief without sedation. This innovation is evident in The Republic of Tea’s SuperShroom collection, launched in March 2026. While social media buzz (#matcha boasts over 500 million views) is driving adoption, the market's sustained growth will rely more on consistent health outcomes and clear labeling than on influencer endorsements.
Expanding café culture and specialty tea outlets
Specialty cafés are now anchoring their margins on tea, with cup prices soaring to three to four times that of comparable Off-Trade servings. This shift highlights the growing consumer demand for premium tea experiences, which offer higher profitability for cafés. By Q3 FY2026, Tata Starbucks surpassed the milestone of 500 stores in India, introducing cold-brewed oolong and nitro green tea lines that align with local preferences, showcasing their strategy to cater to evolving consumer tastes. In 2024, Dubai’s DMCC Tea Centre processed over 24,400 metric tons of tea, representing more than half of the global tea re-exports. This significant volume has played a pivotal role in energizing premium tea lounges throughout the Gulf, further solidifying the region's position as a global tea hub. Suppliers are bolstering this trend by offering barista training and tailored HoReCa bulk packs, empowering independent cafés to focus on curation rather than sheer scale, thereby enabling them to compete effectively in the premium tea market.
Clean-label and organic preference surge
As concerns about ingredient transparency, food safety, and sustainability rise, consumers are turning to clean-label and organic teas in the specialty tea market. According to the 2024 IFIC Food and Health Survey, 67% of consumers are on the lookout for products boasting "clean ingredients," while almost 50% favor those marked as "organic" or "free from artificial ingredients"[2]Source: International Food Information Council,“2024 Food & Health Survey,” ific.org. With supply constraints, auction prices for Kyoto's organic matcha surged by 170% year-on-year, reflecting increased demand and limited availability. European consumption of organic tea is on an upward trajectory, growing nearly 12% annually and now accounting for about 15% of the region's demand, driven by rising consumer awareness of its health and sustainability benefits. In March 2026, The Republic of Tea rolled out SKUs certified as Regenerative Organic, signaling a shift in industry priorities. Soil-health metrics are now taking precedence over traditional pesticide-free claims as the new benchmark for quality, emphasizing long-term environmental impact. Among millennials and Gen Z, the demand for clean labels is becoming standard. These consumers often verify ingredient lists using third-party apps before making a purchase, showcasing their preference for transparency and trust in product sourcing.
Premiumization of artisanal blends
In March 2026, Twinings introduced blockchain QR codes and packaging made from 80% recycled materials to its premium blends, underscoring its commitment to provenance and sustainability. The blockchain QR codes allow consumers to trace the origin of the tea, ensuring transparency in sourcing and production processes, while the recycled packaging aligns with growing environmental concerns and consumer demand for eco-friendly products. In 2024, Kenya's 41 specialty processors produced 7.51 million kg, a mere 1.26% of the nation's total output[3]Source: United States Department of Agriculture, "Brewing Trends - Analysis of Kenya's Tea Industry", apps.fas.usda.gov. Yet, thanks to the premium prices commanded by orthodox methods, value-added exports surged by 10%, reaching 28.90 million kg. Orthodox processing methods, which involve traditional hand-rolling techniques, enhance the quality and flavor profile of the tea, making it more appealing in international markets. The ISO/TR 21380:2022 standard safeguards the integrity of matcha, emphasizing the value of shade-grown and stone-milled origins from Japan. This standard ensures that authentic matcha retains its unique characteristics and scarcity value, protecting it from dilution in the global market. Meanwhile, artisanal producers, by weaving rich narratives and highlighting sensory nuances, are achieving unit prices that are five to ten times higher than standard commodity rates.
Restraints Impact Analysis*
| Restraints | (~) % Impact on CAGR Forecast | Geographic Relevance | Impact Timeline |
|---|---|---|---|
| Competition from coffee and RTD beverages | -0.6 | Global, especially North America and Europe | Short term (≤ 2 years) |
| High retail price of premium teas | -0.5 | Asia-Pacific emerging markets, South America, Africa | Medium term (2-4 years) |
| Fragmented micro-lot supply chains complexity | -0.4 | Kenya, Rwanda, India, China, Southeast Asia | Long term (≥ 4 years) |
| Limited consumer sensory knowledge | -0.3 | North America and low-literacy markets | Medium term (2-4 years) |
| Source: Mordor Intelligence | |||
Competition from coffee and RTD beverages
In 2022, the volume of RTD tea hit 40 billion liters, reflecting the growing consumer preference for convenient and ready-to-drink beverages. In November 2024, PepsiCo and Unilever, as reported by Unilever, expanded Lipton RTD's reach to 11 new territories, aiming to strengthen their global footprint in the RTD tea market and cater to increasing demand. Lipton Hard Iced Tea, witnessing a remarkable 130% surge, raked in sales of approximately USD 150 million, effectively capturing consumption occasions typically overlooked by loose-leaf teas, such as casual social gatherings, outdoor events, and on-the-go scenarios. Meanwhile, coffee chains are ramping up the competition by introducing matcha lattes and cold brews, leveraging years of investment in barista culture, premium product offerings, and advanced equipment to attract a broader consumer base and diversify their beverage portfolios.
High retail price of premium teas
While ceremonial-grade matcha typically commands prices exceeding USD 15 for every 100 grams, single-estate oolong can range between USD 50 and 100 per kilogram, reflecting its premium quality, labor-intensive production, and limited availability. In 2024, Kenya's average export price stood at a modest USD 2.27 per kilogram, primarily due to the dominance of bulk tea exports, which cater to mass-market demand. However, specialty orthodox teas, known for their unique flavor profiles, artisanal processing methods, and limited supply, can command prices up to five times that figure, highlighting their niche appeal and growing demand among discerning consumers. Japan's stone-mill limitations, processing only 30-40 grams each hour, contribute to a scarcity-driven pricing model by ensuring high quality and exclusivity. However, these constraints also restrict broader market appeal due to limited scalability and higher production costs, positioning such teas as luxury products within the global market.
*Our forecasts treat driver/restraint impacts as directional, not additive. The impact forecasts reflect baseline growth, mix effects, and variable interactions.
Segment Analysis
By Product Type, Green Tea Gains on Functional Wellness Momentum
In 2025, Black Tea is set to dominate the specialty tea market, holding a 39.62% share. In 2024, it bolstered its status as the volume leader by exporting 198,410 tons to Europe. Yet, its growth lags behind other segments, attributed to its limited functional differentiation. To stay competitive, brands like Twinings are spotlighting traceability and eco-friendly packaging, such as using recycled materials and ensuring transparency in sourcing practices. These efforts highlight the growing importance of sustainability and ethical considerations in consumer purchasing decisions, underscoring that mere scale isn't sufficient in today's market.
Green Tea is on a rapid ascent, boasting a projected CAGR of 8.91% through 2031, outpacing the overall specialty tea market. This surge is largely fueled by a burgeoning demand for matcha, with exports soaring 25% year-on-year, reaching JPY 36.4 billion in 2024. In light of this, ITO EN launched a dedicated Matcha Business Department in May 2025, with ambitions to triple its powdered output by FY2029. This move aims to alleviate grinding bottlenecks and tackle challenges posed by an aging grower demographic, which has been a growing concern for the industry. By addressing these operational and supply chain issues, Green Tea is carving out a significant niche in the premium and functional segments of the market, further solidifying its role in driving innovation and growth within the specialty tea category.


By Category Organic Certification Reshapes Supply Economics
In 2025, conventional teas commanded a dominant 87.71% share of the total market output. Their stronghold is bolstered by well-established supply chains and economies of scale, which effectively keep production costs in check. Industry giants, such as Bigelow, bolster consumer confidence by rigorously testing each lot for up to 450 pesticides, emphasizing their commitment to safety and consistency. Yet, an oversupply in Kenya's commodity channel is exerting downward pressure on export prices, curbing potential value growth. While conventional tea leads in global volume, its future expansion hinges on navigating tighter safety and sustainability standards without compromising efficiency.
Organic teas are emerging as the market's fastest-growing segment, with projections pointing to a robust 9.56% CAGR through 2031, buoyed by the USDA's NOPID traceability mandate. The surging demand for products with verified origins and minimal residues is driving prices higher. Notably, Kyoto's organic tencha auctions witnessed a staggering 170% spike, a testament to supply constraints. However, producers grapple with challenges in scaling production, primarily due to steep compliance costs and diminished yields. For organic teas to truly flourish, a delicate balance between traceability and cost-effectiveness is paramount. With transparency becoming a pivotal advantage, organic teas are poised to allure an even larger segment of premium buyers on the global stage.
By Packaging Pouches Gain on Sustainability and Fill Efficiency
In 2025, boxes accounted for a dominant 70.27% of the specialty tea packaging market's total revenue. Their widespread use stems from standardized formats, cost efficiency, and versatility across retail channels. Producers like Twinings have enhanced box packaging, incorporating sustainability features such as 80% recycled content for premium SKUs. While innovations like nitrogen flushing and resealable zippers have become standard, they no longer serve as unique selling points. With tightening EU mandates, boxes are increasingly being shaped by eco-compliance considerations, overshadowing their design flexibility.
Pouches are emerging as the packaging format with the most rapid growth, projected to surge at an 8.43% CAGR through 2031. This growth is attributed to the adoption of cellulose-based, backyard-compostable laminates, which not only lighten the material by over 60% but also champion sustainability. Arbor Teas’ NatureFlex pouch, boasting a 27% increase in fill capacity and a Gold Award from the Flexible Packaging Association, underscores the industry's pivot towards performance-centric eco-solutions. Adoption is further spurred by mono-material designs that align with the EU's Single-Use Plastics Directive. Looking ahead, pouches are set to spearhead innovations in eco-conscious tea packaging.
By Distribution Channel On-Trade Premiumization Versus Off-Trade Scale
In 2025, Off-Trade channels dominated specialty tea distribution, accounting for 72.58% of total revenue. Supermarkets, bolstered by robust household consumption and extensive shelf presence, serve as the cornerstone. Yet, the swift ascent of direct-to-consumer and quick commerce platforms is altering buying behaviors. These online avenues capitalize on impulse purchases, particularly for wellness-oriented teas. Instead of diminishing traditional sales, Off-Trade and On-Trade channels are carving out niches, differentiating between routine stock-ups and experiential consumption, thereby broadening overall demand across various formats.
On-Trade channels are poised for the most rapid expansion, with projections indicating a 9.79% CAGR through 2031. This anticipated growth is in tandem with innovations spearheaded by cafés and a burgeoning urban tea culture. A testament to this shift is Tata Starbucks’ expansive 500-store presence in India, where offerings like cold-brewed oolong and nitro green tea seamlessly blend global trends with indigenous preferences. The allure of beverage customization and premium presentation is enticing a younger, health-savvy demographic. With the proliferation of cafés and boutique tea houses, the On-Trade segment is emerging as the foremost catalyst for value growth in the specialty tea arena.
Geography Analysis
In 2025, Asia-Pacific accounted for 37.51% of global tea revenue, driven largely by China's export of 419,000 tonnes, with a notable 88.1% being Green Tea. The region's dominance is further supported by its strong production capabilities and growing consumer demand for premium tea varieties. In 2024, Japan's matcha exports surged by 25% to reach JPY 36.4 billion, and in April 2025, shipments to the U.S. skyrocketed by 176.5%, totaling JPY 2.05 billion. This growth highlights Japan's increasing focus on expanding its footprint in international markets, particularly in the United States. Meanwhile, India showcased its dual prowess as both an exporter and innovator, unveiling 15 new Tetley SKUs in Q3 FY2026. The introduction of these SKUs reflects India's strategy to cater to evolving consumer preferences and strengthen its position in the global tea market.
Leading the charge, the Middle East and Africa region is projected to grow at a robust 9.81% CAGR through 2031. This growth is largely attributed to Dubai’s DMCC Tea Centre, which processed 24,400 metric tons in 2024 and commands over half of the global tea re-exports. The region's strategic location and infrastructure have made it a critical hub for the tea trade and re-exports. In 2024, Kenya, solidifying its emerging role in the premium tea segment, garnered KES 215.21 billion from tea and exported 28.90 million kg of value-added specialty teas. Kenya's focus on value addition and specialty products is helping it tap into higher-margin markets and diversify its export portfolio.
North America and Europe play pivotal roles in realizing premium tea prices. In FY2025, ITO EN's beverage volume in North America surged by 53%, with its Oi Ocha brand now reaching 47 countries. The brand's expansion underscores the growing demand for authentic and high-quality tea products in the region. Europe, witnessing a steady annual growth of approximately 12%, has organic tea constituting 15% of its market volume. This trend reflects increasing consumer awareness and preference for sustainable and health-focused products. While South America remains largely dominated by yerba mate, urban centers in Brazil are showing a budding interest in wellness teas, signaling potential growth in the future. The rising health consciousness among urban consumers is expected to drive demand for innovative tea products in the region.

Competitive Landscape
The Specialty Tea market holds a moderate consolidation with a blend of global giants and local champions. Multinationals like Unilever, Tata Consumer Products, and Nestlé share the spotlight with family-run firms such as Bigelow and regional leaders like ITO EN and Dilmah. ITO EN is proactively managing supply risks, boasting a dedicated Matcha Business Department and a sprawling 2,585-hectare GAP-certified farm network. This strategic approach not only ensures a steady supply chain but also strengthens its position in the premium tea segment.
Twinings, not to be outdone, employs blockchain QR codes and rolls out a EUR 5 million regenerative-agriculture initiative, collaborating with 15,000 growers. These efforts aim to enhance transparency and sustainability, aligning with evolving consumer preferences for ethical sourcing. The arena of functional botanicals heats up. Bigelow introduces adaptogens with its Golden Turmeric Honey, while The Republic of Tea unveils its SuperShroom line, both seamlessly blending these elements into traditional tea formats. Such innovations cater to the growing demand for health-focused beverages, driving differentiation in a competitive market.
On the tech front, there's a clear divide: premium brands are investing in NFC chips and traceability, whereas their volume-driven counterparts prioritize nitrogen flushing to extend shelf life. These technological advancements reflect the industry's dual focus on quality assurance and operational efficiency. Adhering to ISO/TR 21380:2022 standards and achieving USDA NOPID traceability have transitioned from being mere badges of honor to essential market entry prerequisites, creating a higher entry barrier for newcomers lacking robust quality systems. This shift underscores the increasing importance of compliance and traceability in maintaining consumer trust and meeting regulatory demands.
Specialty Tea Industry Leaders
-
Unilever PLC
-
Associated British Foods PLC
-
Nestlé S.A.
-
Tata Consumer Products Ltd
-
ITO EN Ltd
- *Disclaimer: Major Players sorted in no particular order

Recent Industry Developments
- February 2025: Molly Tea marked a significant milestone in its global growth strategy by opening its first European outlet in London's Chinatown, highlighting its commitment to accelerating overseas expansion.
- December 2024: TreeHouse Foods has finalized an agreement to acquire Harris Freeman’s private-brand tea business for USD 205 million. This strategic acquisition will expand TreeHouse Foods' operational footprint by adding two manufacturing plants in the United States and integrating approximately 300 employees into its workforce.
- October 2024: Taiwan has launched the high-yielding "Tai Cha 26" cultivar to improve production efficiency and strengthen the stability of supply. This initiative aims to address challenges in meeting growing demand while ensuring consistent quality and output.
- January 2024: Tata Consumer Products has completed the acquisition of Organic India, strengthening its position in the health-focused organic products market. This move enables the company to expand its reach across 48 countries, aligning with the growing global demand for organic and wellness-oriented offerings.


Global Specialty Tea Market Report Scope
Specialty tea is a premium tea recognized for its precise cultivation, expert processing, and unique attributes that highlight its origin, craftsmanship, and flavor profile. Produced in limited quantities, it holds greater value than commodity tea due to its distinctiveness, consistency, and complex sensory experience. The scope of the market refers to the product type, including black tea, green tea, oolong tea, and others. Based on the category, the market is segmented into organic and conventional. By packaging type, the market is segmented into boxes, pouches, bags, and others. Based on the distribution channel, the market is segmented into on-trade and off-trade channels. Also, the report provides a detailed analysis of major economies across North America, Europe, Asia-Pacific, South America, the Middle East, and Africa.
| Black Tea |
| Green Tea |
| Oolong Tea |
| Others |
| Organic |
| Conventional |
| Box |
| Pouches |
| Bags |
| Others |
| On-Trade | |
| Off-Trade | Supermarket/Hypermarket |
| Convineience/Grocery Stores | |
| Online Retail Stores | |
| Others |
| North America | United States |
| Canada | |
| Mexico | |
| Rest of North America | |
| Europe | Germany |
| United Kingdom | |
| Italy | |
| France | |
| Spain | |
| Netherlands | |
| Rest of Europe | |
| Asia-Pacific | China |
| India | |
| Japan | |
| Australia | |
| Rest of Asia-Pacific | |
| South America | Brazil |
| Argentina | |
| Rest of South America | |
| Middle East and Africa | South Africa |
| Saudi Arabia | |
| United Arab Emirates | |
| Rest of Middle East and Africa |
| By Product Type | Black Tea | |
| Green Tea | ||
| Oolong Tea | ||
| Others | ||
| By Category | Organic | |
| Conventional | ||
| By Packaging | Box | |
| Pouches | ||
| Bags | ||
| Others | ||
| By Distribution Channel | On-Trade | |
| Off-Trade | Supermarket/Hypermarket | |
| Convineience/Grocery Stores | ||
| Online Retail Stores | ||
| Others | ||
| By Geography | North America | United States |
| Canada | ||
| Mexico | ||
| Rest of North America | ||
| Europe | Germany | |
| United Kingdom | ||
| Italy | ||
| France | ||
| Spain | ||
| Netherlands | ||
| Rest of Europe | ||
| Asia-Pacific | China | |
| India | ||
| Japan | ||
| Australia | ||
| Rest of Asia-Pacific | ||
| South America | Brazil | |
| Argentina | ||
| Rest of South America | ||
| Middle East and Africa | South Africa | |
| Saudi Arabia | ||
| United Arab Emirates | ||
| Rest of Middle East and Africa | ||


Key Questions Answered in the Report
What is the current value of the Specialty Tea market?
The Specialty Tea market size stood at USD 36.07 billion in 2025 and is projected to reach USD 52.66 billion by 2031.
Which product type is growing the fastest?
Green Tea leads growth with an anticipated 8.91% CAGR through 2031, driven by matcha’s wellness positioning.
Why are pouches gaining popularity for specialty teas?
Compostable mono-material pouches cut packaging weight by more than 60% and extend shelf life, aligning with tightening sustainability rules in the U.S. and EU.
Which region is expected to record the highest growth?
The Middle East and Africa region is set for a 9.81% CAGR thanks to Dubai’s role as a global blending and re-export hub.
Page last updated on:


