Bubble Tea Market Size and Share
Market Overview
| Study Period | 2021 - 2031 |
|---|---|
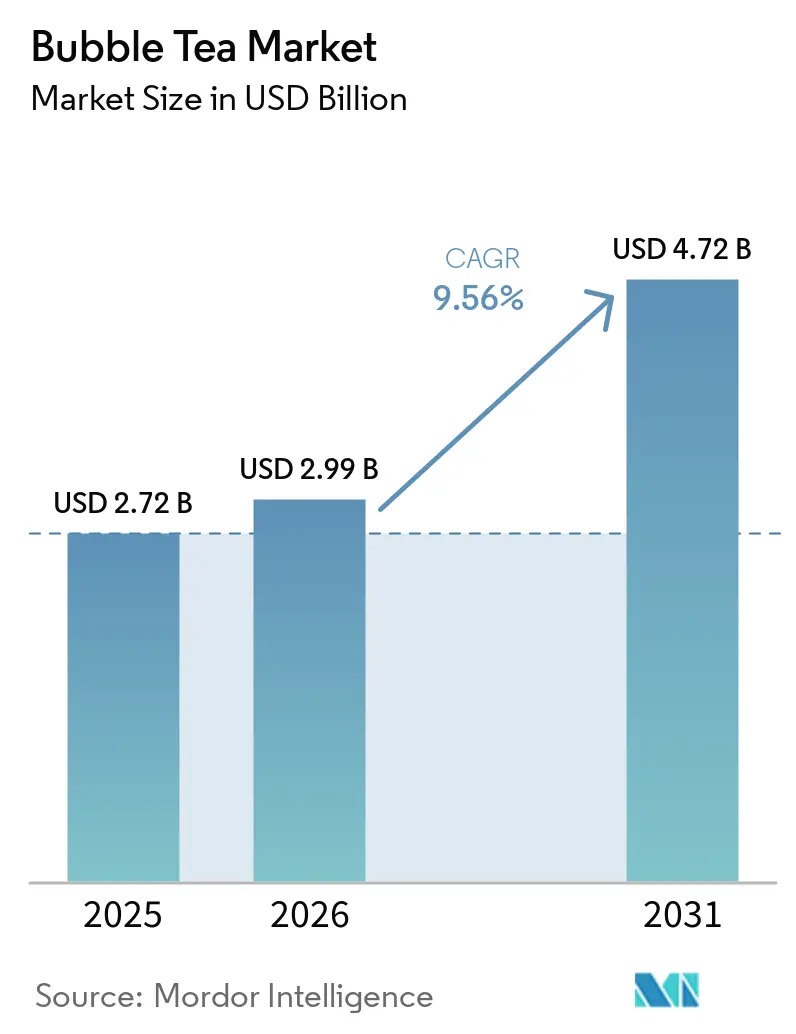
| Market Size (2026) | USD 2.99 Billion |
| Market Size (2031) | USD 4.72 Billion |
| Growth Rate (2026 - 2031) | 9.56% CAGR |
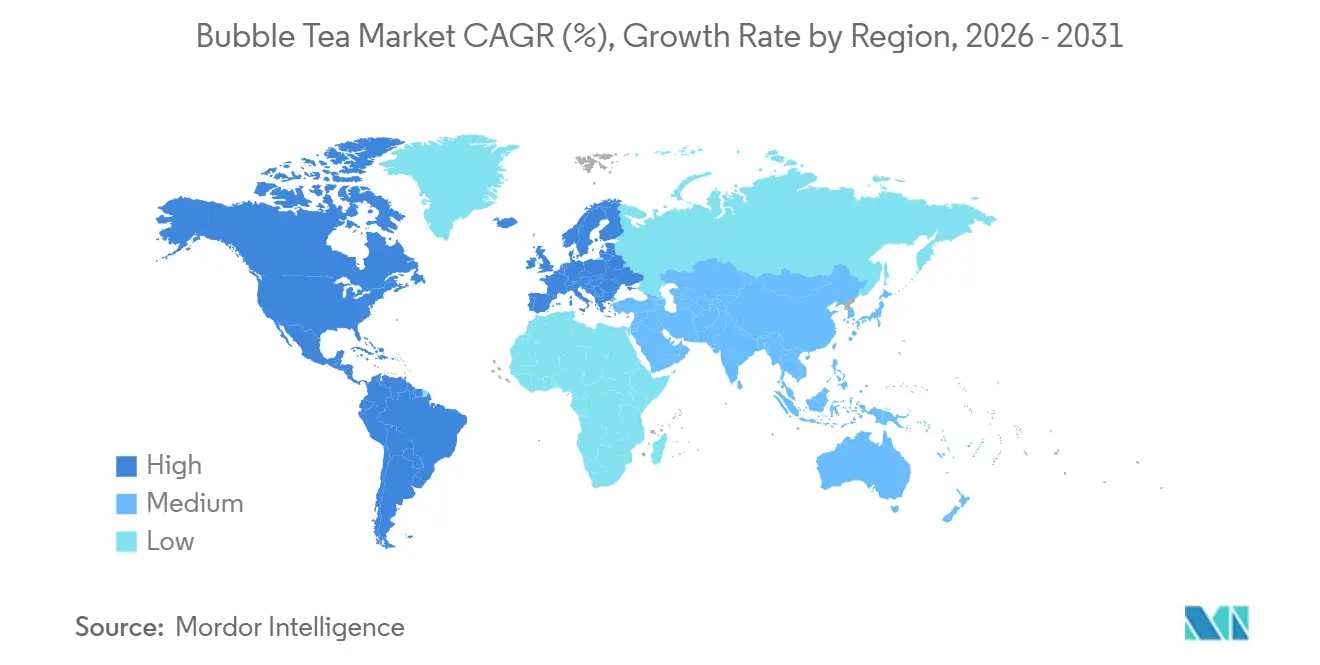
| Fastest Growing Market | North America |
| Largest Market | Asia Pacific |
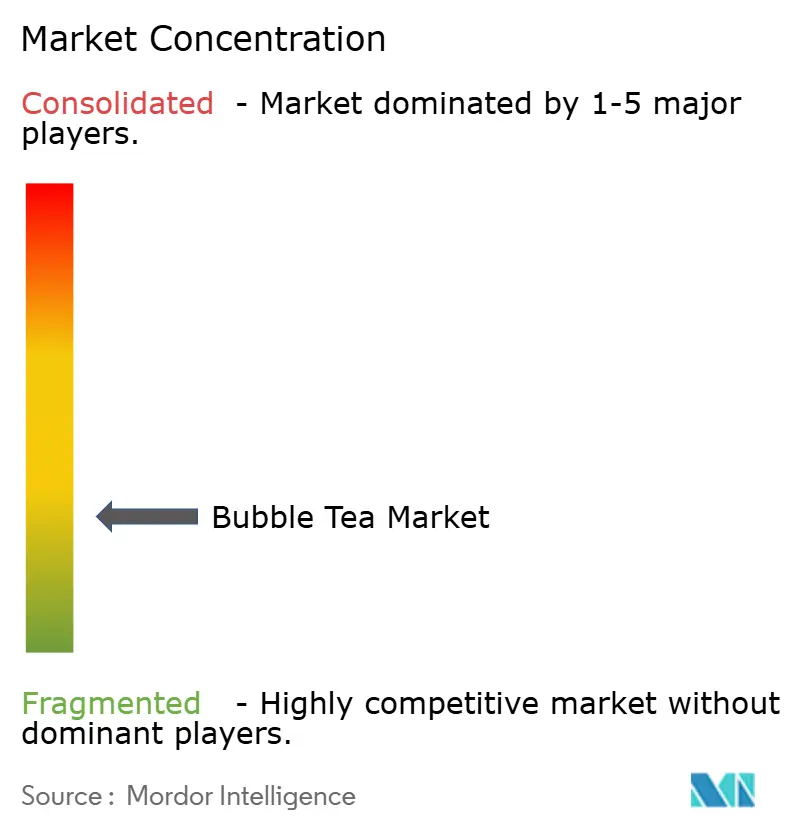
| Market Concentration | Low |
Major Players
*Disclaimer: Major Players sorted in no particular order Image © Mordor Intelligence. Reuse requires attribution under CC BY 4.0. |
|
Bubble Tea Market Analysis by Mordor Intelligence
The Bubble Tea Market size was valued at USD 2.72 billion in 2025 and is estimated to grow from USD 2.99 billion in 2026 to reach USD 4.72 billion by 2031, at a CAGR of 9.56% during the forecast period (2026-2031). Younger consumers are replacing carbonated soft drinks with tea-based beverages that promise antioxidants and limitless personalization, a shift amplified by sugar levies that make bubble tea price-competitive. Asian chains are scaling quickly through master-franchise agreements, transferring capital risk to local partners while preserving centralized supply chains. Plant-based and halal-certified variants are unlocking new demand pockets, especially in the Middle East, where certification premiums widen margins. Automated brewing systems that cut per-cup labor time by 60% support kiosk formats and maintain product consistency, widening the cost gap with independent cafés.
Key Report Takeaways
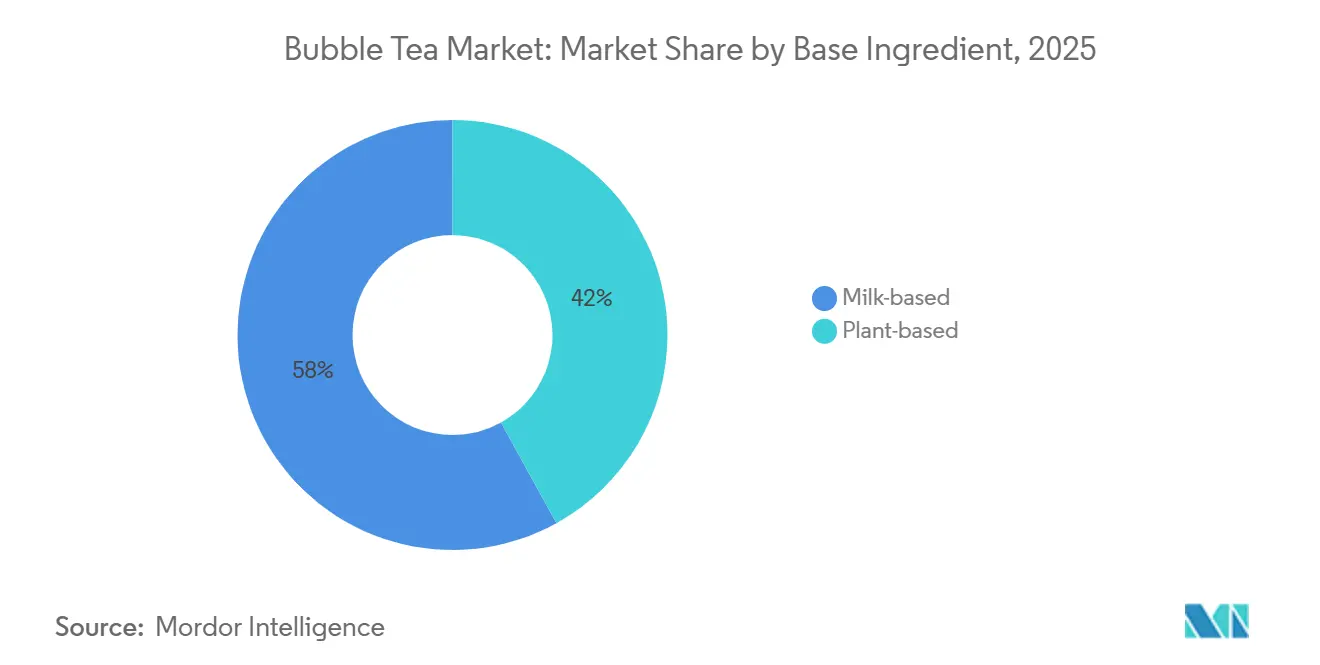
- By base ingredient type, milk-based drinks led with 58.04% revenue share in 2025, while plant-based alternatives are projected to expand at a 10.25% CAGR through 2031.
- By tea type, black tea captured 43.18% of 2025 volume; oolong tea is the fastest-growing segment, advancing at a 10.84% CAGR to 2031.
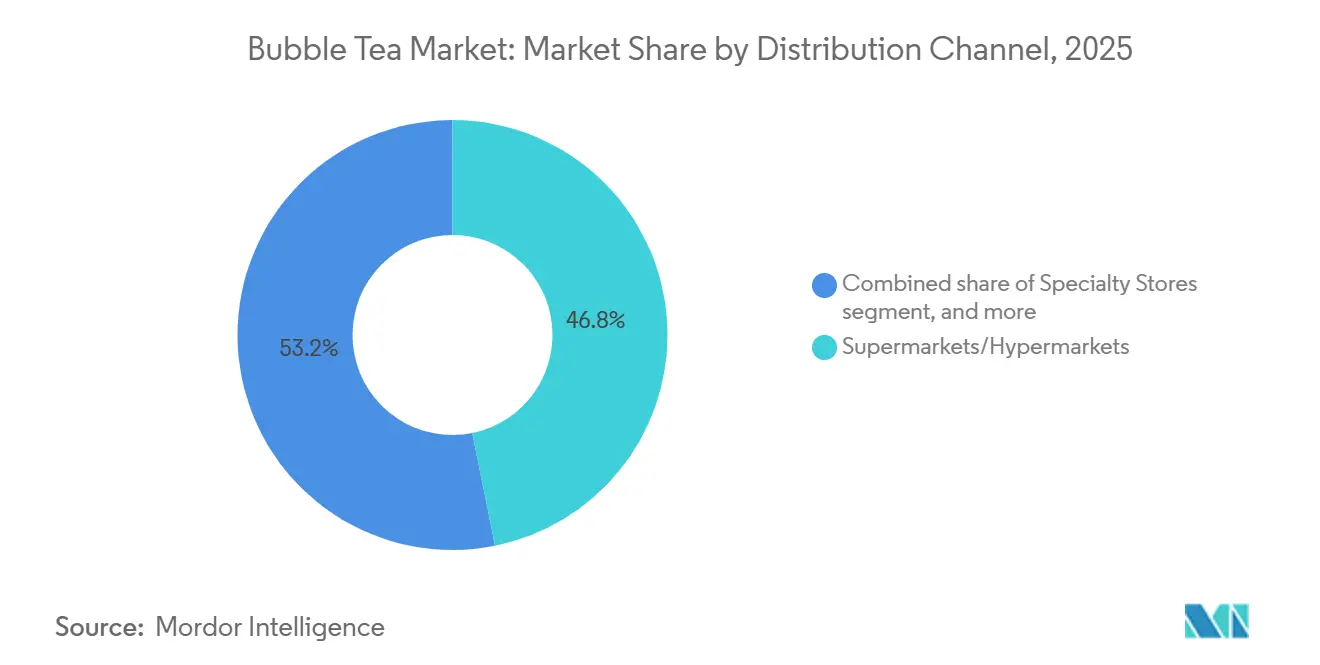
- By distribution channel, supermarkets and hypermarkets held 46.84% revenue share in 2025, yet online retail is forecast to grow at a 10.45% CAGR through 2031.
- By packaging form, PET and glass bottles commanded 51.11% revenue in 2025, whereas pouches and sealed-cap cups are set to register a 10.36% CAGR over 2026-2031.
- By geography, Asia-Pacific accounted for 45.18% of 2025 revenue, while North America is expected to record the fastest growth at 10.22% CAGR to 2031.
Note: Market size and forecast figures in this report are generated using Mordor Intelligence’s proprietary estimation framework, updated with the latest available data and insights as of January 2026.
Global Bubble Tea Market Trends and Insights
Drivers Impact Analysis*
| Driver | (~) % Impact on CAGR Forecast | Geographic Relevance | Impact Timeline |
|---|---|---|---|
| Growing preference for tea-based beverages over carbonated soft drinks | +1.8% | Global | Medium term (2-4 years) |
| High customizability in flavors, toppings, and sweetness levels | +1.5% | Global | Short term (≤ 2 years) |
| Strong social media visibility and "Instagrammable" aesthetics of bubble tea beverages | +1.2% | North America | Short term (≤ 2 years) |
| Rapid expansion of specialty bubble tea chains | +2.1% | Global, with early gains in Middle East, Southeast Asia, North America | Medium term (2-4 years) |
| Continuous innovation in flavors, textures, and limited-time offerings | +1.3% | Global | Short term (≤ 2 years) |
| Rising demand for vegan and Halal Bubble Tea | +0.9% | Middle East, Europe, North America | Medium term (2-4 years) |
| Source: Mordor Intelligence | |||
Growing preference for tea-based beverages over carbonated soft drinks
Health-conscious consumers are transitioning from carbonated soft drinks to tea-based alternatives, recognizing bubble tea as a functional beverage that provides antioxidants and has lower acidity compared to colas. In 2024, tea consumption in India totaled 1,154 million kg, according to the Tea Board of India[1]Source: Tea Board of India, "Tea available for domestic consumption", teaboard.gov.in. This shift is accelerating in regions where sugar taxes on carbonated beverages have widened the price gap. For example, the UK's sugar levy, which increased in 2024, has made bubble tea a cost-effective option compared to premium carbonated drinks, particularly among university students. Coca-Cola's launch of Cappy Bubble, a boba juice hybrid, in November 2025 highlights the growing acknowledgment among carbonated drink manufacturers that tea-based beverages represent a structural challenge rather than a temporary trend. The absence of phosphoric acid in tea formulations further enhances its appeal to consumers concerned about bone density and dental health. Regulatory developments are also driving this shift; the FDA's 2024 review of low-calorie sweeteners is pushing carbonated drink producers to reformulate with stevia and monk fruit, indirectly validating the ingredient profiles already adopted by bubble tea brands.
High customizability in flavors, toppings, and sweetness levels
Customization, once a unique selling point, has now become a standard expectation, with 72% of consumers preferring adjustable ice and sugar levels. Loyalty programs leverage this trend to drive more frequent purchases. This shift is particularly evident in North America, where bubble tea chains have implemented digital ordering kiosks offering over 50 combinations of base tea, milk type, sweetness, and toppings. This strategy not only simplifies the ordering process but also transforms it into a collaborative experience, fostering stronger emotional connections. Gong Cha's 'Gong Cha 2.0' stores exemplify this trend by incorporating technology-driven operations. These stores enable customers to save personalized recipes via mobile apps, streamlining reordering and supporting predictive inventory management to minimize ingredient waste. The economic benefits are clear: toppings such as tapioca pearls, popping boba, and cheese foam yield higher margins than the base beverage, encouraging operators to expand their topping menus. Additionally, limited-time offerings (LTOs) enhance this approach by creating urgency. For example, HeyTea's December 2025 collaboration with POP MART, which combined exclusive figurine giveaways with seasonal flavors, led to a 28% increase in same-store sales during the promotional period. The demand for customization is also reshaping supply chains, with chains sourcing local ingredients like dulce de leche in Argentina and date syrup in the UAE to adapt flavor profiles while preserving brand identity.
Strong social media visibility and "Instagrammable" aesthetics of bubble tea beverages
Bubble tea brands are designing visually striking elements such as gradient color layers, translucent cups, and oversized straws to boost purchases and enhance their social media visibility. Brands that focus on store aesthetics, like Gong Cha, are seeing significant benefits. Their flagship stores in high-traffic areas like Times Square feature neon signage and minimalist interiors designed for social media sharing, effectively turning customers into brand advocates. The impact is clear: chains with Instagram-friendly designs experience an increase in foot traffic and a 25% rise in average transaction values compared to more basic formats. Influencer partnerships, particularly in South Korea, are amplifying these outcomes. Chains like Gong Cha leverage endorsements from K-pop idols, appealing to Gen Z consumers. This group demonstrates a stronger connection to products showcased in influencer content compared to traditional paid advertisements. However, this focus on aesthetics is raising entry barriers. New players must now allocate 15-20% of their capital expenditure to interior design and packaging, favoring well-funded chains and making profitability more challenging for independent operators.
Rapid expansion of specialty bubble tea chains
Leading chains are reshaping competitive dynamics by targeting outlet milestones in previously underserved geographies. Gong Cha's plans to expand to over 225 stores in the UK by March 2025 and 100 stores in Thailand by November 2025 highlight the effectiveness of master franchise agreements. These agreements not only transfer capital risks to local partners but also ensure brand control through centralized supply chains. Tealive's collaboration with Restaurants Development Co Ltd, aiming to launch 80 outlets in Thailand over the next decade, showcases the advantage of franchisees with established foodservice networks. Announced in March 2025, this partnership underscores how leveraging existing real estate ties and regulatory know-how can expedite market entry. The Middle East is emerging as a lucrative frontier; Gong Cha's January 2024 master franchise deal with Shahia Foods Group, targeting 300 outlets in the region over the next decade, underscores the allure of markets boasting year-round warmth, affluent consumers, and minimal competition. Private equity is also driving this expansion; TA Associates' scrutiny of a USD 2 billion Gong Cha sale in March 2026 indicates that financial backers see bubble tea chains as prime platforms for geographic arbitrage, where successful Asian operational strategies can be adapted for Western markets, yielding superior economics.
Restraints Impact Analysis*
| Restraint | (~) % Impact on CAGR Forecast | Geographic Relevance | Impact Timeline |
|---|---|---|---|
| Sugar scrutiny and obesity concerns | -1.1% | North America, Europe | Medium term (2-4 years) |
| Quality inconsistency and lack of standards | -0.6% | Global | Long term (≥ 4 years) |
| Single-use plastic bans | -0.8% | North America and Europe | Short term (≤ 2 years) |
| Premium ingredient inflation | -0.7% | Global | Short term (≤ 2 years) |
| Source: Mordor Intelligence | |||
Sugar scrutiny and obesity concerns
Public health campaigns and regulatory interventions aimed at reducing sugar consumption are squeezing margins and driving reformulation investments that smaller chains find difficult to manage. The UK's sugar tax increase, which raised levies on beverages containing more than 8 grams of sugar per 100 milliliters, has led bubble tea operators to lower default sweetness levels by 20-30% and introduce zero-calorie sweetener options like stevia and monk fruit. The FDA's systematic review of low-calorie sweeteners, initiated in 2024, has created regulatory uncertainty, delaying product launches. Chains now need to conduct additional safety testing to comply with evolving guidelines, extending development timelines by 6-12 months. Consumer preferences are also shifting; North American consumers increasingly perceive bubble tea as "too sweet," driving demand for fruit-based teas without added sugar and herbal infusions that prioritize functional benefits over indulgence. The UAE's Nutri-Mark front-of-pack labeling system, set to launch in June 2025, will require bubble tea operators to display color-coded nutritional information, effectively discouraging high-sugar variants with red labels that deter health-conscious consumers. Reformulation costs are significant; replacing cane sugar with alternative sweeteners raises ingredient costs, disproportionately impacting franchisees operating on thin margins in competitive markets. The sugar debate is also dividing the market; premium chains are marketing high-sugar variants as indulgent treats, while value chains are focusing on ultra-low-sugar options, creating a fragmented market where mid-tier players face challenges in differentiation.
Quality inconsistency and lack of standards
The absence of globally harmonized quality standards for bubble tea ingredients and preparation methods undermines consumer trust and increases liability risks for chains operating across multiple jurisdictions. In 2021, China introduced the T/CSTEA 00025-2021 standard for freshly made bubble tea, which provides guidelines for ingredient sourcing, brewing temperatures, and shelf life. However, its adoption remains voluntary, and enforcement is inconsistent. Certifications such as ISO 22000 and FSSC 22000, which address food safety management systems, are gaining popularity among suppliers of tapioca pearls and tea concentrates. Yet, fewer than 30% of bubble tea chains require these certifications from their vendors, leaving supply chains vulnerable. Quality inconsistencies are most evident in franchised outlets, where compliance with brand standards depends on franchisee training and oversight. Mystery shopper audits conducted in 2025 revealed that 22% of franchised locations deviated from corporate recipes by using expired ingredients or incorrect brewing times, leading to customer complaints and negative online reviews. The lack of standardized regulations also complicates international expansion. For example, bubble tea chains entering the EU must comply with Regulation 1169/2011, which mandates food labeling, allergen declarations, and nutritional information, while also adhering to varying national regulations across member states. ISO 20716:2022, which defines quality requirements for oolong tea, offers a framework for ingredient-level standardization, but its application to finished bubble tea products remains limited. The economic impact of these inconsistencies is significant. Chains with robust quality control systems report 18% lower customer churn and 25% higher Net Promoter Scores compared to operators with ad hoc quality assurance, emphasizing the competitive advantage of investing in standardization.
*Our forecasts treat driver/restraint impacts as directional, not additive. The impact forecasts reflect baseline growth, mix effects, and variable interactions.
Segment Analysis
By Base Ingredient Type: Plant-Based Gains on Health Wave
In 2025, milk-based formulations held a significant 58.04% market share, driven by consumers' preference for creamy textures and dairy milk's role in balancing tea's astringency. Whole and condensed milk continue to dominate in Asia-Pacific markets, where traditional recipes prioritize richness. However, lactose intolerance among adults in China and Southeast Asia has created a growing demand for alternatives. Cheese foam, a premium topping made of salted cream cheese layered over milk tea, has gained popularity, commanding an additional USD 0.50-1.00 per cup and appealing to consumers who enjoy savory-sweet combinations. Additionally, milk-based segments are benefiting from functional innovations. In markets like South Korea and Japan, where functional foods occupy significant shelf space, chains are fortifying milk teas with collagen peptides and vitamins, marketing them as beauty beverages that justify higher price points.
Plant-based alternatives are experiencing strong growth, expanding at a 10.25% CAGR through 2031. This growth is primarily fueled by the increasing adoption of oat and almond milk in North America and Europe, particularly among flexitarian and vegan consumers. In urban centers such as London and Berlin, oat milk accounts for 60% of plant-based milk tea orders, outperforming soy and almond milk due to its neutral flavor and superior frothing properties, which closely replicate the texture of dairy milk. In the Middle East, halal certification is driving the plant-based trend. For example, CoCo's halal menu, which replaces dairy with plant-based creamers, has expanded the chain's market reach in the UAE and Saudi Arabia. Regulatory developments are further supporting this trend; the EU's Regulation 1169/2011 on allergen labeling is encouraging chains to offer plant-based options to mitigate cross-contamination risks. In response to rising demand, supply chain investments are increasing, with plant-based creamer suppliers scaling up to meet the needs of bubble tea chains seeking vegan-certified dairy-free options.


By Tea Type: Oolong Premiumization Reshapes Mix
In 2025, black tea accounted for a 43.18% market share, driven by its bold flavor and high caffeine content, which attract consumers seeking an energy boost similar to coffee. North America remains a key market for black tea, with chains like Kung Fu Tea and Gong Cha positioning it as the preferred base for milk teas and fruit infusions. The segment is also benefiting from ready-to-drink (RTD) innovations. For example, Del Monte's Joyba brand, which launched nationally in 2024, introduced 8 black tea-based bubble tea varieties in PET bottles. These products are now available at major retailers such as Target, Costco, and Walmart, significantly expanding bubble tea's reach from specialty stores to mainstream grocery channels. Meanwhile, green tea is gaining popularity, particularly among health-conscious consumers who appreciate its antioxidant properties and lower caffeine levels compared to black tea. Additionally, herbal and floral teas, including chamomile, hibiscus, and jasmine variants, are becoming increasingly favored as caffeine-free options. These teas cater to evening consumption and provide functional benefits like relaxation and digestive support.
Oolong tea is experiencing robust growth, with a 10.84% CAGR projected through 2031. This growth is driven by premiumization strategies that emphasize terroir-focused sourcing and compliance with ISO 20716:2022 quality standards. Oolong's semi-oxidized processing delivers a range of complex flavor profiles, floral, fruity, and toasty, that justify a 20-30% price premium over black tea, appealing to connoisseurs who value authenticity. For instance, Molly Tea's Singapore debut in March 2026 featured jasmine-based drinks priced between SGD 5.20-6.50, highlighting how chains are leveraging premium tea bases to differentiate in competitive markets. Limited-time offerings (LTOs) are also enhancing oolong's appeal by creating a sense of exclusivity. HeyTea's quarterly rotating seasonal oolong blends, for example, encourage repeat visits from consumers eager to try exclusive variants. The segment's growth is further supported by supply chain transparency. Taiwanese oolong producers are adopting blockchain-based traceability systems, enabling consumers to verify harvest dates and processing methods via QR codes, a feature that resonates with Gen Z consumers who prioritize authenticity.
By Distribution Channel: Online Gains on Subscription Models
In 2025, supermarkets and hypermarkets accounted for 46.84% of the distribution market, driven by the growing availability of ready-to-drink (RTD) bubble tea products in refrigerated and ambient aisles. Del Monte's Joyba brand, which doubled its production capacity in 2024 and expanded into Mexico, highlights how established food manufacturers are utilizing existing retail partnerships to secure shelf space for bubble tea products. RTD formats attract busy consumers who want the bubble tea experience without waiting in line at specialty stores. Instant tapioca pearls, which can be prepared in just 30 seconds, enable at-home consumption and directly compete with out-of-home channels. Specialty stores, including branded bubble tea chains and independent cafes, thrive on offering experiential consumption and customization options that RTD products cannot match. Other distribution channels, such as convenience stores, vending machines, and institutional sales to schools and hospitals, are also growing. Vending machines, in particular, are gaining popularity in Japan and South Korea, where automated kiosks help reduce labor costs and extend operating hours.
Online retail channels are growing at a 10.45% CAGR through 2031, driven by direct-to-consumer subscription models and third-party delivery integrations that lower customer acquisition costs. Chains are increasingly using mobile apps with loyalty programs to boost purchase frequency. For example, Gong Cha's app, which allows users to save personalized recipes and earn points for free drinks, has been downloaded globally. Third-party delivery platforms like DoorDash, Uber Eats, and Deliveroo are facilitating bubble tea orders in urban areas. While delivery fees range from USD 2 to 4 per order, many chains absorb these costs, treating delivery as a customer acquisition strategy rather than a profit driver. Moreover, increasing internet access is bolstering online retail channels. For instance, the International Telecommunication Union (ITU) reported that global internet access reached 74% in 2025, up from 71% in 2024[2]Source: International Telecommunication Union, "Individuals Using the Internet", itu.int. Online retail is also enabling brands to expand geographically without establishing a physical presence. Brands are shipping DIY bubble tea kits, containing tea bags, tapioca pearls, and flavorings, directly to consumers in underserved markets, building brand awareness ahead of potential brick-and-mortar expansions.

By Packaging Form: Pouches Gain on Sustainability Push
In 2025, PET and glass bottles accounted for 51.11% of the packaging market share. This was primarily due to their transparency, which allows consumers to see tapioca pearls and color gradients before purchasing, reinforcing quality perceptions. PET bottles, preferred for their shatter resistance and lightweight design, dominate ready-to-drink (RTD) formats, reducing shipping costs. For example, Del Monte's Joyba brand uses 500-milliliter PET bottles with an 18-month shelf life, enabling ambient distribution and expanding retail availability beyond refrigerated sections. Glass bottles, which command a 15-20% price premium, appeal to environmentally conscious consumers who associate glass with sustainability, although lifecycle assessments indicate that glass production and transport result in higher carbon emissions than PET. Aluminum cans, valued for their recyclability and compatibility with automated filling lines, help lower production costs. These cans are particularly popular in convenience stores, where their single-serve formats and ambient shelf stability cater to grab-and-go consumption habits.
Pouches and sealed-cap cups are growing at a 10.36% CAGR through 2031, driven by sustainability mandates and advancements in aseptic packaging that extend shelf life without refrigeration. The EU's Regulation 2025/40 on packaging and packaging waste, which requires 65% recyclability by 2030, is accelerating the adoption of flexible pouches that use 40% less material than rigid bottles. Aseptic pouches, made from layers of plastic, aluminum, and paperboard, provide a 12-month shelf life at ambient temperatures, enabling distribution to remote markets with limited cold-chain infrastructure. Almarai's five-year partnership with SIG, announced in November 2024 as part of a SAR 18 billion investment plan, highlights the regional dairy giants' focus on aseptic packaging as a platform for entering adjacent beverage categories like bubble tea. Sealed-cap cups, featuring twist-off lids that preserve carbonation and prevent spills, are gaining popularity in on-the-go formats. For instance, Coca-Cola's Cappy Bubble, launched in November 2025, uses sealed-cap cups to differentiate its boba juice hybrid from traditional bubble tea served in open-top cups. However, single-use plastic bans are creating challenges for pouches. Regulations such as Canada's SOR/2022-138 and Honolulu's Bill 18 prohibit certain plastic films, prompting manufacturers to switch to biodegradable alternatives, which increase material costs by USD 0.10-0.15 per unit.
Geography Analysis
In 2025, the Asia-Pacific region emerged as a dominant player, contributing a substantial 45.18% of global revenue. China's tea-drink market is undergoing a significant transformation, shifting its focus from aggressive expansion of store counts to emphasizing profitability. In Southeast Asia, growth is being fueled by master franchises strategically entering untapped markets, creating opportunities for white-space expansion. Japan and South Korea are maintaining high consumer interest in metropolitan areas through innovative approaches. Japan leverages collaborations with pop culture, while South Korea effectively utilizes influencer marketing to engage its audience. Furthermore, the region benefits from high tea production in China and India, which ensures a steady supply of raw materials and supports market growth. For instance, in 2024, China produced an impressive 3,740,000 metric tons of tea, while India contributed 1,284,780 metric tons, according to data from the International Tea Committee[3]Source: International Tea Committee, "Tee Report 2025", inttea.com.
North America is projected to achieve a robust compound annual growth rate (CAGR) of 10.22%, driven by its multicultural metropolitan areas where demand from diverse diaspora communities is increasingly influencing mainstream consumption patterns. The expansion of tea-drink chains is evident, with Gong Cha planning to establish 500 U.S. outlets by 2028 and HeyTea making a notable entry with flagship stores in Times Square. However, the region faces challenges due to regulatory changes, such as the phase-out of synthetic dyes and bans on PFAS packaging. These regulations are driving up reformulation and packaging costs. At the same time, they are creating opportunities for brands that focus on clean-label products, allowing them to carve out a niche in the market.
Europe, led by the UK, Germany, and France, is rapidly catching up in the tea-drink market. The UK alone hosts over 225 Gong Cha stores, reflecting the growing mainstream acceptance of tea drinks beyond ethnic enclaves. In Germany, consumer preferences are shifting towards low-sugar and plant-based options, aligning with the region's increasing focus on health and wellness. Meanwhile, the Middle East, with the UAE and Saudi Arabia at the forefront, is leveraging its halal certifications and high disposable income levels to embrace premium tea-drink formats. This trend is expected to result in the establishment of 300 Gong Cha outlets in the region over the next decade, highlighting the market's potential for high-value growth.

Competitive Landscape
The bubble tea market remains fragmented, creating significant opportunities for consolidation among financially robust companies aiming to achieve scale advantages. This fragmentation arises from the market's relatively young age and its low barriers to entry, which have enabled regional and specialty players to compete effectively with established brands. The competitive landscape prioritizes innovation and niche positioning over economies of scale, as consumer preferences differ widely across various geographic regions. To achieve rapid market penetration without incurring substantial capital expenditures, companies are focusing on strategies such as franchise expansion, vertical integration of supply chains, and leveraging digital marketing tools.
The adoption of advanced technology has become a critical factor in differentiating market players. Companies are increasingly utilizing data analytics to understand consumer behavior, engaging with audiences through social media platforms, and optimizing supply chains to gain competitive advantages. For instance, Mixue's IPO in Hong Kong raised HKD 3.45 billion in 2025, as reported by CNBC. The capital is being allocated to the construction of a manufacturing plant in Southeast Asia and the implementation of robotics technology, which will help the company reduce unit costs and compete more effectively against artisanal producers. Additionally, multinational corporations like Unilever are capitalizing on their existing RTD tea distribution networks to expand into mainstream retail channels, thereby intensifying competition for regional brands. Opportunities in the market are expanding, particularly in premium product segments, functional ingredients, and sustainable packaging solutions that align with evolving consumer preferences. To succeed, companies must balance maintaining authenticity with driving innovation, while also adapting to the unique conditions and regulatory requirements of local markets.
Vertical integration within the supply chain continues to gain momentum. Leading companies are acquiring tapioca pearl manufacturers to ensure consistent quality in terms of texture and flavor absorption. Investments are also being directed toward manufacturing facilities equipped with IoT sensors, which enhance production monitoring, minimize waste, and improve traceability. Sustainability, while presenting challenges, also offers significant opportunities. Companies adopting recycled PET materials and alternative straw options are gaining a competitive edge in securing retail partnerships. Smaller firms are thriving alongside larger competitors by developing specialized products such as sugar-free monk-fruit syrups and adaptogenic tea bases. These smaller players are also forming partnerships with supermarket chains for white-label production, enabling them to carve out a niche in the market. Furthermore, strategic collaborations with K-pop groups and e-sports teams are helping brands establish cultural relevance, driving engagement on social media, and boosting retail sales. Larger companies are actively seeking to replicate these successful strategies to enhance their market presence.
Bubble Tea Industry Leaders
-
HeyTea
-
Chatime
-
BUBLUV
-
Del Monte Foods, Inc (Joyba)
-
CoCo Fresh Tea and Juice
- *Disclaimer: Major Players sorted in no particular order

Recent Industry Developments
- April 2025: HTeaO launched 'HTeaO Refreshers' beverage line featuring fruit-forward, tea-based drinks that blend brewed tea, fruit syrups, and lemonade, targeting health-conscious consumers seeking low-caffeine functional energy alternatives.
- March 2024: Simple Boba launched a clean-label RTD boba beverage line at Expo West, featuring crystal boba made from konjac, addressing traditional tapioca challenges in ready-to-drink formats. The product offers a 160-day shelf life and is available in Assam Black Tea, Hojicha Green Tea, and Mango Juice flavors, priced at USD 4.99 per bottle.
- March 2024: Alo and Jenji launched a new ready-to-drink boba tea range at IFE 2024 under the Jenji brand, featuring Original and Pure lines with proprietary Coco Jelly Boba pearls. The products are vegan, GMO-free, and use no artificial colors or preservatives, available in 16.5 oz aluminum cans and 10.8 oz slim cans


Global Bubble Tea Market Report Scope
Bubble tea is mixed with milk or fruits and topped with chewy tapioca pearls. The global bubble tea market report is segmented by base ingredient type, tea type, distribution channel, packaging form, and geography. By base ingredient type, the market is segmented into milk-based and plant-based. By tea type, the market is segmented into black tea, green tea, oolong tea, and other types. By distribution channel, the market is segmented into supermarkets/hypermarkets, specialty stores, online retail, and other channels. By packaging form, the market is segmented into PET/glass bottles, aluminium cans, pouches, and sealed caps cups. By geography, the market is segmented into North America, South America, Europe, Asia-Pacific, the Middle East and Africa. For each segment, the market forecasts are provided in terms of value (USD) and volume (liters).
| Milk-based |
| Plant-based |
| Black Tea |
| Green Tea |
| Oolong Tea |
| Other Types (Herbal, Floral Tea, Specialty Blends) |
| Supermarkets/Hypermarkets |
| Specialty Stores |
| Online Retail Channels |
| Other Distribution Channels |
| PET/Glass Bottles |
| Aluminium Cans |
| Pouches and Sealed Caps Cups |
| North America | United States |
| Canada | |
| Mexico | |
| Rest of North America | |
| South America | Brazil |
| Argentina | |
| Colombia | |
| Chile | |
| Rest of South America | |
| Europe | United Kingdom |
| Germany | |
| France | |
| Italy | |
| Spain | |
| Russia | |
| Sweden | |
| Belgium | |
| Poland | |
| Netherlands | |
| Rest of Europe | |
| Asia-Pacific | China |
| Japan | |
| India | |
| Thailand | |
| Singapore | |
| Indonesia | |
| South Korea | |
| Australia | |
| New Zealand | |
| Rest of Asia-Pacific | |
| Middle East and Africa | United Arab Emirates |
| South Africa | |
| Saudi Arabia | |
| Nigeria | |
| Egypt | |
| Morocco | |
| Turkey | |
| Rest of Middle East and Africa |
| By Base Ingredient Type | Milk-based | |
| Plant-based | ||
| By Tea Type | Black Tea | |
| Green Tea | ||
| Oolong Tea | ||
| Other Types (Herbal, Floral Tea, Specialty Blends) | ||
| By Distribution Channel | Supermarkets/Hypermarkets | |
| Specialty Stores | ||
| Online Retail Channels | ||
| Other Distribution Channels | ||
| By Packaging Form | PET/Glass Bottles | |
| Aluminium Cans | ||
| Pouches and Sealed Caps Cups | ||
| By Geography | North America | United States |
| Canada | ||
| Mexico | ||
| Rest of North America | ||
| South America | Brazil | |
| Argentina | ||
| Colombia | ||
| Chile | ||
| Rest of South America | ||
| Europe | United Kingdom | |
| Germany | ||
| France | ||
| Italy | ||
| Spain | ||
| Russia | ||
| Sweden | ||
| Belgium | ||
| Poland | ||
| Netherlands | ||
| Rest of Europe | ||
| Asia-Pacific | China | |
| Japan | ||
| India | ||
| Thailand | ||
| Singapore | ||
| Indonesia | ||
| South Korea | ||
| Australia | ||
| New Zealand | ||
| Rest of Asia-Pacific | ||
| Middle East and Africa | United Arab Emirates | |
| South Africa | ||
| Saudi Arabia | ||
| Nigeria | ||
| Egypt | ||
| Morocco | ||
| Turkey | ||
| Rest of Middle East and Africa | ||


Key Questions Answered in the Report
What is the current size of the bubble tea market and its expected growth?
The bubble tea market size is USD 2.99 billion in 2026 and is projected to reach USD 4.72 billion by 2031 at a 9.56% CAGR.
Which region is growing fastest in bubble tea consumption?
North America leads growth with a projected 10.22% CAGR through 2031, spurred by chain rollouts in multicultural cities.
Which tea base is expanding most rapidly?
Oolong tea is the fastest-growing base, advancing at a 10.84% CAGR on the back of premium positioning and provenance storytelling.
How are sustainability regulations affecting packaging choices?
Single-use plastic bans in Canada, the EU, and multiple U.S. states are driving a shift toward pouches and compostable materials that add 20-30% to packaging costs.
Page last updated on:


