
Syrup Market Size and Share
Market Overview
| Study Period | 2021 - 2031 |
|---|---|
| Market Size (2026) | USD 52.22 Billion |
| Market Size (2031) | USD 68.44 Billion |
| Growth Rate (2026 - 2031) | 5.56 % |
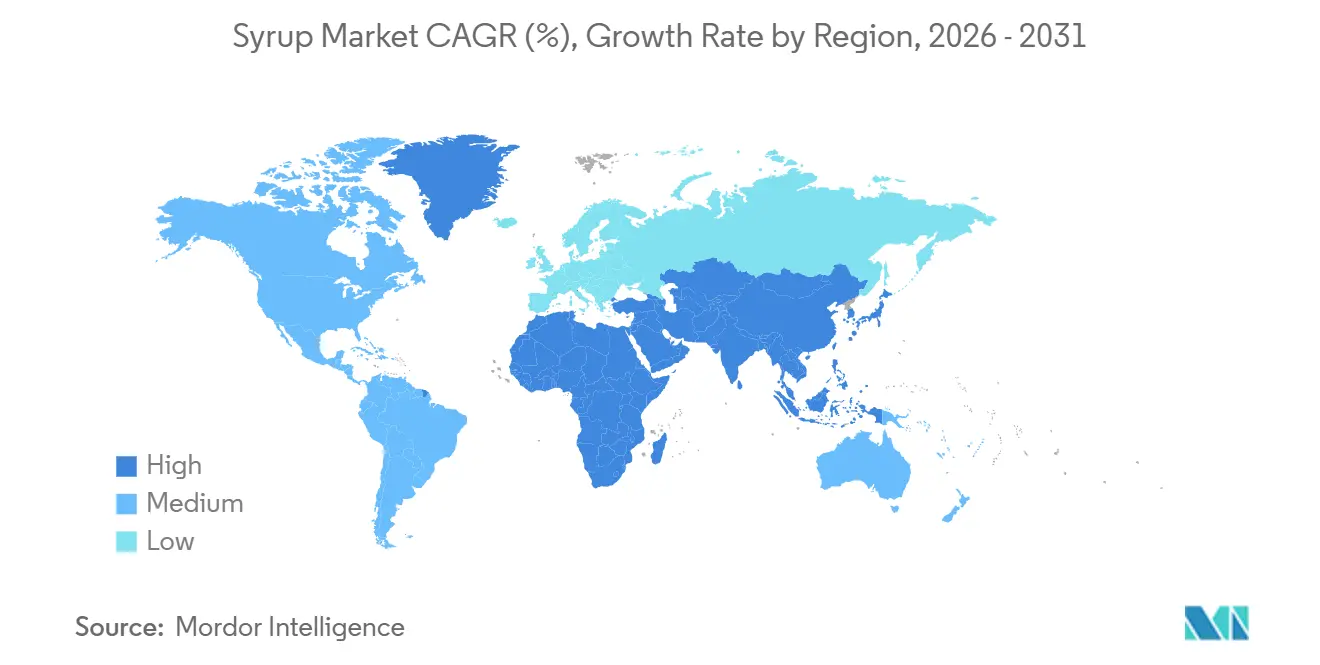
| Fastest Growing Market | Asia Pacific |
| Largest Market | North America |
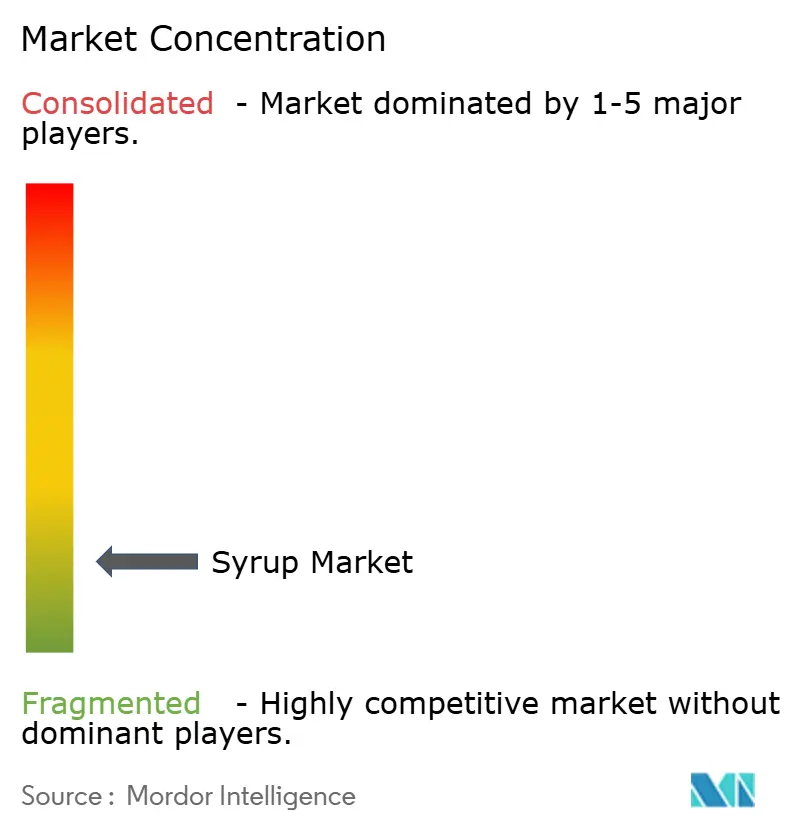
| Market Concentration | Low |
Major Players
*Disclaimer: Major Players sorted in no particular order Image © Mordor Intelligence. Reuse requires attribution under CC BY 4.0. |
|
Syrup Market Analysis by Mordor Intelligence
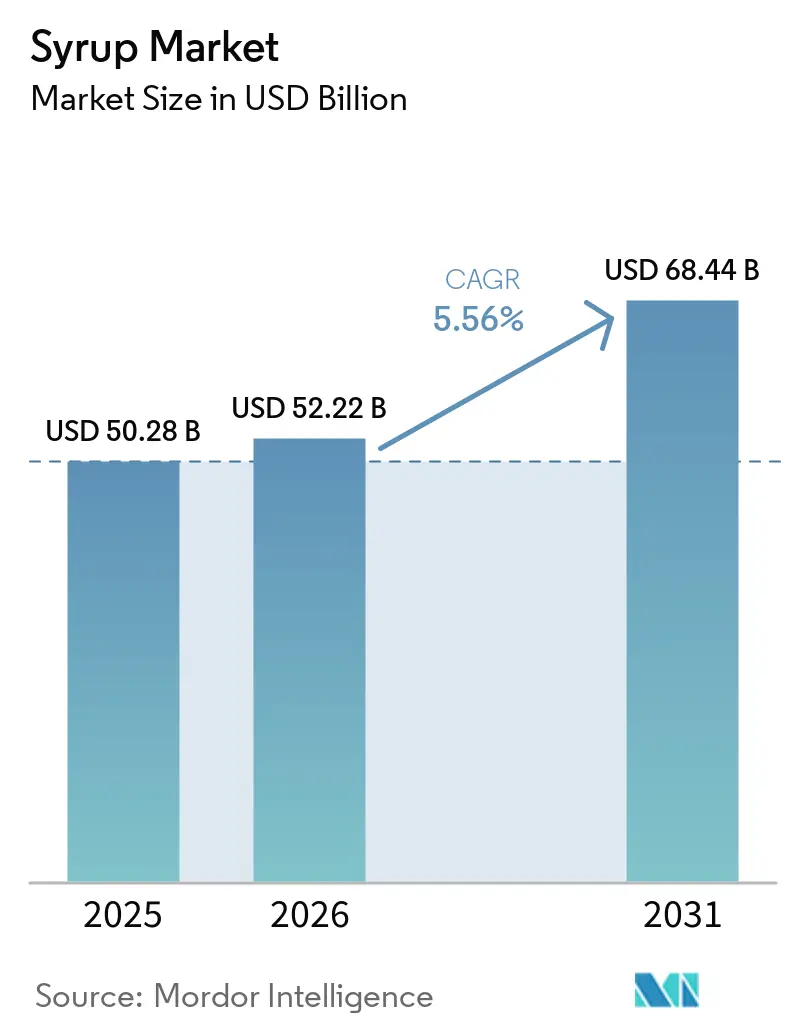
The Syrup Market size is projected to be USD 50.28 billion in 2025, USD 52.22 billion in 2026, and reach USD 68.44 billion by 2031, growing at a CAGR of 5.56% from 2026 to 2031. Product innovation, premium positioning, and stricter health regulations have now surpassed cost leadership as the key drivers of competitive advantage. Although a cocoa-price surge in 2024 increased chocolate syrup prices, it continues to exhibit the fastest unit growth as consumers associate single-origin and organic cocoa notes with premium indulgence. Honey maintains the largest volume share due to its natural image. In response to Canada's front-of-package labeling and the United States' updated "healthy" regulations, retailers are dedicating more shelf space to organic and sugar-reduced products, shifting away from traditional high-sugar recipes. Meanwhile, Asia-Pacific, driven by China's growing specialty consumption, is experiencing a café boom, boosting demand for botanical flavors like yuzu and pandan.
Key Report Takeaways
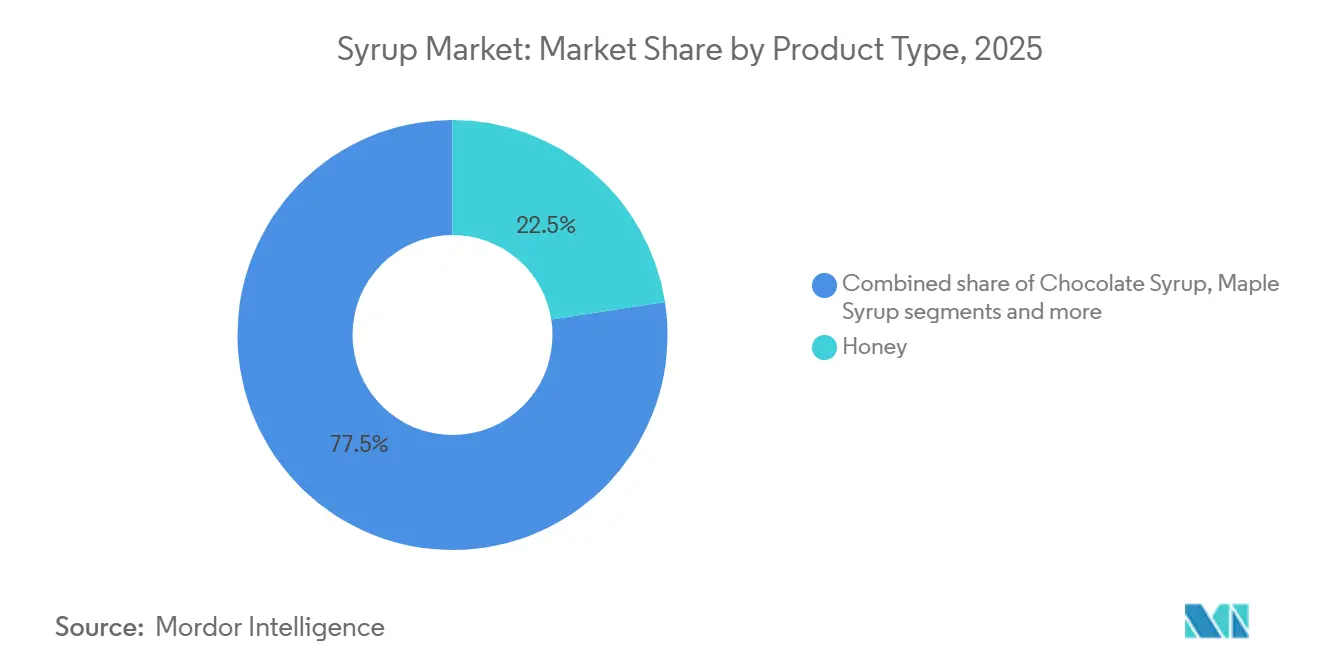
- By product type, honey captured 22.54% of the syrups market share in 2025. At the same time, chocolate syrup is forecast to expand at a 6.97% CAGR between 2026 and 2031.
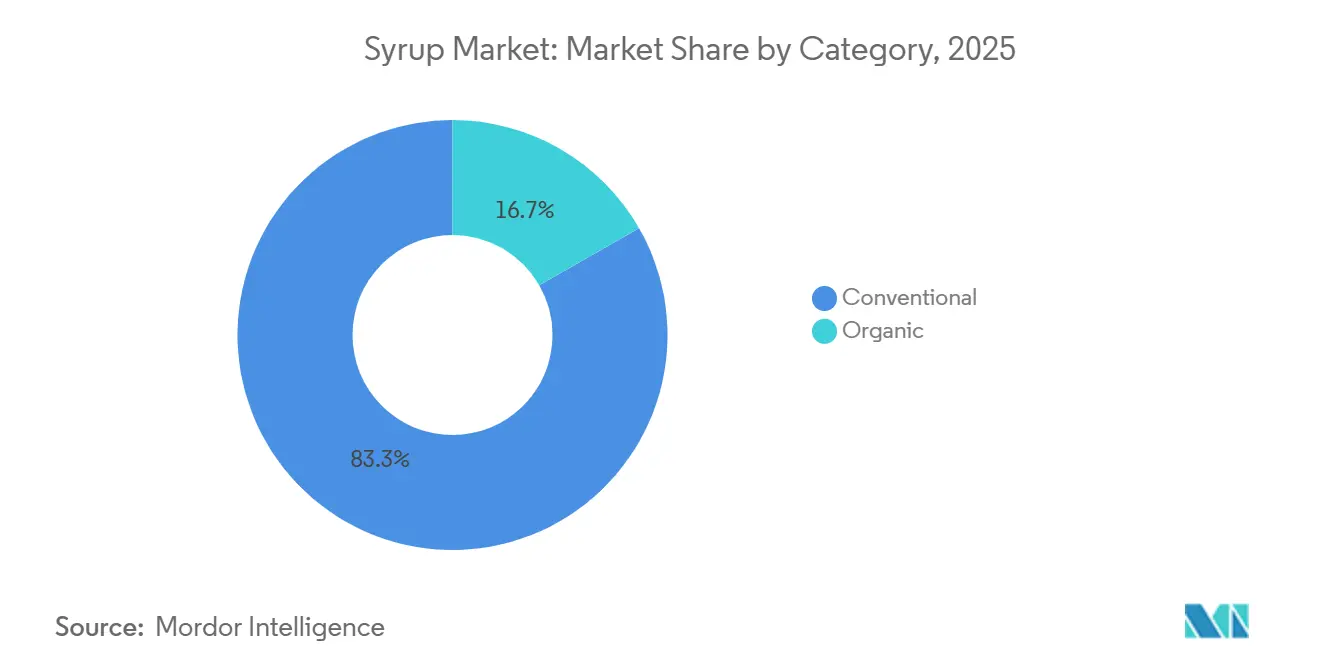
- By category, conventional variants held 83.27% of the syrups market size in 2025, while organic posted the highest projected CAGR at 6.31% through 2031.
- By distribution channel, food and beverage manufacturing accounted for 48.84% of the syrups market size in 2025, and retail is advancing at a 6.39% CAGR to 2031.
- By geography, North America led with 28.47% revenue share in 2025; Asia-Pacific is projected to grow at 6.84% CAGR through 2031.
Note: Market size and forecast figures in this report are generated using Mordor Intelligence’s proprietary estimation framework, updated with the latest available data and insights as of January 2026.
Market Trends and Insights
Drivers Impact Analysis of Syrup Market*
| Driver | (~) % Impact on CAGR Forecast | Geographic Relevance | Impact Timeline |
|---|---|---|---|
| Premiumisation and flavour innovation | +1.2% | Global, with concentration in North America, Europe, and urban Asia-Pacific | Medium term (2-4 years) |
| Expansion of café culture and specialty beverages | +1.4% | Asia-Pacific core (China, India, Southeast Asia), spill-over to Middle East | Medium term (2-4 years) |
| Growing demand for clean-label / organic syrups | +0.9% | North America and Europe, emerging in urban Asia-Pacific | Long term (≥ 4 years) |
| Rising health-oriented and sugar-reduced syrups | +1.1% | Global, regulatory-driven in North America and Europe | Short term (≤ 2 years) |
| Home baking and at-home gourmet beverage trends | +0.6% | North America and Europe, post-pandemic sustained behavior | Short term (≤ 2 years) |
| Plant-based dairy alternatives driving syrup masking needs | +0.7% | North America and Europe, expanding to Asia-Pacific | Medium term (2-4 years) |
| Source: Mordor Intelligence | |||
Premiumization and flavor innovation
Consumers are showing an increasing willingness to pay 20 to 30 percent more for botanical and regionally inspired flavor profiles, positioning flavor differentiation as a critical strategy for margin growth. In 2024, Monin launched ube syrup, capitalizing on the purple yam's appealing color and mild sweetness. This was followed by pandan and yuzu variants, designed to attract both the Asian diaspora and adventurous Western audiences. Although vanilla and caramel syrups remain volume leaders, they are gradually losing market share to floral flavors like lavender, hibiscus, and elderflower. These floral notes are becoming more popular, particularly in craft cocktails and specialty coffee, reflecting a shift toward premiumisation. Ingredient suppliers are reporting double-digit growth in natural-flavor extracts. The strategic insight for brands is clear: those that update their flavor portfolios quarterly, rather than annually, are gaining a competitive edge. These brands are securing a larger share in foodservice and retail channels, where novelty in flavored syrups drives both trial and repeat purchases.
Expansion of café culture and specialty beverages
China's growing coffee consumption has positioned the country as the world's second-largest specialty beverage market, following the United States. This expansion is not limited to tier-1 cities; Starbucks and local brands like Luckin Coffee now operate in over 300 cities across China, each requiring syrup suppliers capable of consistently delivering unique flavor profiles at scale. In India, cities such as Mumbai, Bangalore, and Delhi are experiencing a rise in café culture, driven by a younger population and increasing disposable incomes. Similarly, Southeast Asia is emerging as a key market, with tech-savvy consumers in Indonesia, Thailand, and Vietnam adopting specialty beverages faster than earlier generations. The strategic insight: syrup manufacturers that partner with regional café chains to develop limited-time offerings can secure long-term supply agreements and boost brand visibility, ultimately driving retail demand.
Growing demand for clean-label / organic syrups
According to the International Food Information Council's 2024 report, 26% of United States consumers perceive the terms "natural" and "organic" as indicators of improved food safety, which enhances their confidence in products bearing these certifications [1]Source: International Food Information Council, "2024 IFIC Food and Health Survey ", foodinsight.org. The organic syrups market is anticipated to grow at a compound annual growth rate (CAGR) of 6.31% through 2031, driven by two key factors: regulatory initiatives supporting organic farming practices and the increasing preference of retailers to allocate shelf space to clean-label products. A notable example of technological advancement in this space is Cargill's EverSweet, a stevia platform that was commercially launched in 2024. This innovation delivers zero-calorie sweetness through a fermentation process rather than traditional extraction methods. By doing so, it adheres to organic standards while achieving cost parity with conventional sweeteners, making it a competitive offering in the market. Additionally, the European Union's stricter organic-certification standards, implemented in 2024, have resulted in higher compliance costs for producers. However, these changes have also created a competitive advantage for established suppliers with robust traceability systems in place. For brands, the implications are significant: those that fail to offer organic stock-keeping units (SKUs) risk losing valuable shelf space in premium grocery channels. This is particularly critical in categories such as syrups and condiments, where organic products have achieved substantial market penetration.
Rising health-oriented and sugar-reduced syrups
In 2024, the United States Food and Drug Administration's finalized rule on "healthy" nutrient-content claims imposes a strict limit on added sugars, capping them at 5% of the daily value per serving. This regulation effectively disqualifies traditional syrups from being marketed as "healthy" unless they undergo reformulation to meet the new standards. As a result, the use of alternative sweeteners has gained significant traction. Allulose, a rare sugar that provides 70% of the sweetness of sucrose with negligible caloric impact, and monk fruit extract, which is 150 to 200 times sweeter than sucrose and does not trigger a glycemic response, have emerged as preferred options for manufacturers. Furthermore, sugar taxes implemented in countries such as Mexico, the United Kingdom, and Indonesia are exerting additional pressure on the demand for high-sugar products. In response, manufacturers are adopting a dual strategy by introducing tiered product lines. These include premium low-sugar variants targeted at health-conscious consumers and traditional recipes aimed at value-oriented buyers, enabling companies to maintain market share across different price segments. The rising prevalence of diabetes is also driving consumer preferences toward health-oriented and sugar-reduced syrups. According to the International Diabetes Federation, 11.1% of the global adult population was affected by diabetes in 2024 [2]Source: International Diabetes Federation, "IDF Diabetes Atlas - Eleventh Edition (2025)", idf.org. This growing health concern has heightened the demand for products that align with healthier lifestyles. The strategic implication is clear: health positioning is no longer optional for manufacturers. It has become a critical factor in determining access to key institutional channels, including schools, hospitals, and corporate cafeterias, where health-focused products are increasingly prioritized.
Restraints Impact Analysis of Syrup Market*
| Restraint | (~) % Impact on CAGR Forecast | Geographic Relevance | Impact Timeline |
|---|---|---|---|
| Volatility in sugar and cocoa prices | -1.3% | Global, acute in cocoa-dependent chocolate syrup and sugar-intensive formulations | Short term (≤ 2 years) |
| Regulatory pressure on added-sugar content | -0.8% | North America and Europe, expanding to Asia-Pacific | Medium term (2-4 years) |
| Increasing private-label competition in mature markets | -0.6% | North America and Europe | Long term (≥ 4 years) |
| Negative perception of artificial additives | -0.5% | Global, strongest in North America and Europe | Medium term (2-4 years) |
| Source: Mordor Intelligence | |||
Volatility in sugar and cocoa prices
In 2024, cocoa futures prices experienced a significant surge, primarily due to crop failures in Ivory Coast and Ghana. These two countries collectively account for a substantial portion of the global cocoa supply. The situation was further aggravated by the spread of the cocoa swollen shoot virus and the aging tree stock, which negatively impacted production levels. Similarly, sugar prices displayed notable volatility. According to data from the United States Department of Agriculture, domestic beet-sugar production in the United States declined as a result of severe drought conditions in the Northern Plains. At the same time, global sugar stocks tightened, adding further pressure to the market. Chocolate syrups manufacturers responded to these challenges by implementing shrinkflation strategies, which involved reducing package sizes by 10 to 15 percent while maintaining the same nominal prices. Additionally, they sought cost efficiencies by blending cocoa with carob and other lower-cost ingredients. However, this approach carries a significant strategic risk. Prolonged price increases could drive consumers to shift their preferences toward private-label products or non-chocolate alternatives, potentially undermining the brand equity that these manufacturers have built over decades.
Regulatory pressure on added-sugar content
Canada is set to implement mandatory front-of-package nutrition labeling in 2026, requiring products with sugar content exceeding 15 percent of the daily value per serving to display "high in sugar" warnings. This regulation is expected to impact most conventional syrups, as they typically surpass this threshold. In Mexico, the phased introduction of a sugar tax has created indirect pressure on syrup suppliers, as beverage manufacturers reformulate their products to avoid the additional levy. Similarly, the United Kingdom’s Soft Drinks Industry Levy continues to shape supplier strategies. For instance, Tate and Lyle has reported a significant shift in its sweetener portfolio, now focusing on reduced-calorie solutions to align with changing market demands. In 2024, Indonesia introduced a sugar tax targeting sweetened beverages with more than 5 grams of sugar per 100 milliliters. This policy has prompted syrup suppliers to innovate and produce low-sugar variants tailored specifically for the Southeast Asian market. However, the challenges for suppliers extend beyond reformulating products. Compliance requirements, including updates to product labeling, clinical testing to substantiate health claims, and rigorous supply-chain audits, have increased product-development costs by an estimated 8 to 12 percent. These additional costs often give larger players with established regulatory expertise a competitive advantage in navigating these evolving requirements.
*Our forecasts treat driver/restraint impacts as directional, not additive. The impact forecasts reflect baseline growth, mix effects, and variable interactions.
Syrup Market Segment Analysis
By Product Type:
Chocolate Leads Growth Despite Cocoa HeadwindsBetween 2026 and 2031, chocolate syrup is projected to grow at a robust 6.97 percent CAGR, making it the fastest-growing product type. This growth persists despite elevated cocoa prices, which surged by 172 percent in 2024. Manufacturers have responded by focusing on premiumisation, introducing single-origin cocoa syrups and organic variants that command a 30 to 40 percent price premium. They are also exploring cocoa-free alternatives, such as carob and fermented ingredients, which replicate chocolate's flavor profile. Honey, expected to hold a 22.54 percent market share in 2025, benefits from its reputation as a natural sweetener with perceived health advantages. In 2024, United States maple syrup production increased due to favorable spring weather and expanded tapping in Vermont and New York. However, Quebec, which accounts for a significant portion of global output, continues to dominate pricing power.
High-fructose corn syrup faces challenges as health-conscious consumers and institutional buyers shift toward natural sweeteners. However, it retains cost advantages in industrial applications where flavor neutrality and shelf stability take precedence over clean-label preferences. Fruit syrups, including berry, citrus, and tropical varieties, are gaining popularity in premium cocktail and mocktail segments, with bartenders favoring artisanal or house-made brands over mass-market options. Rice syrup and tapioca syrup cater to niche markets in gluten-free and allergen-friendly formulations, experiencing modest growth but lacking the volume scale of honey or chocolate. Malt syrup remains primarily used in brewing and baking, with minimal crossover into beverage or retail channels. The key insight: the fragmentation of product types creates opportunities for specialists. Brands that dominate a single category, such as Torani in coffee syrups or Wholesome Sweeteners in organic honey, often achieve higher margins than those with diversified portfolios.



By Category:
Organic Gains Share Through Retail PrioritizationIn 2025, conventional syrups accounted for 83.27 percent of the market share, highlighting their well-established distribution networks and price sensitivity among mainstream consumers. However, the 6.31 percent CAGR forecasted for organic syrups through 2031 reflects a significant shift in market trends. Retailers prioritize shelf space allocation based on product velocity and margin contribution. Although organic SKUs generate lower absolute sales, they achieve 15 to 20 percent higher gross margins due to premium pricing and reduced promotional requirements. Cargill's EverSweet, a stevia product certified as organic and non-GMO, exemplifies the technological advancements enabling organic syrups to replicate the taste profiles of conventional syrups while meeting clean-label standards. In 2024, the European Union revised its organic certification standards, introducing stricter traceability requirements. This change raised entry barriers but also strengthened the market position of established suppliers with robust supply-chain documentation. Certified organic product sales in the United States grew significantly in 2024, achieving a 5.2% annual growth rate, according to the Organic Trade Association [3]Source: Organic Trade Association, "Growth of U.S. Organic Marketplace Accelerated in 2024", ota.com.
Conventional syrups maintain their dominance in the foodservice and industrial sectors, where factors such as cost per serving and functional attributes—like viscosity, heat stability, and shelf life—take precedence over label claims. However, the gap is narrowing as organic suppliers achieve economies of scale. For example, increased production volumes of organic honey have driven prices down, reducing the premium over conventional options. This evolving market dynamic offers a competitive advantage: brands that operate in both segments, offering organic lines for premium retail markets and conventional products for foodservice, can maximize channel coverage. However, inconsistent positioning poses a risk of brand dilution.
By Distribution Channel:
Retail Accelerates Through E-CommerceIn 2025, food and beverage manufacturing accounted for a 48.84 percent market share, supported by long-term supply agreements with beverage bottlers, bakeries, and confectioners. At the same time, the retail sector, with an anticipated 6.39 percent CAGR through 2031, highlights increasing consumer demand for at-home premiumisation and the expansion of e-commerce. While supermarkets and hypermarkets remain the leading retail sub-channel for syrup sales, convenience stores and online platforms are growing at a faster pace by offering single-serve formats and subscription models that encourage repeat purchases.
Foodservice operations, including cafés, restaurants, and institutional kitchens, are benefiting from the growing popularity of specialty beverages but are facing margin pressures due to volume discount negotiations. Monin and DaVinci Gourmet lead this segment by utilizing dedicated sales teams and barista training programs to integrate their products into menu development. As retail continues to grow, manufacturers are adapting their packaging strategies, transitioning from bulk formats to consumer-friendly bottles with pour spouts and recipe suggestions. They are also increasing investments in direct-to-consumer channels to bypass traditional grocery intermediaries. The key insight: an omnichannel strategy is essential. Brands lacking strong e-commerce capabilities and retail partnerships risk losing market share to digitally-native competitors and private-label alternatives.
Geography Analysis
North America Syrup Market
In 2025, North America accounted for 28.47 percent of the market share, supported by its well-established café culture, high sweetener consumption, and strong distribution networks. However, the region's growth is slowing due to health-conscious trends and regulatory constraints on sugar-heavy products. Favorable spring weather and increased tapping in Vermont, New York, and Wisconsin drove a rise in United States maple syrup production, reducing reliance on Quebec imports. Canada's front-of-package nutrition labeling, effective in 2026, is driving syrup reformulations toward reduced sugar and natural sweeteners, accelerating the adoption of stevia, monk fruit, and allulose. In 2024, Mexico's sugar tax of 2 pesos per liter on sweetened beverages indirectly affected syrup suppliers, as beverage manufacturers reformulated to avoid the tax, increasing demand for low-calorie alternatives.
APAC Syrup Market
Asia-Pacific, expected to grow at an annual rate of 6.84 percent through 2031, is the most dynamic market, driven by urbanization, rising disposable incomes, and a growing café culture. In China, the expansion of specialty coffee shops in urban areas has fueled demand for botanical syrups such as yuzu, ube, and pandan. In India, younger demographics and the widespread adoption of digital payments, simplifying transactions, are driving increased café penetration in metropolitan areas. Southeast Asian countries, including Indonesia, Thailand, and Vietnam, are experiencing similar trends, with tech-savvy consumers embracing specialty beverages faster than earlier generations. This shift creates opportunities for syrup suppliers to collaborate with regional chains on limited-time offerings. Meanwhile, in the mature markets of Japan and South Korea, where sweetener consumption is high, there is a growing preference for health-focused products, with organic and sugar-reduced syrups gaining traction in premium retail channels.
EMEA and South America Syrup Market
Europe's growth story reflects a balance between strict regulations and a focus on premium products. Germany and France are leading the adoption of organic syrups, supported by strong certification systems and consumers' willingness to pay more for clean-label products. In South America, Brazil and Argentina are key growth areas, with a rising middle class and expanding café culture mirroring trends in the Asia-Pacific. However, economic instability and currency fluctuations pose challenges to growth. The Middle East and Africa, while still emerging, are seeing increasing demand. The United Arab Emirates and Saudi Arabia, driven by expatriate populations and tourism-led foodservice growth, are leading the region. In contrast, Nigeria and Egypt offer long-term potential, dependent on infrastructure improvements and regulatory stability.

Regulatory Landscape
Added-sugar disclosure and nutrient-claim tightening are central regulatory themes affecting syrup formulation and labeling. In the United States, the FDA finalized its updated "healthy" nutrient-content claim rule in 2024, setting a strict limit of 5% of the daily value for added sugars per serving, which generally requires most conventional syrups to reformulate or avoid the claim. Canada is implementing mandatory front-of-package nutrition labeling in 2026, requiring a "high in sugar" symbol for products exceeding 15% of daily value per serving, which is pushing retailer and brand shifts toward reduced-sugar and alternative-sweetener recipes.
Regulatory scrutiny is also extending to ingredient oversight and additive governance. In early 2026, the FDA Human Foods Program listed GRAS reform and sugar-reduction strategies among its priority deliverables, alongside continued work on front-of-pack nutrition labeling approaches. In the European Union, rulemaking continues to adjust permitted ingredients and use conditions relevant to syrups and sweet toppings, including Commission Implementing Regulation (EU) 2025/97 (January 2025) authorizing new conditions of use and specifications for isomalto-oligosaccharide in product categories that include sweet sauces, toppings, and syrups, along with updates to food additive annexes under Regulation (EC) No 1333/2008 (October 2025).
Competitive Landscape
The syrups market, marked by low market concentration, presents significant opportunities for regional specialists and private-label entrants. These players are increasingly prioritizing flavor innovation, clean-label positioning, and channel-specific strategies. Leading the foodservice sector, established brands like Monin, Torani, and DaVinci Gourmet leverage dedicated sales teams and barista training programs. In the retail chocolate syrup segment, major players such as Hershey and Nestlé utilize their strong brand equity and extensive distribution networks. Private-label offerings have consistently outperformed national brands for 30 consecutive months, driven by retailer investments in quality improvements and competitive pricing. This trend has compressed margins for established players, underscoring the importance of agility in launching new flavors and reformulating products to meet clean-label demands.
The syrup market is highly competitive, with numerous domestic and multinational players striving for a substantial share. The major players operating in the market are Nestlé SA, Conagra Brands Inc., The Hershey Company, The J.M. Smucker Company, and The Kraft Heinz Company. These companies frequently adopt strategies such as mergers, expansions, acquisitions, and partnerships to strengthen their market presence. Leading players are not only diversifying their product portfolios but also expanding their global footprint to cater to varying regional customer preferences.
White-space opportunities in the syrup market are concentrated around three key areas: masking flavors in plant-based dairy, integrating functional ingredients, and embracing direct-to-consumer sales models. As oat milk and almond milk gained popularity through 2025, the demand for syrups capable of masking off-notes while delivering balanced sweetness has grown, driving the need for specialized formulations. Cargill's EverSweet stevia platform, launched commercially in 2024, exemplifies technological innovation by providing zero-calorie sweetness through fermentation, meeting organic standards, and achieving cost parity with traditional sweeteners. Emerging disruptors like Planet A Foods, which developed cocoa-free chocolate alternatives using fermentation, reflect a broader trend toward ingredient innovation. This approach not only decouples flavor production from traditional raw materials but also reduces exposure to commodity-price volatility. The key insight: in this dynamic market, scale alone is insufficient; success hinges on the ability to quickly introduce trending flavors and establish credible health-focused positioning to capture market share.
Syrup Industry Leaders
-
The Hershey Company
-
Conagra Brands Inc.
-
The Kraft Heinz Company
-
The J.M. Smucker Company
-
Nestle SA
- *Disclaimer: Major Players sorted in no particular order
Syrup Market Companies Covered in this Report
- The Hershey Company
- The Kraft Heinz Company
- Nestle S.A.
- Monin SAS
- Kerry Group plc
- Conagra Brands Inc.
- The J.M. Smucker Company
- Tate and Lyle plc
- Archer Daniels Midland (ADM)
- Torani
- Amoretti
- Sensient Technologies
- Cargill Inc.
- Ingredion Incorporated
- Sonoma Syrup Co.
- DaVinci Gourmet
- Bosco Products Inc.
- AH LASKA
- Wholesome Sweeteners Inc.
- Trisco Foods

Market Opportunities and Future Outlook
Sugar-reduction compliance and premium flavor rotation are creating opportunities for suppliers that can deliver clean-label sweetness systems without compromising mouthfeel. As nutrient-claim and labeling requirements tighten (for example, the FDA "healthy" added-sugar cap finalized in 2024 and Canada's 2026 front-of-package labeling rollout), reformulation activity is increasingly oriented toward allulose, monk fruit, and stevia-based approaches, while brands differentiate through botanical profiles such as yuzu and pandan in both cafe and retail settings. Fermentation-enabled sweetener platforms, including Cargill's EverSweet (commercially launched in 2024), align with this direction by enabling sugar reduction and supporting organic-aligned positioning while keeping sensory performance in focus.
Supply-side changes are also reshaping syrup-input sourcing options and competitive intensity, particularly in HFCS and glucose streams. China has a visible pipeline of starch sugar projects under construction or approved as of March 2026, with combined planned capacity around 2.34 million tonnes, and HFCS representing the primary share of investment, which reinforces a lower-cost, high-volume baseline for industrial users. Alongside that, regional capacity additions and reliability initiatives are creating procurement alternatives, including Siroperie Meurens' scheduled completion of a 1,000 square meter production extension at its Aubel, Belgium site in April 2026 (about 30% capacity increase), Regaal Resources' commissioning of new liquid glucose (180 MT/day) and maltodextrin (50 MT/day) facilities in Kishanganj, Bihar in May 2026, and Sucro Limited's March 2026 announcement of a strategic raw sugar supply agreement to support ramp-up at its University Park, Illinois refinery (targeting 350,000 metric tons annual production).
Recent Industry Developments in Syrup Market
- April 2026: The Hershey Company reported first-quarter 2026 results and reaffirmed its full-year 2026 outlook. The update signaled continued prioritization of brand-led growth and innovation investment across its portfolio, supporting sustained marketing and product programs that influence demand for branded chocolate syrups in retail and foodservice.
- June 2025: Conagra Brands completed the divestitures of Chef Boyardee, Van de Kamp's, and Mrs. Paul's. The portfolio reshaping can reallocate capital and management focus toward categories and growth platforms with stronger strategic fit, affecting competitive behavior and investment pacing across packaged foods that intersect with sweet condiments and toppings.
- January 2024: APIS Honey launched Apis Organic Honey sourced from Kashmir in India, expanding organic-positioned offerings with differentiated packaging. The move aligned with retailer and consumer preference shifts toward clean-label and organic sweeteners, reinforcing competitive pressure on conventional syrup products in premium retail channels.


Syrup Market Report Scope and Research Methodology
Market Definition and Coverage
For this report, the syrups market is defined as packaged syrup products sold for food and beverage uses, tracked in value terms across major geographies and common sales routes, and then projected using demand and pricing signals.
Scope exclusions: We exclude raw sweeteners and bulk industrial sweetener intermediates that are not marketed and sold as syrup products to foodservice or retail buyers.
Segments Covered in This Report
-
By Product Type
- Chocolate Syrup
- Maple Syrup
- High-fructose Corn Syrup
- Rice Syrup
- Malt Syrup
- Tapioca Syrup
- Honey
- Fruit Syrup
- Others
-
By Category
- Organic
- Conventional
-
By Distribution Channel
- Food and Beverages Manufacturing
- Foodservice
-
Retail
- Supermarkets / Hypermarkets
- Convenience Stores
- Online Retail
- Other Distribution Channels
-
By Geography
-
North America
- United States
- Canada
- Mexico
- Rest of North America
-
South America
- Brazil
- Argentina
- Colombia
- Chile
- Rest of South America
-
Europe
- United Kingdom
- Germany
- France
- Italy
- Spain
- Russia
- Sweden
- Belgium
- Poland
- Netherlands
- Rest of Europe
-
Asia-Pacific
- China
- Japan
- India
- Thailand
- Singapore
- Indonesia
- South Korea
- Australia
- New Zealand
- Rest of Asia-Pacific
-
Middle East and Africa
- United Arab Emirates
- South Africa
- Saudi Arabia
- Nigeria
- Egypt
- Morocco
- Turkey
- Rest of Middle East and Africa
-
North America
Data Sources, Market Sizing, and Validation
Desk Research
Desk work starts by mapping demand and the pricing context that a syrup market model needs. For trade direction, we typically refer to public sources such as UN Comtrade and national customs portals. For sugar and crop-linked supply signals, we use FAOSTAT and USDA datasets, and we rely on national statistics agencies such as the US Census Bureau to anchor broad packaged food indicators.
After that, we refine sizing inputs using company annual reports, investor presentations, and credible press coverage that discusses volume expansion, product mix, and channel exposure. When a private-company data gap shows up, we use paid subscriptions for company financials and news intelligence. We also check an import-export shipment-level database to sense shifts in cross-border movement. These desk research sources are illustrative only, and many other public and paid references were also used for data collection, validation, and clarification.
Primary Interviews and Surveys
Primary work is used to pressure-test what desk signals cannot fully explain, especially channel mix, typical price movements, and where demand is coming from by end-use. We spoke with participants across manufacturing, distribution, and large buyers, and the coverage was balanced across APAC, EMEA, and the Americas so regional consumption patterns and labeling impacts could be cross-checked. When interview inputs conflicted, follow-ups were done until the assumptions could be stated in plain, measurable terms.
Distribution of primary research fieldwork respondents
| Company type | Respondent position | Region |
|---|---|---|
| Top tier: 33% | CXOs: 13% | APAC: 39% |
| Mid tier: 53% | Functional/Unit leaders: 36% | EMEA: 35% |
| Smaller Players: 14% | Managers: 51% | Americas: 26% |
Market-Sizing & Forecasting
Our core build starts from a top-down demand reconstruction where packaged food and beverage consumption indicators, foodservice activity, and observed trade flows are used to form a realistic demand pool for syrup products in each region. The totals are then corroborated with selective bottom-up checks, such as sampling brand and private-label price bands by channel and applying them to reasonable consumption volumes, followed by supplier and distributor sense checks to adjust any outliers.
A few inputs matter more than others, so they were tracked carefully and updated when new information appeared. These include syrup usage intensity in beverages and desserts, shifts between retail and foodservice, changes in organic or reduced-sugar mix that can move ASPs, packaging-driven price differences, and regional currency effects on reported value. Where direct volume clues were limited, we handled the gap by using proxy indicators (like channel expansion and category growth rates) and then validating the implied volumes with primary feedback.
For forecasting, we rely on scenario analysis supported by short time-series smoothing on key inputs, because demand is sensitive to inflation, foodservice recovery, and formulation trends. The forward path is anchored to expert views on near-term pricing and mix, and then extended using repeatable assumptions that can be explained and revisited each refresh.
Data Validation & Update Cycle
Validation is done in layers so the final market number is not dependent on a single data series. Model outputs are compared against independent signals, including trade direction, broad packaged food growth, and channel-level movement, and then variances are investigated before sign-off.
Anomaly checks are run at the region level and again at the global roll-up level, and a second analyst review is completed to confirm that inputs and math are consistent with the stated scope. If a material mismatch appears, or if a major event shifts pricing or supply, relevant experts are re-contacted and the assumptions are updated. Reports are refreshed annually, with interim updates for material events, and a fresh pre-delivery check is completed so clients receive the latest view.
Mordor Intelligence's Syrups Market Size Compared With Other Published Estimates
Published syrup market estimates can look far apart, even when they are talking about similar products, because the math is built on different starting points and different conversion steps. In our checks, the biggest swings usually come from what is counted as a syrup product versus an adjacent sweetener category, and from whether values are captured at retail, wholesale, or manufacturer level.
Pharmaceutical-use syrups sit outside Mordor Intelligence's scope for this syrups market number, and that single inclusion choice can lift figures that otherwise look close on a year label. Differences also show up when a publisher uses factory-gate revenues versus consumer selling prices, applies faster or slower ASP progression, or updates currency rates and channel splits at different times in the year. These gaps are small at the input level, but once they are multiplied across regions and channels, the totals can diverge noticeably.
Benchmark comparison
| Source | Market Size | Gaps in Research Methodology |
|---|---|---|
| Mordor Intelligence | USD 50.28 B (2025) | |
| Industry Publisher A | USD 53.60 B (2025) | Uses a wider application lens that can extend beyond food and beverage, and it may apply different channel pricing assumptions that move the value upward. |
| Industry Publisher B | USD 38.81 B (2025) | Reports factory-gate values and a narrower flavor set in parts of the definition, which can reduce the value compared with models that reflect downstream pricing. |
The table shows that most of the spread is explained by two practical items, which are scope adjacency and where the value is measured in the chain. By keeping the inputs tied to clear demand signals, and by stating the pricing level and exclusions in plain terms, we end up with a number that buyers can reconcile back to repeatable steps.


Key Questions Answered in the Report
How large is the syrups market in 2026?
The syrups market size stood at USD 52.22 billion in 2026.
What is the expected CAGR for syrups between 2026 and 2031?
The market is forecast to grow at a 5.56% CAGR during 2026-2031.
Which product type is projected to grow fastest through 2031?
Chocolate syrup is expected to post the highest pace, at a 6.97% CAGR.
Which region is likely to deliver the strongest growth?
Asia-Pacific is set to register the fastest expansion with a 6.84% CAGR.
Page last updated on:


 Your data is secure and never sold or shared.


