Crop Insurance Market Size and Share
Market Overview
| Study Period | 2020 - 2031 |
|---|---|
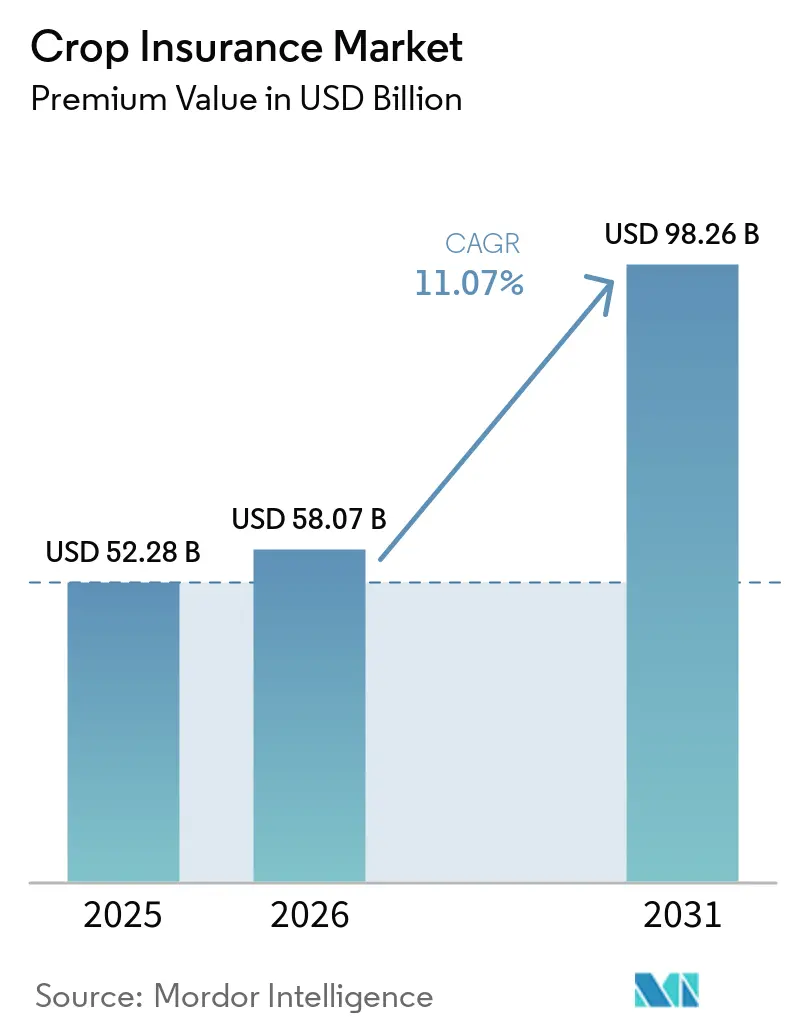
| Market Size (2026) | USD 58.07 Billion |
| Market Size (2031) | USD 98.26 Billion |
| Growth Rate (2026 - 2031) | 11.07% CAGR |
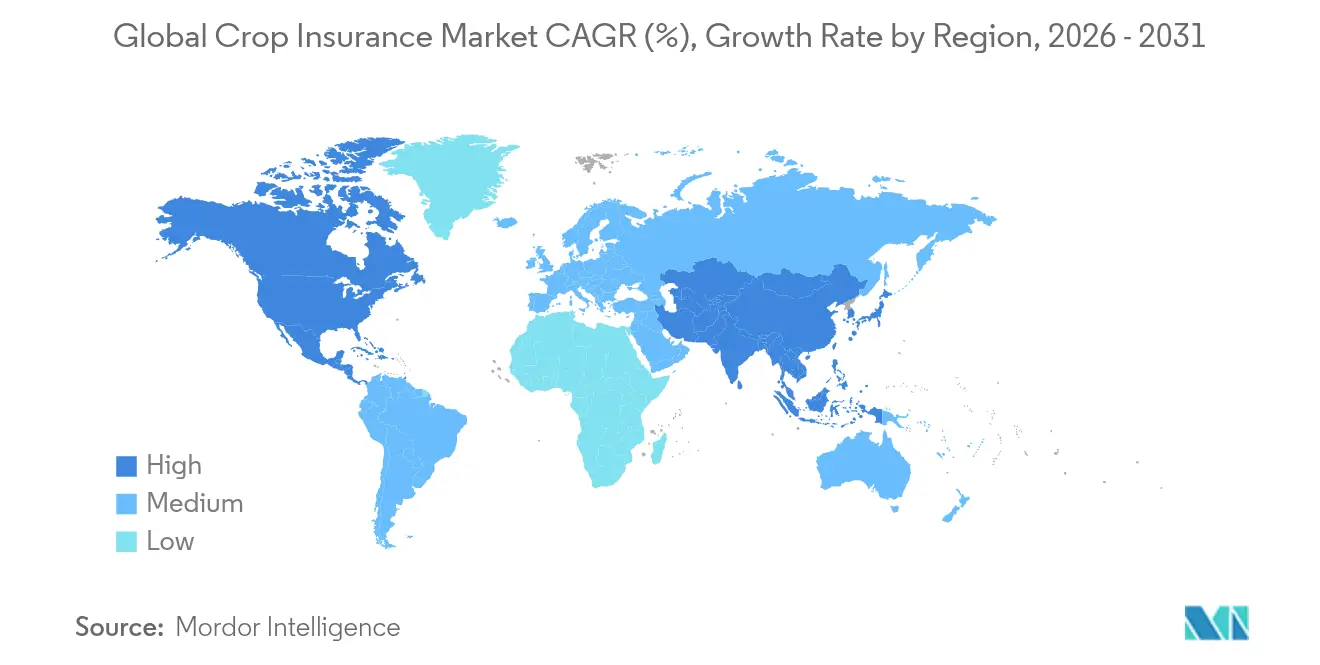
| Fastest Growing Market | Asia Pacific |
| Largest Market | North America |
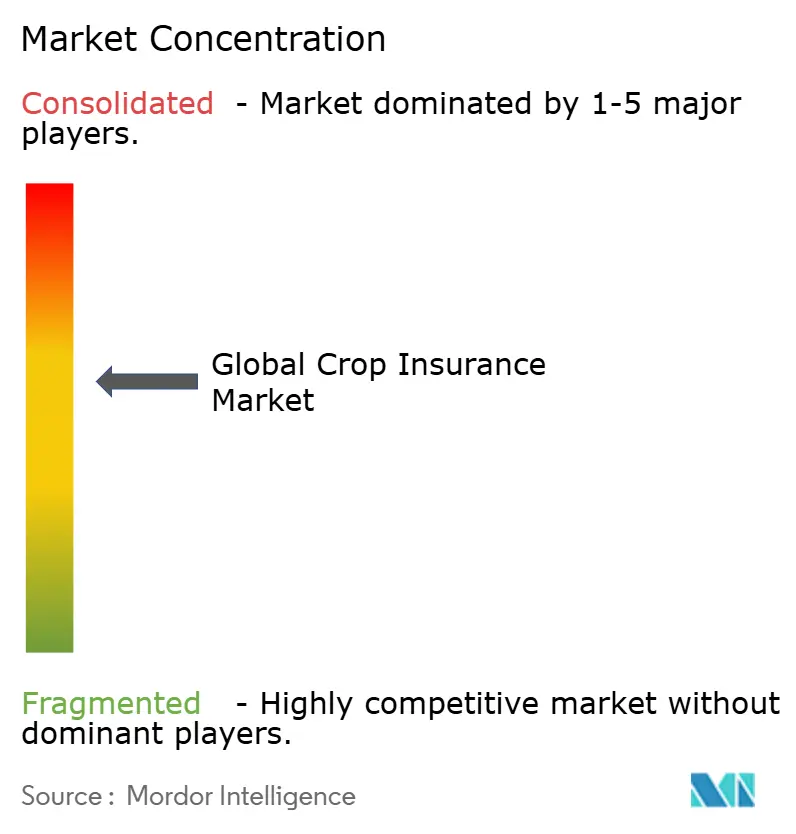
| Market Concentration | Medium |
Major Players *Disclaimer: Major Players sorted in no particular order Image © Mordor Intelligence. Reuse requires attribution under CC BY 4.0. | |
Crop Insurance Market Analysis by Mordor Intelligence
The Crop Insurance Market size in terms of premium value is projected to be USD 52.28 billion in 2025, USD 58.07 billion in 2026, and reach USD 98.26 billion by 2031, growing at a CAGR of 11.07% from 2026 to 2031.
Rising climate volatility, generous government subsidization that now covers about 60% of premium costs in leading farming economies, and rapid digitalization of underwriting workflows are combining to lift demand well beyond historical norms. The U.S. Federal Crop Insurance Program has already absorbed USD 27 billion in additional warming-related losses since 1991, signaling how weather risk is re-pricing agriculture worldwide. Growth is further fuelled by Asia-Pacific initiatives such as India’s Pradhan Mantri Fasal Bima Yojana and China’s “insurance + futures” model, both of which extend affordable coverage to tens of millions of smallholders. Technology is reshaping the global crop insurance market through satellite imagery, Internet-of-Things sensors, and AI-enabled pricing, all of which lower loss ratios and shorten claims cycles.
Key Report Takeaways
- By insurance type, multi-peril policies led with 47.10% revenue crop insurance market share in 2025, while weather-index parametric solutions are projected to grow at a 13.18% CAGR through 2031.
- By risk covered, standing-crop loss accounted for 38.35% of the global crop insurance market size in 2025; sowing & germination coverage is forecast to expand at an 11.36% CAGR to 2031.
- By distribution channel, banks and agricultural credit institutions held 33.10% crop insurance market share in 2025, whereas digital platforms are poised for the fastest 14.98% CAGR through 2031.
- By provider type, public insurers captured 40.10% of the global crop insurance market size in 2025; public-private partnerships will outpace with a 12.32% CAGR to 2031.
- By crop type, cereals & grains commanded 35.25% of 2025 revenue; commercial crops such as cotton and sugarcane are expected to expand at a 10.54% CAGR.
- By farm size, smallholders represented 54.00% of 2025 premiums and will grow at an 8.55% CAGR through 2031.
- Regionally, North America led with 45.10% revenue in 2025, while Asia-Pacific is the fastest-growing at a 10.36% CAGR.
Note: Market size and forecast figures in this report are generated using Mordor Intelligence’s proprietary estimation framework, updated with the latest available data and insights as of 2026.
Market Trends and Insights
Drivers Impact Analysis of Crop Insurance Market *
| Driver | ( ~ ) % Impact on CAGR Forecast | Geographic Relevance | Impact Timeline |
|---|---|---|---|
| Government-subsidized scheme expansion | +2.8% | India, China, Brazil, global spill-over | Medium term (2–4 years) |
| Escalating climate-related crop losses | +3.1% | North America, Europe, Australia, global | Long term (≥ 4 years) |
| Digital underwriting using satellite/IoT | +1.9% | Asia-Pacific core; Africa & Latin America spill-over | Short term (≤ 2 years) |
| Rising agri-credit penetration | +1.7% | Asia-Pacific, Sub-Saharan Africa, Latin America | Medium term (2–4 years) |
| Parametric micro-covers for African smallholders | +0.8% | Sub-Saharan Africa, with expansion to South Asia | Medium term (2-4 years) |
| Structured securitization demand for insured collateral | +1.2% | North America, Europe, select emerging markets | Long term (≥ 4 years) |
| Source: Mordor Intelligence | |||
Rapid expansion of government-subsidized schemes
Public spending has become the principal accelerant for the global crop insurance market, with subsidy ratios already sitting between 60% and 77% in the United States, India, and China. The proposed U.S. FARMER Act would push federal support to 77% for policies carrying up to 80% coverage, widening affordability for midsize and small farms. India’s PMFBY keeps farmer contributions as low as 2% of the sum insured, and China’s “insurance + futures” pilots have underwritten USD 18.8 billion across 1,224 counties, proving how subsidies scale novel risk-transfer structures[1]Li Zhang, “Insurance + Futures Model in Chinese Agriculture,” mdpi.com. Comparable measures under the European Union’s Common Agricultural Policy allocate USD 19.1 million annually to Dutch weather covers while letting member states cut income-loss triggers to 20%, further enlarging the risk pool.
Escalating climate-related crop losses accelerates demand.
Weather-driven indemnities surpassed USD 118.7 billion in the United States from 2001-2022, accounting for 73% of all payouts[2]Michael Jones, “Weather-Related Losses in U.S. Crop Insurance,” ewg.org. European farms suffer USD 30.5 billion in annual weather losses, yet only up to 30% is insured, highlighting a sizeable protection gap. Scientific consensus shows that every additional 1 °C rise could lift U.S. crop insurance premium outlays by USD 850 million per year. Such evidence is shifting insurance from optional to essential status, especially in zones where new rainfall and temperature patterns exceed historical norms. Modeling work indicates the probability of deep maize yield shortfalls in the U.S. Corn Belt could more than double by mid-century, demanding new actuarial baselines.
Digital underwriting (satellite/IoT) cuts the loss ratio.
Real-time earth-observation data now feeds underwriting engines that correlate rainfall, soil moisture, and vegetative stress, lowering basis risk and administrative cost. In Asia, parametric covers supported by the Asian Development Bank settle claims within days for 85,000 Philippine farmers, sidestepping site visits that once stretched to months. Multi-spectral indices have trimmed loss ratios by double-digit points at insurers piloting AI-powered calibration, while automated payouts improve farmer liquidity during peak input-purchase windows. Broader adoption is spreading to Latin America, where satellite-enabled parametric platforms are embedded in ag-fintech marketplaces.
Rising agri-credit penetration in emerging economies
Banks already distribute 33.5% of global crop policies because insured loans display lower default rates, making bundles attractive for both lenders and farmers. India’s regulator recently eased cross-border reinsurance rules to help domestic lenders secure capacity for bundled products. Mobile-first lenders across Kenya and Nigeria increasingly embed micro-insurance within seasonal input loans, drawing on digital wallets to collect premiums in installments. As credit deepens, demand for companion coverage rises, pulling previously uninsured smallholders into the global crop insurance market and improving portfolio quality for financial institutions.
Restraints Impact Analysis of Crop Insurance Market *
| Restraint | ( ~ ) % Impact on CAGR Forecast | Geographic Relevance | Impact Timeline |
|---|---|---|---|
| Fraud & misreporting of acreage/yield | −1.4% | Emerging markets with weaker oversight | Short term (≤ 2 years) |
| Affordability gaps for small & marginal farmers | −2.1% | Sub-Saharan Africa, South Asia, Latin America | Medium term (2–4 years) |
| Data-privacy backlash against remote-sensing | -0.7% | Europe, North America, select developed markets | Medium term (2-4 years) |
| Model uncertainty amid shifting climate baselines | -1.8% | Global, with higher impact in climate-vulnerable regions | Long term (≥ 4 years) |
| Source: Mordor Intelligence | |||
Fraud & misreporting of acreage/yield
Inconsistent acreage data and self-reported yields in China have led to inflated claim costs and tighter underwriting margins, raising concerns of moral hazard. Following spot checks that revealed discrepancies in collective farming cooperatives, China's regulator has directed provincial branches to bolster data verification efforts. Traditional indemnity products face the brunt of these challenges, leading to a shift towards satellite validation and parametric triggers. These technologies offer more accurate and objective data, reducing the reliance on self-reported figures and mitigating fraud risks. However, implementing these advanced technologies in markets with low Average Revenue Per User (ARPU) strains expense ratios, presenting a dilemma between curbing fraud and maintaining affordability in the global crop insurance sector. Striking a balance between technological adoption and cost efficiency remains critical for ensuring the sustainability of the global crop insurance market.
Affordability gaps for small & marginal farmers
Despite subsidies, many subsistence farmers find premium costs prohibitive. In the U.S., fewer than 10% of farms under 10 acres opt for insurance, reflecting the limited adoption among small-scale growers. Meanwhile, cash-strapped farmers in Africa often prioritize seeds and fertilizers over insurance, hindering market penetration and leaving them vulnerable to risks[3]U.S. Department of Agriculture, “Controlled Environment Pilot Expansion,” usda.gov. Micro-insurance initiatives have managed to increase global low-income coverage to 11.5%, but a significant affordability gap persists. Factors such as up-front payment demands, limited financial literacy, and complex enrollment paperwork continue to suppress insurance uptake. Introducing solutions like mobile wallet installments or post-harvest payment models could address these barriers and improve accessibility for small and marginal farmers.
*Our forecasts treat driver/restraint impacts as directional, not additive. The impact forecasts reflect baseline growth, mix effects, and variable interactions.
Crop Insurance Market Segment Analysis
By Insurance Type:
Multi-peril dominance faces digital disruption.Multi-peril policies retained 47.10% of revenue in 2025, underlining growers’ preference for broad protection against multiple weather, pest, and disease threats. Weather-index parametric products exhibit the fastest 13.18% CAGR to 2031, steadily chipping away at legacy product momentum. Revenue protection formats that incorporate price swings now appeal to grain producers facing volatile commodity markets, while niche named-peril hail covers stay relevant in geographies where convective storms produce localized damage.
Digitally native parametric offerings flourish in emerging economies where the lack of adjusters makes traditional loss assessment unviable. Providers fuse multisource data, radar precipitation, evapotranspiration, and vegetative indices to trigger payouts automatically, trimming claim processing to 72 hours on average. Meanwhile, actual-production-history contracts struggle where climate change renders past yield trends unreliable, catalyzing hybrid products that stitch climate projections into pricing algorithms. Carrier appetites are pivoting toward modular covers that let farmers blend multi-peril breadth with parametric speed, sustaining product innovation in the global crop insurance market.


By Risk Covered:
Standing-crop Protection Drives Premium GrowthIn 2025, standing-crop loss coverage accounted for 38.35% of total premiums. This type of coverage is essential for farmers who have made significant investments in their crops and are focused on protecting them as they mature. After investing heavily, farmers are keen on protecting their maturing crops. At the same time, products related to sowing and germination are witnessing a robust growth rate of 11.36% CAGR, a trend that's closely tied to increasing weather unpredictability during planting times. These products are becoming increasingly important as farmers face heightened risks during the critical planting windows. As logistics challenges and storm-related events lead to more warehouse spoilage, post-harvest coverage becomes crucial. This type of coverage helps mitigate losses caused by spoilage during storage and transportation. Additionally, growers situated in flood-prone river basins are increasingly drawn to prevented-planting endorsements, which provide financial protection when planting is not possible due to adverse weather conditions.
Current localized disasters encompass a wider range, including port closures that leave produce stranded, like typhoons or floods. These disruptions highlight the need for more comprehensive coverage options to address emerging risks. Reforms in the EU, which have reduced income stabilization thresholds to 20%, are spurring farmers to adopt revenue safeguards. These safeguards kick in earlier, providing a buffer against cash-flow disruptions and ensuring greater financial stability for farmers. With erratic rainfall leading to multiple seeding attempts in a single season, replant coverage has gained newfound significance. This coverage is particularly valuable as it helps farmers recover from the costs associated with replanting. The USDA is also responding, planning to boost reimbursements from 2026 to align with the rising costs of replanting. This planned increase reflects the growing financial burden on farmers and aims to provide better support in the face of changing climatic conditions.
By Distribution Channel:
Digital platforms challenge traditional networksBanks and ag-credit institutions held 33.10% of the 2025 premium, making them the largest conduit in the crop insurance market. Their bundled loan-plus-insurance offerings streamline compliance for borrowers and protect lenders’ collateral. Yet smartphone adoption is propelling mobile-first platforms that are forecast to climb at a 14.98% CAGR, helping insurers reach remote farmers direct. Government portals and direct sales remain viable in subsidy-heavy economies, whereas brokers reposition by specializing in complex risk structuring for large agribusinesses.
Africa and South Asia illustrate digital leapfrogging, with start-ups using USSD menus and e-wallets to collect sub-USD 10 premiums from growers managing less than 1 hectarea plots. In contrast, the U.S. distribution landscape is consolidating; Risk Strategies’ 2024 purchase of Silveus created a super-broker capable of servicing 40-state acreage with data-driven advisory. AI-powered recommendation engines integrated into mobile apps now propose personalized coverage levels based on remote-sensed crop health, lowering acquisition cost per policy in the global crop insurance market.
By Provider Type:
Public-private partnerships reshape market structure.Public carriers still command 40.10% of the premiums, reflecting the enduring roles of government-run schemes in the United States, India, and China. However, public-private partnership models are advancing at a 12.32% CAGR as states transfer risk while retaining policy oversight. Private multiline insurers increasingly view agriculture as an uncorrelated risk pool, investing in InsurTech and data analytics to improve margins. Mutual and captive schemes cater to specialist producer groups such as wine grape cooperatives or greenhouse operators.
China’s “insurance + futures” architecture shows public leverage, enabling private capital to hedge exposures on commodity exchanges, tightening basis alignment between field loss and market value, with USD 18.8 billion already underwritten. In the United States, Zurich-owned RCIS wrote USD 3 billion in premiums in 2024 under the Standard Reinsurance Agreement, demonstrating a private appetite for state-sharing frameworks. Across Latin America, regulators now pilot quota-share treaties that entice global reinsurers to absorb local drought risk, blending public subsidy with market pricing discipline, thereby deepening the global crop insurance market.
By Crop Type:
Cereal dominance challenged by commercial-crop innovationIn 2025, cereals and grains accounted for 35.25% of the premium. Their dominance is bolstered by their high-calorie significance and established support programs, which ensure consistent demand and production stability. These crops remain a cornerstone of agricultural insurance due to their critical role in global food security. Meanwhile, commercial crops like cotton, sugarcane, and rubber are witnessing a 10.54% CAGR, driven by rising value per acre and the increasing adoption of precision agriculture technologies. These advancements are enabling farmers to optimize yields, improve profitability, and mitigate risks, further enhancing the attractiveness of these crops. Given their heightened perishability, fruits, and vegetables are increasingly turning to parametric frost and heat-stress covers to mitigate risks associated with extreme weather events. At the same time, oilseeds and pulses are reaping the benefits of surging demand for plant-based proteins as consumer preferences shift toward healthier and sustainable dietary options.
In 2025, the USDA expanded its Controlled Environment crop pilot to 48 counties, elevating coverage ceilings to 85% and introducing quarantine triggers. This initiative reflects a growing focus on addressing the unique challenges faced by specialty horticulture crops, such as disease outbreaks and climate variability. The program's expansion signals a significant opportunity for growth in specialty horticulture insurance, as it provides tailored solutions to meet the needs of high-value crop producers. Brazil’s National Supply Company forecasts a grain output of 322.3 million tons for 2025, marking an 8.2% increase compared to previous years. This projection highlights the urgent need for scalable, climate-responsive insurance solutions in South America, where agricultural production is increasingly vulnerable to climate change. Insurers are innovating with phenology-based parametric triggers, aligning them with critical growth stages of various crops. This approach boosts payout accuracy, and fosters trust among farmers in the global crop insurance landscape, as it ensures timely and fair compensation for losses incurred during key developmental phases of their crops.

By Farm Size:
Smallholder focus drives market democratization.Smallholders comprised 54.00% of the 2025 global premium, proving that subsidy-backed and mobile-enabled products are penetrating the largest farmer cohort. A CAGR of 8.55% through 2031 is expected as digital wallets, group policies, and NGO-brokered schemes ease enrolment barriers. Medium farms (2–10 ha) mix cost efficiency with agility, adopting blended covers that integrate revenue protection. Large farms pursue sophisticated hedging that combines insurance with futures and options to quarantine gross margins.
India's PMFBY program insures 25 million farmers, mainly smallholders, highlighting its scalability and impact on agricultural risk management. In Africa, the Weather Index-based Insurance for Smallholders program offers seasonal premiums of USD 2, coupled with agronomic SMS advice. This approach maintains affordability and boosts yields by providing timely guidance. With satellite analytics confirming weather triggers at the plot level, insurers are reducing minimum-acre thresholds. This move extends protection to microplots that were previously considered uninsurable, thereby broadening the global crop insurance market.
Geography Analysis
North America Crop Insurance Market
North America generated 45.10% of the 2025 premium, benefiting from the U.S. scheme that subsidizes roughly 60% of farmer premiums and covers more than 80% of cropland. Cumulative weather claims of USD 118.7 billion since 2001 underline escalating risk, prompting proposed legislation to raise subsidy ratios further and to include higher coverage tiers. Canada’s AgriInsurance and Mexico’s reforms are broadening index covers while growing drought frequency in the Great Plains is driving higher take-up of supplemental policies and deepening the crop insurance market.
APAC Crop Insurance Market
Asia-Pacific remains the fastest-growing region, with a 10.36% CAGR to 2031. India’s PMFBY reaches growers across 600 districts, and China’s county-level pilots bundle crop insurance with futures hedging worth USD 18.8 billion. Australia’s parametric drought covers now integrate Bureau of Meteorology data, bringing actuarial rigor to historically underinsured pastoral zones. Rising prosperity, digital distribution, and policy commitments place the global crop insurance market on a steep adoption curve across ASEAN members and South Asia.
Europe, South America and Africa Crop Insurance Market
Europe shows mid-single-digit growth potential within a mature regulatory context. CAP 2023-27 provisions earmark USD 19.1 million yearly for Dutch weather cover while allowing member states to lower income-loss triggers to 20%. Despite only 20-30% of weather losses being insured, rising heatwaves and flood events are catalyzing renewed interest in revenue-linked products. South America and Africa trail in absolute premium, yet strong commodity demand and multinational reinsurer entry point to accelerating coverage, particularly in Brazil, where grain output is forecast to rise 8.2% in 2025.

Competitive Landscape
The global crop insurance market remains moderately fragmented, though consolidation is advancing in data-rich regions. Chubb’s Rain and Hail subsidiary holds a very less percent of U.S. share, safeguarding 100 million acres, its dominance rooted in decades of plot-level yield data and award-winning claims technology. Zurich’s RCIS positions crop as a USD 3 billion premium line uncorrelated to property-cat losses, delivering diversification within its global portfolio. InsurTech entrants leverage AI and blockchain to streamline underwriting, pressuring traditional carriers to modernize the global crop insurance market.
Distribution consolidation gathered pace when Risk Strategies acquired Silveus, the largest independent broker, securing nationwide reach and predictive analytics capability. Reinsurers such as Swiss Re and Munich Re structure cat-bonds and quota-share treaties that seed capacity into emerging markets. Public-private partnerships expand as governments seek fiscal relief; insurers gain scale and access to subsidized pools, while farmers receive blended innovation and stability. Technology partnerships with ag-tech firms provide carriers with exclusive data, sharpening risk pricing and customer engagement.
Worldwide regulators are tightening standards on solvency, data privacy, and transparency. This pressure is forcing slower providers to either bolster their capital or exit the market. In Latin America and Africa, competition is heating up as established players face challenges from nimble micro-insurance start-ups, many of which are bolstered by venture capital. The key to success lies in harnessing analytics, adopting low-touch distribution methods, and securing dependable reinsurance. As a result, digital capabilities are becoming paramount for those aiming for leadership in the global crop insurance arena.
Crop Insurance Industry Leaders
PICC
Chubb Ltd.
QBE Insurance Group
Tokio Marine HCC
Zurich Insurance Group
- *Disclaimer: Major Players sorted in no particular order
Crop Insurance Market Companies Covered in this Report
- PICC
- Chubb Ltd.
- QBE Insurance Group
- Tokio Marine HCC
- Zurich Insurance Group
- Agriculture Insurance Co. of India (AIC)
- Fairfax Financial (Brit, Allied World)
- American Financial Group (Great American)
- ICICI Lombard
- Sompo Holdings
- Swiss Re Corporate Solutions
- AXA XL
- Munich Re
- Mapfre
- Farmers Mutual Hail Insurance Company
- GlobalAg Risk Solutions
- Agriculture Insurance Company of Kenya
- Agriculture Reinsurance Ltd.
- Grupo BrasilSeg

Recent Industry Developments in Crop Insurance Market
- May 2025: The European Commission proposed CAP simplification measures that raise lump-sum payment limits for small farms and introduce flexible risk-management tools, delivering USD 1.72 billion in annual farmer savings while boosting insurance uptake.
- February 2025: The USDA expanded the Controlled Environment pilot to 48 counties across 17 states, lifting coverage limits to 85% and adding quarantine protection for disease losses.
- January 2025: The USDA launched the Emergency Commodity Assistance Program with USD 10 billion to reimburse 85% of disaster losses, with payments capped at USD 250,000 per producer.
- May 2024: Risk Strategies closed the acquisition of Silveus Insurance Group, boosting crop distribution capabilities across 40 U.S. states.


Crop Insurance Market Report Scope and Research Methodology
Market Definition and Coverage
Our study defines the crop insurance market as all written premiums that protect growing or harvested crops against weather, pest, price, and revenue risks, whether the cover is subsidized or fully commercial, and whether it is indemnity-based or parametric. The value chain captured begins at policy issuance and runs through claim settlement, including government risk-sharing pools and reinsurer cessions, so revenues are recorded net of reinsurance yet gross of subsidies, an approach that lets us follow true insurer income.
Scope exclusion: livestock and forestry insurance premiums are intentionally left outside this scope to avoid double counting with separate Mordor titles.
Segments Covered in This Report
- By Insurance Type
- Multi-Peril Crop Insurance (MPCI)
- Actual Production History / Yield
- Revenue Protection
- Weather-index/Parametric
- Named-Peril (e.g., hail)
- By Risk Covered
- Sowing / Germination
- Standing-crop Loss
- Post-harvest Loss
- Localised Calamities
- Prevented Planting & Replant
- By Distribution Channel
- Banks & Ag-credit Institutions
- Direct (Insurer & Govt Portals)
- Brokers & Agents
- Digital Platforms & Mobile Apps
- By Provider Type
- Public / Government Insurers
- Private Insurers
- Public-Private Partnership (PPP)
- Mutual & Captive Schemes
- By Crop Type
- Cereals & Grains
- Oilseeds & Pulses
- Fruits & Vegetables
- Commercial Crops (Cotton, Sugarcane, etc.)
- Other Crops
- By Farm Size
- Smallholder (Less Than 2 ha)
- Medium (2-10 ha)
- Large (Greater Than 10 ha)
- By Geography
- North America
- United States
- Canada
- Mexico
- South America
- Brazil
- Argentina
- Rest of South America
- Europe
- Germany
- France
- United Kingdom
- Italy
- Spain
- Russia
- Rest of Europe
- Asia-Pacific
- China
- India
- Japan
- South Korea
- Australia & New Zealand
- Rest of Asia-Pacific
- Middle East & Africa
- UAE
- Saudi Arabia
- Turkey
- South Africa
- Nigeria
- Kenya
- Rest of Middle East & Africa
- North America
Data Sources, Market Sizing, and Validation
Primary Research
Discussions with underwriters, brokers, public scheme managers, and ag-fintech founders across North America, Europe, India, China, and Brazil helped us verify uptake rates, premium subsidies, loss-ratio norms, and emerging digital channels, filling data gaps flagged during secondary work.
Desk Research
Mordor analysts built the baseline using open datasets such as USDA-RMA program statistics, FAO crop loss files, Eurostat farm accountancy data, China's MARA yearbooks, and the World Bank's Climate Knowledge Portal, enriched by filings from leading underwriters and insight from D&B Hoovers, Dow Jones Factiva, and Questel patent pulls on parametric triggers. Trade association releases, central-bank exchange rates, and reputable press deepen context. The sources cited here are illustrative; many additional public references informed the model.
Market-Sizing & Forecasting
A top-down reconstruction from national premium volumes, acreage insured, and average premium rates set the 2025 base. Results are corroborated with selective bottom-up checks, sampled insurer financials, channel audits, and median ASP × hectares to fine-tune totals. Key variables include insured acreage share, multi-peril adoption, average subsidy intensity, climate-loss frequency, and digital distribution penetration. A multivariate regression aligns those drivers with historic premiums, and an ARIMA overlay picks up recent shocks before a scenario analysis adjusts for policy reforms. Where bottom-up samples miss, weighted regional proxies bridge the gap.
Data Validation & Update Cycle
Outputs pass two analyst reviews, variance tests against independent indicators, and a senior sign-off. The dataset refreshes each year, with interim updates if subsidy rules, extreme weather, or macrocurrency swings move the market.
How Mordor Intelligence's Crop Insurance Market Size Compares to Other Published Estimates
Published figures differ because firms adopt unique scopes and assumptions. Some track only MPCI lines or single regions; others freeze premium rates or overlook subsidy revisions.
Key gap drivers include omission of weather-index products, differing FX bases, update cadence, and whether public-private pools are consolidated with private books. Mordor's disciplined scope, annual refresh, and dual-path modeling minimize those mismatches.
Benchmark comparison
| Market Size | Anonymized source | Primary gap driver |
|---|---|---|
| USD 52.28 B (2025) | Mordor Intelligence | |
| USD 39.97 B (2025) | Global Consultancy A | Limited to 15 countries; excludes parametric covers |
| USD 46.10 B (2024) | Industry Journal B | Uses static yield factors, omits digital distribution growth |
| USD 43.31 B (2024) | Research Publisher C | Uniform premium rate, no currency normalization |
These contrasts show that Mordor's variable-driven, regularly refreshed approach delivers a balanced, transparent baseline clients can trust for planning and investment decisions.


Key Questions Answered in the Report
What is the current size of the global crop insurance market?
The global crop insurance market stands at USD 58.07 billion in 2026 and is on track to reach USD 98.26 billion by 2031 at an 11.07% CAGR.
Which region leads the global crop insurance market today?
North America leads the global crop insurance market with 45.10% revenue share in 2025, supported by the long-standing U.S. Federal Crop Insurance Program.
What product type holds the largest crop insurance market share?
Multi-peril crop insurance dominates the crop insurance market, capturing 47.10% of global premiums in 2025.
Why is the crop insurance market growing so quickly in Asia-Pacific?
Asia-Pacific’s crop insurance market is expanding at a 10.36% CAGR because India and China are scaling large, subsidized schemes that make coverage affordable for millions of smallholders.
How does digital technology influence the global crop insurance market?
Satellite imagery, IoT sensors, and AI-driven analytics reduce loss ratios and speed claims, enabling new parametric products that broaden the global crop insurance market to under-served farmers.
What challenges could slow the global crop insurance market?
Affordability gaps for marginal farmers, fraud risk, and data privacy concerns may temper growth, though public subsidies and remote-sensing advances are steadily addressing each obstacle.
Page last updated on:


