Embedded Insurance Market Size and Share
Market Overview
| Study Period | 2020 - 2031 |
|---|---|
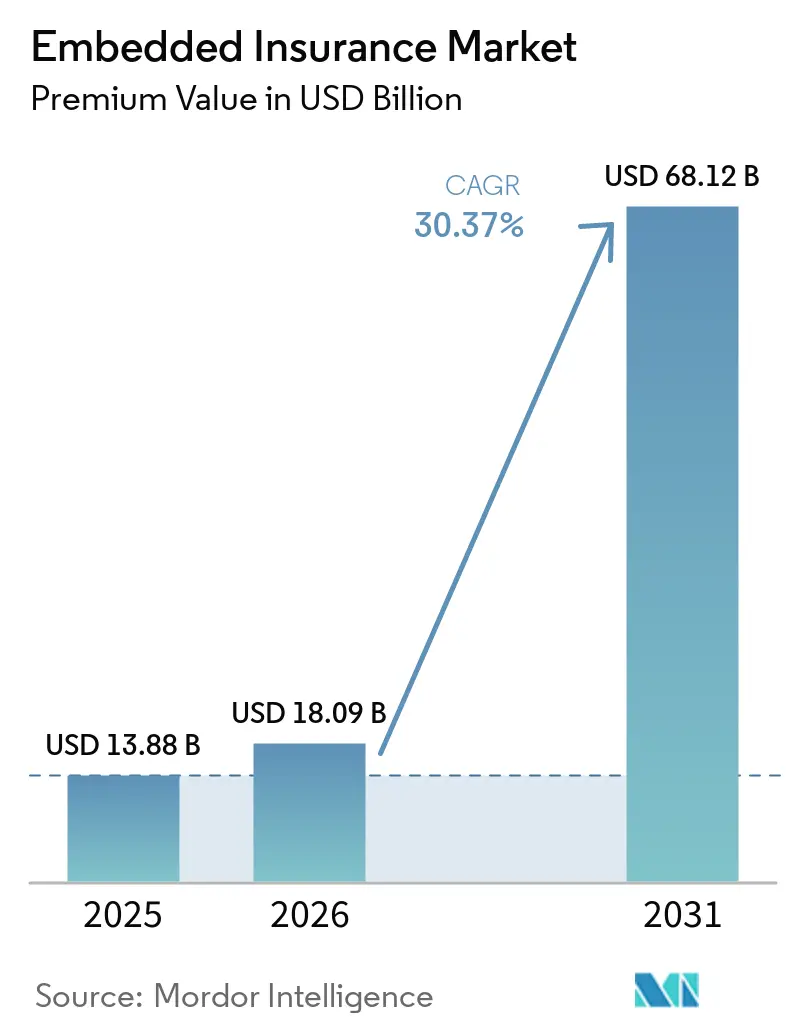
| Market Size (2026) | USD 18.09 Billion |
| Market Size (2031) | USD 68.12 Billion |
| Growth Rate (2026 - 2031) | 30.37% CAGR |
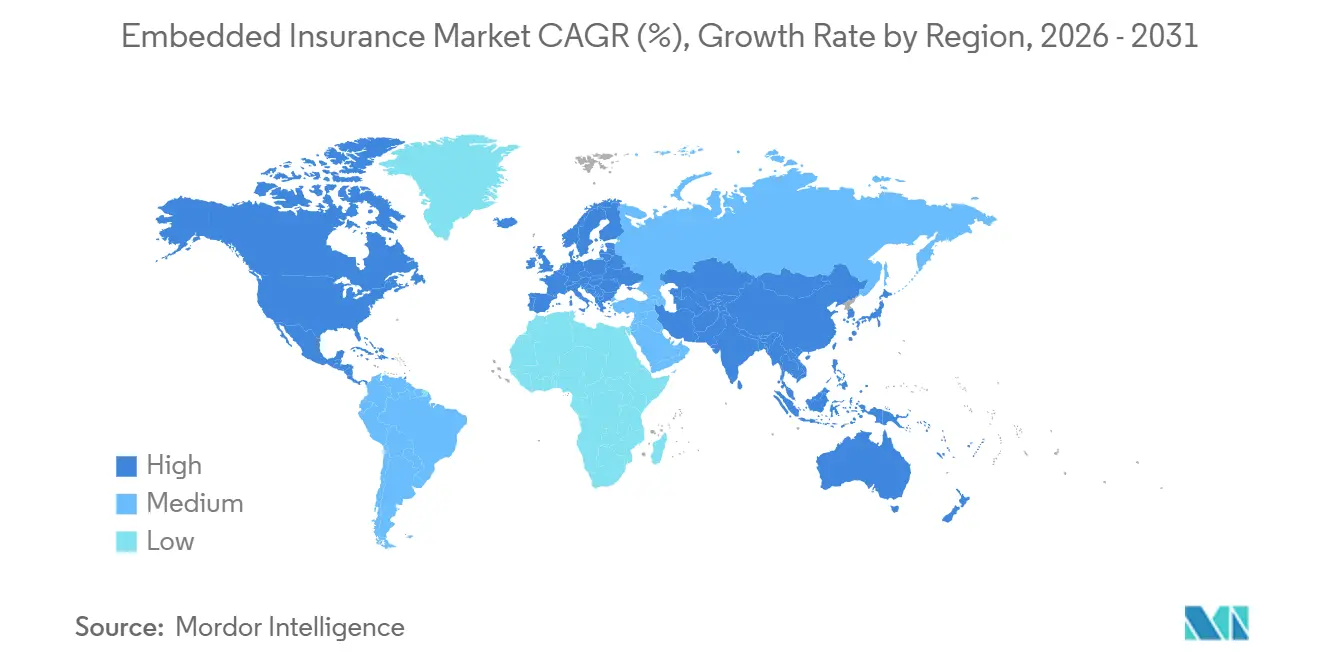
| Fastest Growing Market | Asia Pacific |
| Largest Market | North America |
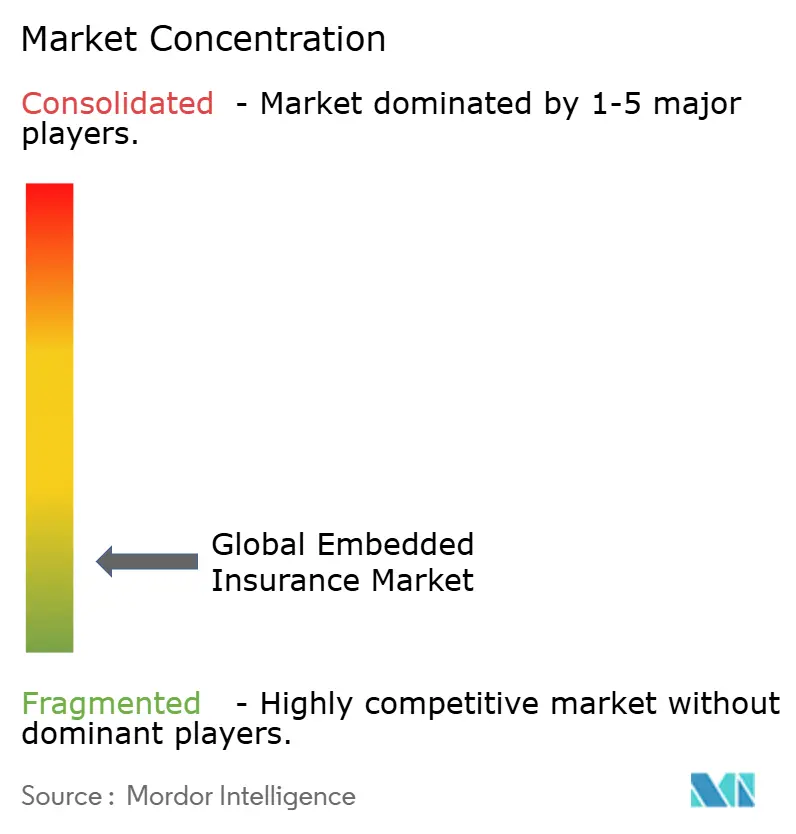
| Market Concentration | Low |
Major Players *Disclaimer: Major Players sorted in no particular order Image © Mordor Intelligence. Reuse requires attribution under CC BY 4.0. | |
Embedded Insurance Market Analysis by Mordor Intelligence
The Embedded Insurance Market size is expected to increase from USD 13.88 billion in 2025 to USD 18.09 billion in 2026 and reach USD 68.12 billion by 2031, growing at a CAGR of 30.37% over 2026-2031.
Momentum accelerates because API-first architectures shorten product-launch cycles, real-time data improves underwriting accuracy, and regulators encourage innovative channels that shrink protection gaps. Electronics protection remains the largest embedded insurance line, supported by checkout add-ons on global e-commerce sites, while usage-based micro-auto policies underpinned by connected-car data post the fastest growth. Online and API-first distribution leads with more than 76.38% revenue share, and marketplaces dominate end-user industries. Regionally, North America still commands the highest share, but Asia-Pacific is expanding the quickest as greenfield digital ecosystems take shape. Competitive intensity is moderate; incumbent carriers such as Chubb and Allianz Partners fight for partnership slots against API-centric insurtechs like Cover Genius and Bolttech, with regulatory know-how and integration agility emerging as key success factors.
Key Report Takeaways
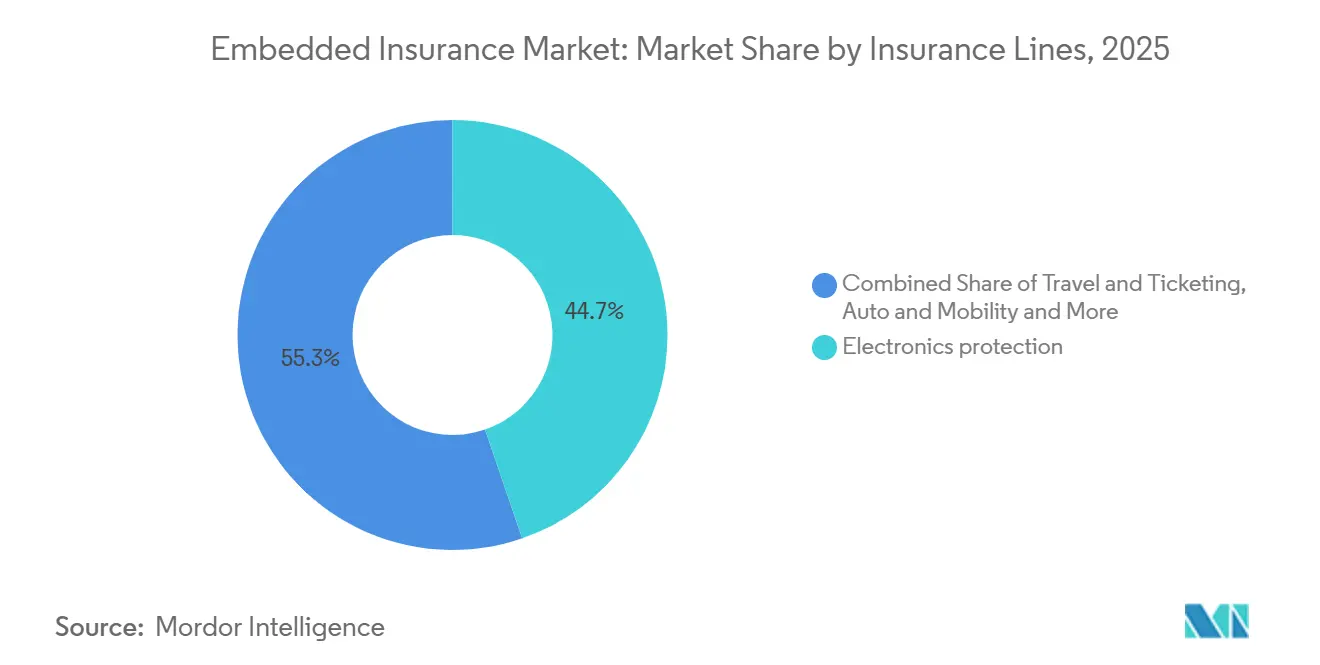
- By insurance line, electronics protection led with 44.74% market share in 2025, while IoT-driven micro auto insurance is projected to expand at a 33.87% CAGR through 2031.
- By distribution channel, online and API first placements captured 76.38% share in 2025, with the category advancing at a 23.35% CAGR through 2031.
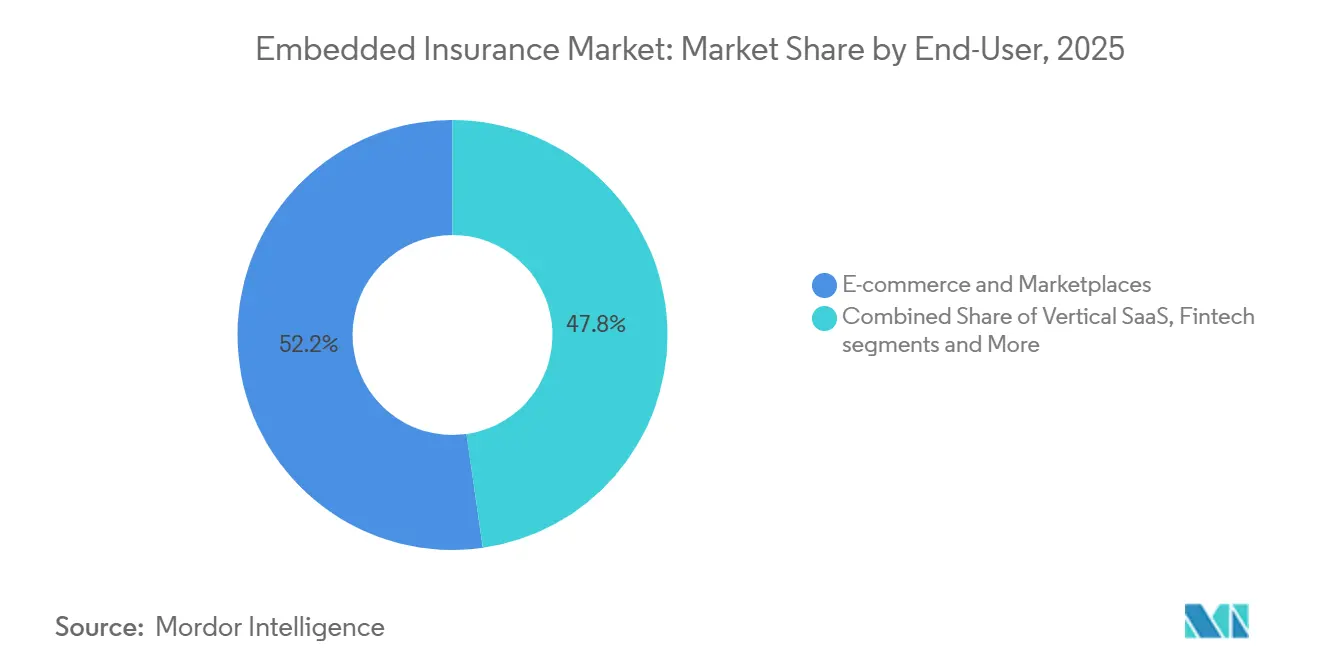
- By end user industry, e-commerce and marketplaces accounted for 52.24% in 2025, while mobility and automotive recorded the highest growth at a 28.36% CAGR through 2031.
- By partner platform type, marketplaces captured a 49.78% share in 2025, and vertical SaaS platforms are growing fastest at a 29.24% CAGR through 2031.
- By geography, North America led with 36.74% market share in 2025, while Asia Pacific is the fastest-growing region at a 19.37% CAGR through 2031.
Note: Market size and forecast figures in this report are generated using Mordor Intelligence’s proprietary estimation framework, updated with the latest available data and insights as of January 2026.
Global Embedded Insurance Market Trends and Insights
Drivers Impact Analysis*
| Driver | (~)% Impact on CAGR Forecast | Geographic Relevance | Impact Timeline |
|---|---|---|---|
| Seamless Digital Checkout | + 6.2% | Global, led by North America & EU (mature e-commerce penetration) | Short term (≤ 2 years) |
| Lower CAC via Embedded Distribution | + 5.8% | Global, with early gains in APAC (mobile-first markets) | Medium term (2-4 years) |
| Regulatory Push to Close Protection Gap | + 4.1% | Brazil, UK, UAE, Saudi Arabia | Medium term (2-4 years) |
| API‑First BigTech and Fintech Partnerships | + 7.3% | North America & APAC core, spill‑over to the EU | Short term (≤ 2 years) |
| Vertical SaaS Targeting SMBs | + 4.9% | North America, emerging in the EU | Long term (≥ 4 years) |
| Real-Time IoT Data for Micro‑Policies | + 5.4% | APAC, North America | Long term (≥ 4 years) |
| Source: Mordor Intelligence | |||


Seamless Digital Checkout Demand Surge
Embedded offers are becoming standard inside digital checkouts, which conditions buyers to accept protection when it is contextually paired with a transaction. Conversion performance improves when the offer is placed at the moment of need with pre-filled data, while pricing remains close to off-site equivalents and reduces cognitive load for the buyer. Retailers and marketplaces reinforce this pattern by treating protection as a core part of the product experience rather than an afterthought. Regulatory expectations around fair value and clear outcomes also help normalize embedded models by emphasizing transparency for add-on insurance. These changes reinforce how the embedded insurance market integrates into purchase flows where speed and simplicity drive adoption at scale. [1]Cover Genius, “The Embedded Insurance Report – A Consumer Focused Case for Transaction Based Offers from Banks, Neobanks and Fintechs,” Cover Genius, covergenius.com
Embedded Distribution Lowers CAC for Insurers
Customer acquisition costs fall when insurers embed directly into a host platform that already has verified users and transaction data. Dealers that present bindable quotes during vehicle purchase are seeing measurable financial gains, with one study showing a 20% lift in finance and insurance gross profit and a per-deal uplift when policies are bound in session. These results come from aligning the offer with the buyer’s timing and using platform data to streamline underwriting and payment steps. Renewal rates can improve as well when policies auto-renew through the platform’s billing rails. Together, these effects help the embedded insurance market accelerate policy conversion while reducing the reliance on high-cost advertising or agent commissions.[2]Polly, “Embedded Car Insurance Study 2025,” Polly, polly.co
Regulatory Push for Closing Protection Gap
Policymakers in multiple regions have prioritized data sharing, fair value, and open finance standards, which support embedded distribution and broaden access. European supervisors have set clear agendas on consumer outcomes and digital oversight, while regional initiatives in the Middle East and Africa are opening room for digital models that extend reach into underserved segments. These priorities align with the need to reduce underinsurance by allowing regulated data sharing and streamlined product approvals tied to sandbox programs. The net effect is to move protection closer to the point of need across commerce, mobility, and finance ecosystems. These steps collectively strengthen the enabling environment for the embedded insurance market in 2026.[3]European Insurance and Occupational Pensions Authority, “Revised Single Programming Document 2024 2026,” EIOPA, eiopa.europa.eu
API First Partnerships with BigTech and Fintechs
API first orchestration and modular product building now let carriers, MGAs, and platforms compose offers quickly across geographies. By mid-2025, 86 insurance carriers offered API-enabled products, yet adoption bifurcates between surface-level integrations (quote retrieval via API but manual underwriting) and full-stack automation (real-time bind, instant FNOL, parametric claims settlement). Case studies show how a single API can support tens of millions of users across numerous European markets for travel and purchase protection while preserving speed and compliance guardrails. The same approach extends to mobility and retail apps, where millisecond-level latency and localized terms are a prerequisite for adoption. These capabilities continue to expand the addressable canvas for the embedded insurance market as partnerships between insurers and platforms deepen.
Restraints Impact Analysis*
| Restraint | (~)% Impact on CAGR Forecast | Geographic Relevance | Impact Timeline |
|---|---|---|---|
| Fractured Multi-Jurisdiction Compliance | - 3.7% | Europe, MEA | Medium term (2-4 years) |
| Data Privacy and Consent Hurdles | - 2.9% | EU, Germany, France, California | Short term (≤ 2 years) |
| Channel Conflict with Agents and Aggregators | - 1.8% | North America, India | Medium term (2-4 years) |
| Sparse Actuarial History for Granular Cover | - 2.1% | National, APAC challenges | Long term (≥ 4 years) |
| Source: Mordor Intelligence | |||
Fractured, Multi-Jurisdiction Compliance Burden
Complex licensing regimes and non-uniform approvals stretch launch timelines and raise costs for cross-border rollouts. In Europe, firm-level supervision and country-specific rules often require partner-by-partner product approvals, even when coverage terms are standard. In parts of the Middle East and Africa, evolving frameworks require additional steps for digital distribution and embedded intermediaries. These layers slow the pace at which platforms can unify their offerings across markets and reduce the immediate scalability of new products. This fragmentation acts as a drag on the embedded insurance market because orchestration benefits are diluted by regulatory friction in multi-country launches.
Data Privacy and Consent Management Hurdles
Embedded flows depend on sharing data between the capacity provider and the platform, which makes privacy safeguards central to design. EU data protection rules and national interpretations in large member states set a high bar for consent clarity, auditability, and the right to explanation for automated decisions. These requirements add steps in the checkout and claims experience, and they require robust controls for model inputs when automation is used. Providers, therefore, invest in explicit data permissions and human-in-the-loop processes for sensitive cases. These compliance obligations increase complexity for the embedded insurance market, but they also support durable trust in digital channels when implemented well. [4]Insurance Europe, “Consumer Hub 2025,” Insurance Europe, insuranceeurope.eu
*Our forecasts treat driver/restraint impacts as directional, not additive. The impact forecasts reflect baseline growth, mix effects, and variable interactions.
Segment Analysis
By Insurance Line: Electronics Dominates, Yet Micro Auto Surges Fastest
Electronics protection captured 44.74% of the embedded insurance market share in 2025, reflecting stable demand at checkout for devices, appliances, and related add-ons across high-traffic retail and marketplace environments. Attach rates benefit from placement directly in the purchase flow and from simpler cover descriptions aligned to the item in the cart. Suppliers continue to invest in quality management and testing infrastructure to support certified pre-owned and refurbished channels, where warranties and protection plans are expected. Strategic expansions in automated device testing and diagnostics point to tighter links between hardware lifecycle management and embedded protection. These patterns anchor the largest revenue pool while setting up new forms of protection for longer product lifecycles and resale channels.
Micro auto cover is the fastest-growing line, powered by telematics and OEM-embedded journeys that integrate insurance into financing, ownership, and subscription workflows. These designs use connected vehicle data and platform billing rails to deliver policies that recalibrate in near real time, aligning price with usage and driving behavior. Automotive partners are also investing in claims and repair management capabilities to improve experience and speed, often coordinating with embedded assistance networks. Mobility-oriented expansions within large carriers support this shift by unifying product development, automation, and partner onboarding. These steps reinforce how auto linked coverage can scale within the embedded insurance market where vehicle data and financing journeys are already digitized.


By Distribution Channel: API Supremacy, Offline Retains Niche Authority
Online and API led distribution accounted for a 76.38% share of the embedded insurance market size in 2025, and it is advancing at a 23.35% CAGR to 2031 based on standardized integrations that reduce launch times and increase partner breadth. Single API orchestration platforms connect multiple carriers and geographies, enabling a partner to activate coverage in days or weeks with unified servicing. This approach benefits enterprises that need country-level compliance handled behind the scenes and a consistent customer experience across markets. Core system vendors also support API first deployments with low-code accelerators that reduce the time to integrate quoting, binding, and policy issuance. These capabilities underpin the leading role of digital channels in the embedded insurance market and expand the range of partners who can add protection natively.
Offline distribution retains relevance where trust-based conversations, high-value assets, and multi-party decisions are common. Auto dealerships illustrate how in-person advice and embedded quoting can work together when F&I software surfaces competitive rates at the right moment. Over time, these programs are digitizing workflows with kiosks and mobile portals while maintaining human support during complex decisions. Licensing and producer rules still apply to offline locations and determine who can present, discuss, and bind coverage at the point of sale. These guardrails keep offline channels meaningful for specific categories while online APIs remain the engine of scale for the embedded insurance market.
By End User Industry: E Commerce Peak, Mobility Fastest Climb
E-commerce and marketplaces accounted for a 52.24% share of the embedded insurance market size in 2025, reflecting high transaction volumes and the ability to tailor offers by SKU, basket value, and customer segment. In these settings, device, shipping, and purchase protection perform well when placement aligns with cart context and checkout design. Program data then feeds continuous optimization on placement, wording, and cover tiers, leading to sustained attachment gains. Retailers and OEM online stores also integrate protection into return and trade-in flows, where hardware inspections and diagnostics enable the right fit between warranty and device condition. These patterns keep e-commerce at the center of the embedded insurance market due to the combination of scale and controllable user journeys.
Mobility and automotive show the fastest growth trajectory at a 28.36% CAGR through 2031, fueled by connected vehicle data and OEM ownership experiences that accommodate dynamic pricing. Ride-hailing and delivery platforms are also embedding micro-duration accident and delay covers into trip flows with straightforward claims that depend on platform telemetry. Financial services channels continue to contribute to travel and purchase protection tied to subscription tiers, which demonstrates how insurance benefits can lift engagement and retention. Case studies in banking apps show how a single integration can serve users across dozens of countries with fast issuance and claims turnarounds. These channels together diversify growth in the embedded insurance market and reduce dependence on any single use case.
By Partner Platform Type: Marketplace Scale, Vertical SaaS Depth
Marketplaces captured 49.78% of 2025 partner platform revenue because a single API can support many sellers, categories, and countries within unified user experiences. This scale advantage extends across retail, mobility, and travel, where common checkout patterns allow standardized placement without bespoke flows for each merchant. Large platforms use orchestration layers to manage capacity, compliance, and post-purchase servicing at near real-time speeds. In addition, partners benefit from localized content and pricing while keeping a common integration. These attributes explain why marketplaces remain a primary engine of reach for the embedded insurance market.
Vertical SaaS platforms are growing fastest at a 29.24% CAGR as they embed coverage in operational dashboards that businesses use daily. This context allows for risk signals from work orders, payroll, or inventory to refine pricing and reduce friction at bind and renewal. Health, hospitality, construction, and professional services have seen early traction because policy needs to map closely to workflow events. Financial services and fintech stacks also integrate travel and purchase protection as tier benefits within subscription models. Together, these approaches deepen retention and lifetime value for the embedded insurance market by turning insurance into a background service that runs automatically.
Geography Analysis
North America held 36.74% of the embedded insurance market share in 2025, supported by API first infrastructure, scale digital distribution, and active partner ecosystems across commerce, mobility, and finance. United States dealerships illustrate how embedded quoting at the point of sale can lift finance and insurance metrics when customers finalize coverage during the vehicle transaction. Ecosystem partners continue to integrate at speed through standardized interfaces, which helps scale new product variants in months instead of years. In Canada, fintech partnerships are embedding subscription-based protection for growing customer bases inside digital banking ecosystems. These dynamics keep North America a core revenue base for the embedded insurance market, with room for growth as more platforms adopt orchestration layers.
Asia Pacific is the fastest-growing region at a 19.37% CAGR as super apps and mobile-first platforms embed micro policies into ride-hailing, payments, and commerce flows. Cross-border orchestration improves the speed of rollout by centralizing issuance and claims across multiple markets within a single integration. In India, sandbox frameworks and digital public infrastructure encourage embedded use cases that pair protection with everyday transactions. Southeast Asian platforms use trip and delivery telemetry to trigger bite-sized accident and delay covers that pay out quickly. These features make Asia Pacific a central growth engine for the embedded insurance market as mobile ecosystems scale.
Europe advances steadily on the back of neobanking, mobility, and retail platforms, though regulatory fragmentation requires country-specific plans and partner-level approvals in several markets. Supervisory priorities emphasize consumer value, data protection, and appropriate use of automation, which shape product design and disclosures. Partnerships between carriers and orchestration platforms are expanding to serve multi-line and multi-country programs through unified stacks. Latin America and the Middle East and Africa regions are ramping digital distribution as financial inclusion initiatives and new partnerships extend reach into underserved segments. These factors collectively broaden the global footprint of the embedded insurance market while regional compliance and localization shape the rollout pace.
Mordor Intelligence provides coverage of the embedded insurance market across other key regional markets, including Europe, each with their regulatory frameworks and demand patterns.

Competitive Landscape
Competition centers on orchestration platforms and API first intermediaries that connect players to digital distribution at scale. Technology layers standardize issuance, claims, and compliance across partners, enabling rapid deployment of protection into non-insurance ecosystems. Global orchestration platforms support embedded offers across many countries, categories, and languages with sub-second performance. This approach shifts the advantage toward firms that can combine capacity depth with modular technology and compliance coverage. These factors shape how leaders in the embedded insurance market expand through repeatable, partner-friendly integrations.
Partnerships and product expansions demonstrate how carriers and platforms are aligning around multi-country and multi-line offerings. New frameworks extend beyond single-line pilots to programmatic collaborations that support retail, mobility, and finance use cases. Examples in Europe show how platform partners and carriers expand from automotive into broader categories through unified APIs and standardized servicing. Investments in device diagnostics and automation also illustrate how supply chain improvements power better warranties and protection outcomes for consumers. These steps underline the role of technology and operating model design in scaling the embedded insurance market.
Capital and operating model moves continue to support embedded growth. Carriers are reorganizing lines of business and leadership to integrate mobility, assistance, and claims automation as embedded requirements expand. Reinsurance programs and capacity partnerships provide stability for fast-growing embedded books with automated claims flows. Health, travel, and purchase protection expansions are aligning with digital banks and fintech subscriptions to improve retention. These elements point to a competitive field where execution quality in APIs, compliance, and partner enablement determines share capture within the embedded insurance market.
Embedded Insurance Industry Leaders
Lemonade
Cover Genius
Bolttech
Qover
Assurant
- *Disclaimer: Major Players sorted in no particular order

Recent Industry Developments
- December 2025: Global insurtech bolttech completed the acquisition of mTek, a Nairobi-based digital insurance platform, expanding its embedded insurance and digital distribution footprint in East Africa and reinforcing its strategy for growth across emerging markets.
- November 2025: Allianz Partners announced a new range of international health insurance plans (Base, Enhanced, Signature) designed for expatriates, digital nomads, professionals, students, and families spending extended periods abroad, initially available in the EU and the United Kingdom, with plans to expand to other markets.
- June 2025: Insurtech bolttech successfully closed its Series C funding round, raising USD 147 million with strategic investors including Sumitomo Corporation and Iberis Capital, valuing the company at approximately USD 2.1 billion and supporting expansion of its embedded insurance offerings.
- April 2025: SECUTIX, a digital solutions provider for the event industry, partnered with Cover Genius to launch a new ticket protection solution that automates refund processes for venue and event businesses, boosting customer confidence and loyalty following a successful initial pilot at a major sporting event.


Research Methodology Framework and Report Scope
Market Definitions and Key Coverage
Our study defines the embedded insurance market as the dollar value of premiums sold invisibly inside a non-insurance transaction; think checkout screens on e-commerce sites or connected-car dashboards; counted at the first-year premium recognized by the underwriting carrier.
Scope Exclusion: For clarity, we exclude revenues from embedded payment, lending, or investment services.
Segmentation Overview
- By Insurance Line
- Electronics Protection
- Furniture & Home Appliances
- Sports & Leisure Equipment
- Travel & Ticketing
- Auto & Mobility
- Pet & Tuition
- Other Niche Lines
- By Distribution Channel
- Online (API / SDK)
- Offline (POS, Dealerships, Retail)
- By End-user Industry
- E-commerce & Marketplaces
- Mobility & Automotive OEMs
- Travel & Hospitality
- Consumer Electronics Retail
- Financial Services & Lending
- SaaS / Vertical Platforms
- By Partner-Platform Type
- Marketplaces
- Vertical SaaS
- Fintech / Neobank
- Telecom / Utilities Portals
- By Geography
- North America
- United States
- Canada
- Mexico
- South America
- Brazil
- Argentina
- Rest of South America
- Europe
- United Kingdom
- Germany
- France
- Italy
- Spain
- Rest of Europe
- Asia-Pacific
- China
- India
- Japan
- Australia
- Rest of Asia-Pacific
- Middle East & Africa
- United Arab Emirates
- Saudi Arabia
- South Africa
- Rest of Middle East & Africa
- North America
Detailed Research Methodology and Data Validation
Primary Research
Mordor analysts spoke with digital-bank executives, online-retail product managers, API platform founders, and actuarial heads across North America, Europe, and Asia-Pacific. These discussions refined take-up curves, typical revenue-share ratios, and renewal behavior; filling gaps left by public filings.
Desk Research
We begin with public datasets drawn from national insurance regulators, OECD insurance statistics, the Global Embedded Finance Association, and customs shipment records that flag new device lines likely to carry bundled cover. Company 10-Ks and broker presentations add volume indicators, while Dow Jones Factiva and D&B Hoovers surface partnership and funding signals that reveal uptake speed.
Next, patent libraries, peer-reviewed journals on digital distribution, and consultation papers from bodies such as EIOPA help us test early-stage trends, which are then mapped against analyst models. The sources named are illustrative; many others were consulted for data collection, validation, and clarification.
Market-Sizing & Forecasting
We apply a top-down build that starts with global non-life and travel premium pools, which are then filtered through penetration rates of checkout journeys able to host insurance APIs. Select bottom-up checks, namely sampled policy volume multiplied by average selling price drawn from leading marketplace partners, ground the totals. Key variables modeled include digital retail GMV share, connected-car parc growth, API adoption costs, regulatory sandbox approvals, and insurer revenue-share norms. A multivariate regression on these drivers projects demand to 2030, with scenario analysis flexing macro factors where consensus is thin.
Data Validation & Update Cycle
Our team runs outputs through variance gates versus reported carrier premiums and fintech revenue disclosures. Senior reviewers rework anomalies, and any ±5% deviation triggers re-contact with sources. Reports refresh annually, with interim patches for material events; a final analyst pass ensures clients receive the latest view.
Why Mordor's Embedded Insurance Baseline Earns Trust
Published estimates often diverge, and we find the gaps usually stem from scope breadth, refresh cadence, FX treatment, or untested growth assumptions.
Key gap drivers here include some studies folding broader embedded finance revenue into insurance totals, others applying uniform global penetration without platform-capacity checks, and several using longer refresh cycles that miss recent regulatory shifts.
Benchmark comparison
| Market Size | Anonymized source | Primary gap driver |
|---|---|---|
| USD 10.45 B (2025) | Mordor Intelligence | |
| USD 143.88 B (2025) | Global Consultancy A | Counts all premium generated by any embedded finance product and uses a single growth factor with a biennial refresh. |
| USD 116.05 B (2025) | Trade Journal B | Applies a broad revenue definition and assumes uniform global penetration without platform-capacity checks. |
These contrasts show that by narrowing scope to verified API-driven premiums and validating every assumption with industry actors, Mordor delivers a balanced, transparent baseline that decision-makers can confidently rely on.


Key Questions Answered in the Report
What is embedded insurance, and how does it work inside digital commerce?
Embedded insurance is coverage offered within a customer’s existing journey, such as a checkout or app workflow, using APIs to pre-fill data and bind policies in seconds without sending users off-site, which improves conversion and experience for buyers in the embedded insurance market.
What is the 2026 size and 2031 forecast for the embedded insurance sector?
The embedded insurance market size is USD 18.09 billion in 2026 and is projected to reach USD 68.12 billion by 2031 at a 30.37% CAGR, highlighting sustained demand for contextual protection across platforms.
Which segments are leading and which are scaling fastest?
Electronics protection leads by revenue share due to checkout placement, while micro auto insurance grows fastest on telematics and OEM integrations that enable dynamic pricing and seamless servicing in the embedded insurance market.
Which distribution approach delivers the most scale today?
Online and API first distribution leads by share and growth, supported by single API orchestration, modular product design, and low-code accelerators that reduce time to market for the embedded insurance market.
What regions are most important for near-term growth?
North America leads by current revenue, and Asia Pacific is the fastest-growing region due to mobile-first platforms and super apps embedding micro policies across ride-hailing, payments, and commerce.
What are the main compliance hurdles for embedded providers?
Multi-jurisdiction licensing and strict data privacy rules require country-specific product approvals and explicit consent management, which lengthen launch timelines but build durable consumer trust in the embedded insurance market.
Page last updated on:


