
Southeast Asia Advertising Market Size and Share
Market Overview
| Study Period | 2020 - 2031 |
|---|---|
| Forecast Data Period | 2026 - 2031 |
| Base Year Market Size (2025) | USD 28.34 Billion |
| Market Size (2026) | USD 32.46 Billion |
| Market Size (2031) | USD 63.89 Billion |
| Growth Rate (2026 - 2031) | 14.52 % |
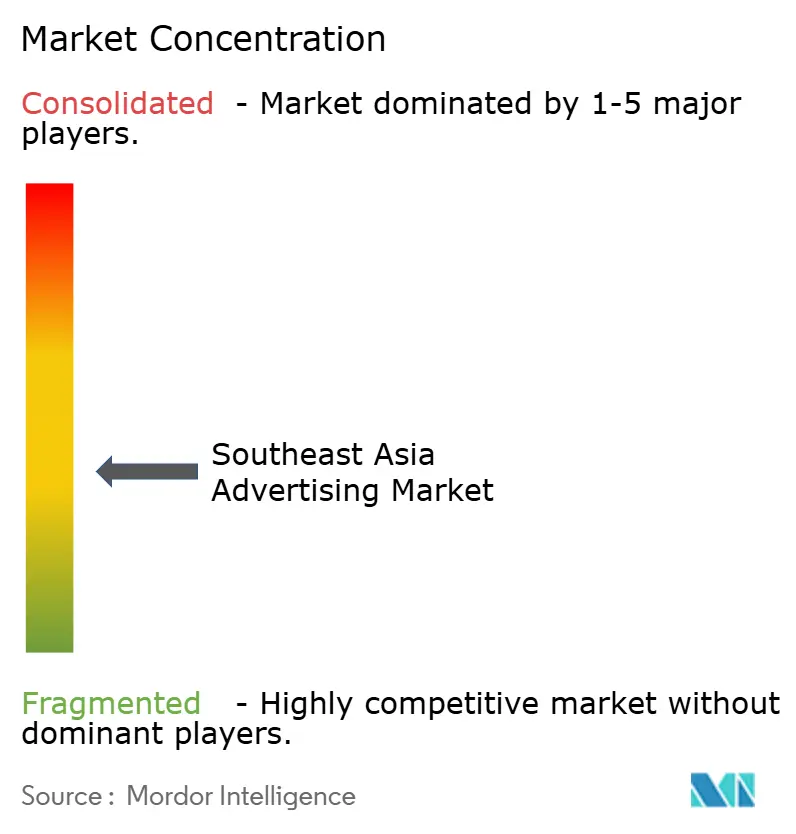
| Market Concentration | Medium |
Major Players *Disclaimer: Major Players sorted in no particular order Image © Mordor Intelligence. Reuse requires attribution under CC BY 4.0. | |
Southeast Asia Advertising Market Analysis by Mordor Intelligence
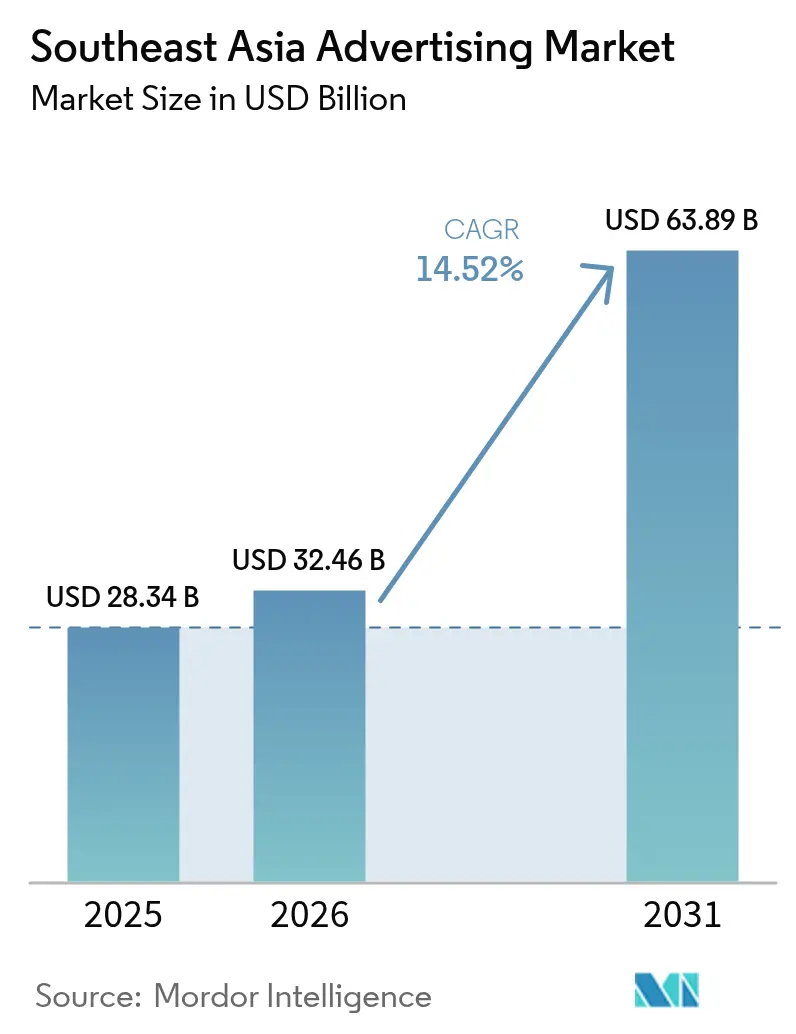
The South East Asia Advertising market size was valued at USD 28.34 billion in 2025 and estimated to grow from USD 32.46 billion in 2026 to reach USD 63.89 billion by 2031, at a CAGR of 14.52% during the forecast period (2026-2031). Revenue growth rides on rapid mobile-first digital adoption, AI-enabled campaign optimization, and government grants that help small businesses advertise online. While traditional channels still concentrate spending, the shift toward automated, data-rich formats is unmistakable, especially as monthly mobile data usage per smartphone is set to climb from 13 GB in 2023 to 59 GB by 2030.[1]GSMA, “The Mobile Economy Asia Pacific 2024,” GSMA.COM Super-app ecosystems, expanding retail media networks, and stronger measurement standards for Digital Out-of-Home (DOOH) are widening the channel mix and enhancing return on ad spend for brands across the region.
Key Report Takeaways
- By channel type, traditional media led with 60.12% revenue share of the Southeast Asia Advertising market in 2025, whereas digital media is projected to grow at 15.05% CAGR through 2031.
- By advertising medium, television held 29.35% of the Southeast Asia Advertising market share in 2025, while Digital Out-of-Home is advancing at a 15.72% CAGR to 2031.
- By transaction type, non-programmatic buying captured a 68.95% share of the Southeast Asia Advertising market in 2025; programmatic approaches record the fastest CAGR at 15.15% through 2031.
- By end-user industry, Fast-Moving Consumer Goods accounted for 28.74% of the Southeast Asia Advertising market size in 2025, but retail and e-commerce are forecast to expand at 15.62% CAGR to 2031.
- By country, Singapore commanded a 32.45% share of the Southeast Asia Advertising market in 2025, whereas Vietnam posts the highest projected CAGR at 15.9% through 2031.
Note: Market size and forecast figures in this report are generated using Mordor Intelligence’s proprietary estimation framework, updated with the latest available data and insights as of 2026.
Market Trends and Insights
Drivers Impact Analysis of Southeast Asia Advertising Market*
| Driver | (~) % Impact on CAGR Forecast | Geographic Relevance | Impact Timeline |
|---|---|---|---|
| Rising mobile broadband penetration | +3.2% | APAC core, strongest in Vietnam, Indonesia | Medium term (2-4 years) |
| Accelerated uptake of programmatic DOOH | +2.8% | Singapore, Malaysia, Thailand urban centers | Short term (≤ 2 years) |
| Government-led digital-first SME incentives | +2.1% | Singapore, Malaysia, Indonesia, Philippines | Long term (≥ 4 years) |
| AI-driven dynamic creative optimization | +1.9% | Global, early adoption in Singapore, Thailand | Medium term (2-4 years) |
| Super-app advertising ecosystems | +2.4% | Indonesia, Singapore, Malaysia, Thailand | Short term (≤ 2 years) |
| Cross-border e-commerce boom | +2.6% | Regional, concentrated in major cities | Medium term (2-4 years) |
| Source: Mordor Intelligence | |||
Rising Mobile Broadband Penetration
Mobile connectivity is redefining ad reach across the Southeast Asia Advertising market. GSMA projects that monthly data usage will surge more than fourfold by 2030, opening space for high-bit-rate video and immersive formats that were previously bandwidth-constrained. With Indonesia’s fixed broadband penetration below 20%, mobile is the default digital gateway, prompting advertisers to adopt location-based targeting and video-first creative. Faster speeds also enrich the data available to programmatic platforms, turning real-time engagement metrics into the primary mechanism for buying and optimizing inventory.
Accelerated Uptake of Programmatic DOOH
Digital billboards now stream dynamic ads shaped by live weather or traffic feeds. A July 2024 deal between Moving Walls and GroupM gave Malaysian buyers verified DOOH inventory, mitigating historical viewability doubts.[2]Moving Walls, “GroupM Partnership for Verifiable DOOH in Malaysia,” MOVINGWALLS.COM In dense Singapore and Bangkok, algorithmic scheduling lets brands rotate creative by daypart, congested routes, or in-market behaviors pulled from mobile devices. Standard-setting bodies such as the Open Measurement in Out-of-Home Group released open-source impression frameworks, bringing the accountability that advertisers expect from online channels.
Government-Led Digital-First SME Incentives
Policy pushes are turning traditional mom-and-pop stores into online advertisers. Singapore’s SMEs Go Digital has enrolled 30,000 companies in starter tech packs. Indonesia’s MSMEs Go Digital crossed 9.2 million firms, each now pursuing search, social, or marketplace ads to win customers in crowded e-commerce ecosystems. Cash-grant programs in Malaysia and ASEAN-wide training from Go Digital ASEAN accelerate onboarding and create a snowball effect in ad spend, because every digitized merchant must build online visibility to survive.
AI-Driven Dynamic Creative Optimization
Regional adopters such as FreakOut employ predictive algorithms that swap imagery, calls-to-action, or language variants in milliseconds, raising click-through rates while shrinking production cycles. Vietnam’s 89% enterprise AI adoption rate signals a receptive environment. As South East Asia hosts dozens of ethnicities and languages, AI’s ability to localize at scale is invaluable, allowing a single campaign shell to deliver culturally tuned iterations without manual editing. Real-time performance feedback loops further let buyers fine-tune bids and placements.
Restraints Impact Analysis of Southeast Asia Advertising Market*
| Restraint | (~) % Impact on CAGR Forecast | Geographic Relevance | Impact Timeline |
|---|---|---|---|
| High fragmentation of publisher inventory | -1.8% | Malaysia, Indonesia, Philippines rural areas | Medium term (2-4 years) |
| Opaque agency rebate practices | -1.4% | Regional, strongest in Singapore, Thailand | Short term (≤ 2 years) |
| Stringent personal-data regulations | -2.1% | Singapore, Malaysia, Thailand, Indonesia | Long term (≥ 4 years) |
| Limited measurement standards for DOOH | -1.2% | Urban centers across region | Short term (≤ 2 years) |
| Source: Mordor Intelligence | |||
High Fragmentation of Publisher Inventory
Malaysia counts more than 300 billboard owners, forcing buyers to stitch together campaigns piecemeal.[3]CtrlShift, “AMP Marketplace Launch,” CTRLSHIFT.COM CtrlShift’s AMP marketplace now aggregates inventory from seven major publishers, but scale remains limited. Smaller digital publishers across Indonesia and the Philippines compound the problem, lacking common ad-tech stacks or transparency in pricing. Fragmentation raises transaction costs, deters new entrants, and slows the growth trajectory of programmatic spend within the Southeast Asia Advertising market.
Opaque Agency Rebate Practices
Regulatory probes in neighboring India uncovered rebate and price-collusion issues at global holding groups, spurring brand-side calls for stricter audits. In Southeast Asia, rebate secrecy undermines media efficiency, nudging some advertisers toward in-house trading desks. Heightened compliance duties under local Personal Data Protection Acts add complexity and increase liability for agencies that cannot demonstrate transparent data handling.
*Our forecasts treat driver/restraint impacts as directional, not additive. The impact forecasts reflect baseline growth, mix effects, and variable interactions.
Southeast Asia Advertising Market Segment Analysis
By Channel Type:
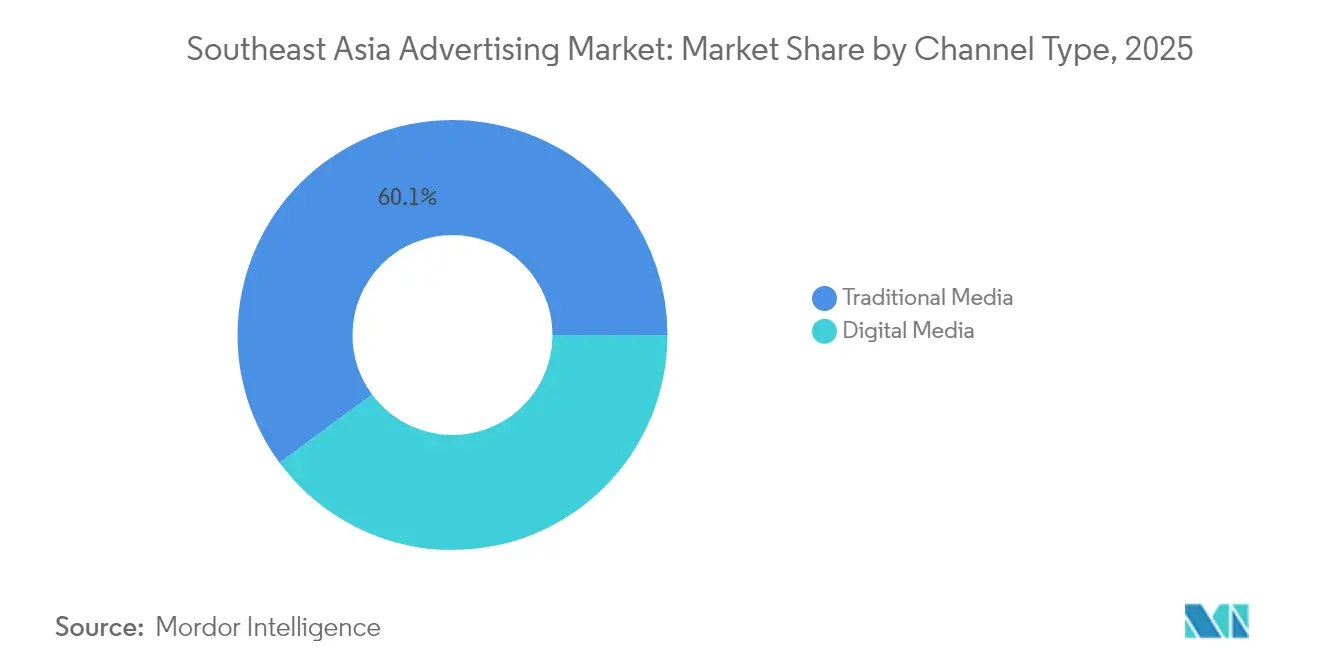
Digital Acceleration Reshapes Traditional DominanceTraditional channels retained a 60.12% share of the South East Asia Advertising market in 2025, buoyed by entrenched TV viewership among rural and older audiences. Yet the segment’s modest growth contrasts with digital media’s 15.05% CAGR, signaling an irreversible consumption pivot fueled by smartphones and cheaper data plans. Rapid gains stem from programmatic buying efficiencies and granular targeting that television or print cannot match. Thailand marked a pivotal moment in 2024 when digital ad spend surpassed TV, taking 45% versus 35%, underlining consumer migration to online video and social feeds.
Digital’s advance is accelerated further by cross-border e-commerce campaigns demanding real-time localization, a capability only algorithmic channels can deliver. Meanwhile, cinema and classic outdoor formats remain relevant in dense metros, where premium audiences value immersive, brand-safe settings. Still, the differential in performance metrics, attribution, and audience data tilts budgets heavily toward digital, reinforcing a feedback loop that reshapes the spending mix of the Southeast Asia Advertising market over the forecast period.



By Advertising Medium:
Television Dominance Faces DOOH DisruptionTelevision’s 29.35% stake in 2025 still positions it as the most lucrative single medium, reflecting both legacy habit and mass-reach efficiency. However, Digital Out-of-Home exhibits the highest trajectory at 15.72% CAGR, aided by falling screen costs, 5G connectivity, and standardized impression counting frameworks. Advertisers appreciate DOOH’s ability to refresh creative by daypart or trigger ads based on localized stimuli such as weather or traffic congestion.
Traditional print and radio keep niche appeal, newspaper inserts among older readers, and commuter-time radio ads on high-congestion routes, but their share contracts as measurement gaps widen. Cinema capitalizes on blockbuster releases for premium placements, yet venue capacity caps growth. Digital advertising covering search, social, display, and OTT video continues to siphon dollars from broadcast budgets, riding on better attribution models and AI-enhanced creative testing that optimize in-flight performance for brands across the Southeast Asia Advertising market.
By Transaction Type:
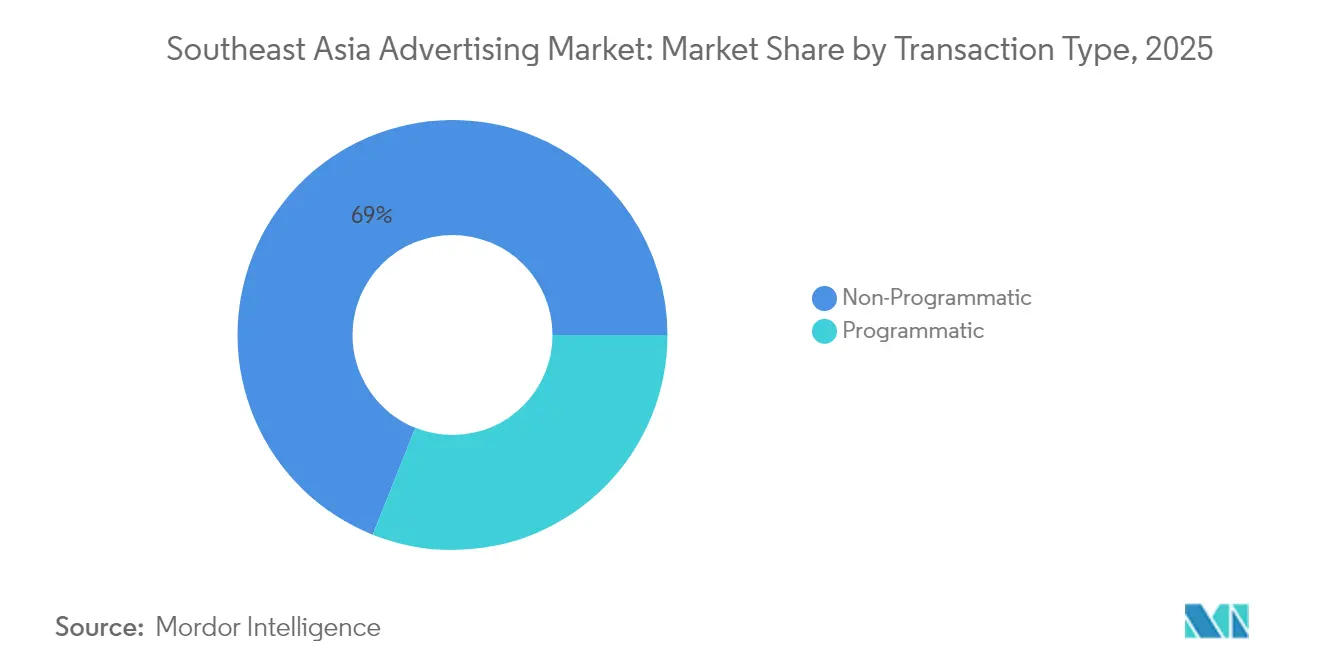
Programmatic Revolution AcceleratesNon-programmatic deals held 68.95% of 2025 spend, sustained by direct relationships and premium sponsorship packages that emphasize human negotiation. Nonetheless, programmatic trading’s 15.15% CAGR signals rapid automation of the Southeast Asia Advertising market. The model’s appeal lies in efficiency gains, precise audience overlays, and dynamic pricing. Private marketplaces and header-bidding setups bridge the gap for cautious brands, allowing real-time bidding while preserving brand safety.
FreakOut’s June 2024 integration of predictive AI into its exchange showcases the layering of machine learning onto bidding engines, enabling creatives to morph in sync with audience sentiment. DOOH is the newest frontier; algorithmic scheduling now optimizes billboard inventory similar to online display, adjusting in seconds instead of days. As more publishers onboard supply-side platforms, the share of automated deals will expand, slowly shrinking the manual insertion order market.
By End-User Industry:
FMCG Leadership Yields to Retail InnovationFast-moving Consumer Goods dominated with 28.74% of the Southeast Asia Advertising market size in 2025, relying on continuous brand-building and impulse-purchase reinforcement. Yet retail and e-commerce’s 15.62% CAGR points to a structural pivot. Marketplace operators are transforming into media sellers, carving out self-serve dashboards where merchants bid for shelf-space-like ad inventory. Shopee’s GMV heft intensifies this phenomenon, while TikTok Shop recorded USD 4.4 billion GMV in 2024, blending content and commerce in one scroll.
Automotive, BFSI, and Telecom maintain healthy spends tied to product launches and service renewals, and Healthcare benefits from aging populations and rising preventive care messaging. Travel advertising rebounds post-pandemic, targeting pent-up wanderlust through mobile-first video journeys. Across categories, AI-driven personalization increases relevance, allowing smaller budgets to punch above their weight in the Southeast Asia Advertising industry.
Geography Analysis
Singapore Advertising Market
Singapore’s dominance is anchored in its 32.45% share of the Southeast Asia Advertising market revenue, a position reinforced by advanced ad-tech stacks and a regulatory framework that codifies data-handling standards under the Personal Data Protection Act. Urban density ensures near-instant audience aggregation for DOOH screens, while SMEs Go Digital funnels new local advertisers online. Multinational agencies cluster here, streamlining cross-border media orchestration for campaign rollouts across ASEAN.
Vietnam Advertising Market
Vietnam, growing at 15.9% CAGR, leverages rising middle-class disposable income and nationwide 4G/5G upgrades. Government pushes to digitize SMEs, and high AI adoption rates allow even regional banks and CPG firms to test predictive-creative formats at scale. The market’s youthful demographics embrace short-form video and live commerce, nudging budgets from display banners to interactive streaming.
ASEAN Advertising Market
Indonesia, Thailand, Malaysia, and the Philippines collectively account for a sizable portion of the Southeast Asia Advertising market. Indonesia’s geographic sprawl challenges national targeting, but super-app ecosystems help advertisers zero in on provincial clusters. Thailand’s inflection point digital spend surpassing TV recalibrates media mixes, while Malaysia grapples with fragmented inventory yet benefits from standardized DOOH metrics through GroupM-Moving Walls collaboration. The Philippines taps its English-speaking talent pool to export creative services, feeding an upward cycle of domestic expertise and ad tech innovation. Secondary markets such as Cambodia and Laos remain nascent but could scale rapidly once basic infrastructure milestones are met.
Regulatory Landscape
Regulation across Southeast Asia is tightening around advertiser verification, platform accountability, and rapid takedowns, which increases compliance requirements for digital platforms, agencies, and ad-tech intermediaries. In Thailand, the Electronic Transactions Commission Notification No. 2 (published 5 May 2026) mandates identity verification for all social media advertisers, with implementation effective 1 November 2026 and defined data-retention duties for platforms.
Vietnam has strengthened oversight of online advertising operations via Decree No. 342/2025/ND-CP (effective 15 February 2026). The regulation requires online advertising service providers to notify the Ministry of Culture, Sports and Tourism and execute illegal-advertisement takedowns within 24 hours upon authority request, with technical blocking measures available for non-compliance. Malaysia has also moved toward mandatory checks through the Risk Mitigation Code under the Online Safety Act 2025, effective 1 June 2026 for large social media platforms, while self-regulatory standards such as Advertising Standards Malaysia's Code of Advertising Practice continue to shape acceptable advertising conduct alongside country PDPA variants.
Value Chain Analysis
The Southeast Asia advertising value chain begins with advertisers (local SMEs through multinationals), who brief agency holding groups (such as Dentsu and GroupM) and independents for strategy, creative, and media planning. Execution increasingly routes through platform and ad-tech layers, including demand-side platforms, ad exchanges, and retail media or super-app ad stacks (for example, GrabAds) for targeting and optimization. Publishers and inventory owners span TV networks, digital publishers, streaming services (for example, Viu and Vidio), and OOH or DOOH operators, while measurement and verification vendors connect campaign delivery to attribution and performance reporting. As programmatic expands, cross-platform identity and viewability standards are becoming more prominent in downstream governance.
Regulation and infrastructure also influence how value is captured across the chain. In Vietnam, Decree 342/2025/ND-CP (effective February 2026) adds obligations such as notifying the Ministry of Culture, Sports and Tourism and maintaining ad display histories. In Thailand, the ETC measures (May 2026) push pre-publication advertiser identity verification on social media platforms, adding friction and compliance costs for onboarding and campaign trafficking. Localization bottlenecks also persist, including multilingual creative and subtitling or dubbing needs, along with uneven network quality outside top metros. These factors affect video and CTV delivery consistency and reinforce the need for local production, brand-safety controls, and resilient ad-ops workflows across fragmented national markets.
Competitive Landscape
The Southeast Asia Advertising market is moderately fragmented, with holding companies Dentsu, GroupM, Omnicom, Publicis, and Havas maintaining a broad service moat yet losing exclusivity as region-native independents and tech platforms expand. These incumbents still command high-value brand mandates, integrating TV planning with social, search, and DOOH. However, transparency concerns over rebates spur some multinationals to demand third-party audits or experiment with in-house buying units.
Super-apps such as Grab and Gojek complicate the ecosystem by offering advertisers closed-loop data spanning ride-hailing, payments, and delivery, potentially bypassing traditional agencies. Retail media networks on Shopee or Lazada similarly sell performance-based placements that capture spend once reserved for display or search. Agencies are increasingly integrating AI-driven tools into their campaign planning to maintain a competitive edge. For instance, FreakOut has partnered with Neurons to utilize neuroanalytics for predicting attention hotspots. Meanwhile, GroupM's DOOH verification platform is elevating accountability and performance tracking by incorporating web-style metrics into digital billboards.[4]FreakOut, “Partnership with Neurons,” FREAKOUT.COM Mid-tier players focus on publisher aggregation, cross-language creative, and first-party data compliance to differentiate.
Looking ahead, the winners will be firms that combine automation, measurable outcomes, and privacy-ready data models. Consolidation is likely among small outdoor owners and boutique digital shops seeking scale. Yet regulatory tightening on personal data and the need for multilingual content keep entry barriers high, underscoring why expanded capabilities rather than mere price competition will define leadership in the Southeast Asia Advertising market.
Southeast Asia Advertising Industry Leaders
Dentsu International Asia Pte. Ltd.
GroupM Asia Pacific Holdings Ltd.
Omnicom Media Group Asia Pacific Pte. Ltd.
Publicis Groupe SA
Havas Media Asia Pacific Pte. Ltd.
- *Disclaimer: Major Players sorted in no particular order
Southeast Asia Advertising Market Companies Covered in this Report
- Dentsu International Asia Pte. Ltd.
- GroupM Asia Pacific Holdings Ltd.
- Omnicom Media Group Asia Pacific Pte. Ltd.
- Publicis Groupe SA
- Havas Media Asia Pacific Pte. Ltd.
- IPG Mediabrands Singapore Pte. Ltd.
- JCDecaux Singapore Pte. Ltd.
- Clear Channel Singapore Pte. Ltd.
- XCO Media Pte. Ltd.
- Mediacorp OOH Media Pte. Ltd.
- Moove Media Pte. Ltd.
- SPH Media Limited (SPHMBO)
- Moving Walls Sdn. Bhd.
- Spectrum Outdoor Sdn. Bhd.
- TAC Media Sdn. Bhd.
- VGI Global Media Public Co. Ltd.
- Sea Digital Media Pte. Ltd.
- AdColony (Digital Turbine Singapore Pte. Ltd.)
- GrabAds Holdings Pte. Ltd.
- Gojek Ads (PT Dompet Anak Bangsa)
- Kantar Media Singapore Pte. Ltd.
- Innity Corporation Berhad

Market Opportunities and Future Outlook
Commerce-led media is creating a monetization lane across Southeast Asia as super-apps and marketplaces convert transaction data into addressable audiences and support closed-loop measurement. The market already reflects investment toward this direction, including Grab's launch of GrabAds Enterprise in May 2025 and GroupM's May 2026 expansion of a partnership with GrabAds to incorporate geo-based audience insights for advertisers, which supports more granular targeting and outcome reporting for both brands and merchants.
A second opportunity area is privacy-ready identity, verification, and governance tooling as governments move from broad guidelines to prescriptive enforcement. Vietnam's Decree 342/2025/ND-CP (effective 15 February 2026) and Thailand's ETC Notification No. 2 (published 5 May 2026, effective 1 November 2026) formalize fast takedown requirements and advertiser identity verification. That raises demand for integrated KYC, ad-archive logging, and rapid response processes that can be deployed across agencies, platforms, and ad-tech vendors. In parallel, the streaming and CTV ad ecosystem is widening the premium video inventory pool as ad-supported strategies gain importance among regional streaming services, encouraging buyers to connect video creative supply, localization, and cross-screen measurement into a more unified planning and attribution layer.
Recent Industry Developments in Southeast Asia Advertising Market
- July 2026: Publicis Groupe announced the acquisition of Hepmil Media Group, a Southeast Asia-focused influencer content and social agency group. The deal strengthens Publicis' creator and social commerce execution across key ASEAN markets and adds scaled influencer production capabilities to complement performance and data-led media services.
- May 2026: WPP's GroupM expanded its partnership with GrabAds to use retail media capabilities and geo-based audience insights for advertisers across Southeast Asia. The move deepens access to closed-loop signals from a super-app ecosystem, supporting more measurable campaigns for categories such as retail, e-commerce, and FMCG.
- May 2025: GroupM entered a strategic partnership with Etaily to offer integrated commerce management solutions in Southeast Asia, starting with pilots in the Philippines. The collaboration links commerce operations with media activation, helping brands align marketplace execution with advertising performance across the region.


Southeast Asia Advertising Market Report Scope and Research Methodology
Market Definition and Coverage
For this methodology, the market is the total value of paid advertising spend delivered in Southeast Asia across major media, capturing what advertisers pay to reach audiences through measurable placements.
Scope exclusions: We exclude non-media marketing spends such as public relations retainers, event sponsorship activation fees, and in-house creative labor that is not purchased as paid media.
Segments Covered in This Report
- By Channel Type
- Traditional Media
- Digital Media
- By Advertising Medium
- Television
- Digital Advertising
- Radio
- Cinema
- Out-of-Home (OOH)
- Digital OOH (DOOH)
- By Transaction Type
- Programmatic
- Non-Programmatic
- By End-User Industry
- Fast-Moving Consumer Goods (FMCG)
- Retail and E-commerce
- Automotive
- BFSI
- Telecom and IT
- Healthcare and Pharma
- Travel and Tourism
- Other End-User Industries
- By Country
- Singapore
- Malaysia
- Indonesia
- Thailand
- Vietnam
- Philippines
- Other Countries (Cambodia, Laos, Myanmar, Brunei, Timor-Leste)
Data Sources, Market Sizing, and Validation
Desk Research
Desk work starts by mapping the ad economy in Southeast Asia, then anchoring it in public series that tend to be repeatable year to year. We use sources such as national statistics offices and central banks for macro baselines, ministries of communications and telecom regulators for connectivity and digital adoption indicators, and trade and customs releases where equipment signals are relevant to out-of-home activity. To keep definitions consistent, we also review public guidance from standards bodies and industry groups such as IAB-aligned measurement notes and local advertising associations where available.
After that, we read what advertisers and media owners disclose in public documents like annual reports, press releases, and investor presentations, and we capture notable policy shifts that can move spend between channels. A paid subscription set is used selectively for company financials and intelligence, plus a news and financials feed for deal and campaign signals, so the model is not built from a single storyline. These desk research sources are illustrative only, and many other public references were also checked to collect data, validate assumptions, and clarify open questions.
Primary Interviews and Surveys
Primary work focuses on validating what is counted as advertising revenue in each channel, and on pressure-testing our split assumptions across countries where media maturity differs. We spoke with agencies, media owners, ad-tech and platform-side specialists, and brand-side budget holders, then used follow-up checks to confirm timing effects such as election cycles and retail peaks. Since this is a regional market, inputs were balanced across key Southeast Asian countries and then reconciled to a consistent set of definitions.
Distribution of primary research fieldwork respondents
| Company type | Respondent position |
|---|---|
| Top tier: 35% | CXOs: 15% |
| Mid tier: 45% | Functional/Unit leaders: 32% |
| Smaller Players: 20% | Managers: 53% |
Market-Sizing & Forecasting
Sizing starts with a top-down build where total ad spend is reconstructed by medium and by transaction type, then tied back to a realistic demand pool using public media and digital adoption signals. What matters most is that the same definitions are applied across Southeast Asia, even when country reporting differs, and that is where structured interview inputs help.
To keep the totals grounded, we corroborate the results with selective bottom-up approximations such as sampled advertiser budget splits, channel checks on rate-card movement, and spot checks of agency and media-owner revenue disclosures where available. The model uses market-specific inputs like digital penetration and time spent trends, programmatic share progression, CPM and inventory pressure in video and social formats, out-of-home utilization indicators in large metros, and seasonal spend spikes around major retail and holiday periods. When bottom-up views are incomplete in smaller markets, we handle the gaps through peer-country proxies that are adjusted for GDP mix, internet usage, and media pricing differences.
For forecasting, scenario analysis is used with a base case aligned to what interviewees expect for budget growth, media mix shift, and programmatic adoption over the next few years. Growth rates are then stress-tested against macro conditions and channel-level constraints so the final trajectory remains plausible in stronger and weaker ad cycles.
Data Validation & Update Cycle
Validation is done through repeated cross-checks, first by comparing the model outputs against independent signals such as channel mix trends, disclosed revenue direction, and known step-changes in policy or measurement. Large variances are flagged, investigated, and corrected only after the underlying driver is identified, and a second analyst review is completed before sign-off.
Reports are refreshed annually, and interim updates are made when material events can shift spending patterns, for example major regulatory actions or sharp macro turns. Right before delivery, a final pass is completed so clients receive the most current view using the latest available inputs and confirmed assumptions.
Mordor Intelligence's Southeast Asia Advertising Market Size Measured Against Other Published Estimates
Published numbers for Southeast Asia advertising do not always match because boundaries can shift quietly, particularly around what gets counted as advertising versus adjacent marketing services, and whether digital is treated as a subset or the full market. Differences can also come from the year used for currency conversion, the treatment of programmatic fees, and how quickly the dataset is refreshed when media mix changes.
Digital ad spend by country, programmatic share direction, and disclosed media-owner revenue movements are the checks that keep Mordor Intelligence's estimate tied to paid media value in the region, rather than wider marketing budgets or partial channel snapshots.
Benchmark comparison
| Source | Market Size | Gaps in Research Methodology |
|---|---|---|
| Mordor Intelligence | USD 28.34 B (2025) | |
| Regional Consultancy A | USD 29.62 B (2024) | Uses a different base year and commonly leans toward digital-first spend definitions, which can understate traditional media and shift the total through currency timing and inflation handling. |
| Industry Portal B | USD 28.00 B (2024) | Reported as a rounded headline value with limited clarity on included channels and fee treatment, which can miss programmatic take-rates and smaller country allocations in the regional roll-up. |
The spread in the table is mostly explained by year alignment and what gets counted inside advertising value, not by a single dramatic assumption. When scope is kept consistent across media types and the pricing and timing choices are stated clearly, the final market value becomes easier to trace and repeat in future updates.


Key Questions Answered in the Report
What is the current value of the South East Asia Advertising market?
The market is valued at USD 32.46 billion in 2026 and is on track to exceed USD 63.89 billion by 2031.
Which channel type is growing fastest in Southeast Asian advertising?
Digital media leads with a projected 15.05% CAGR through 2031, outpacing all traditional formats.
Why is Vietnam considered the fastest-expanding ad market in the region?
Vietnam combines 15.9% CAGR, high AI adoption, and expanding broadband coverage, driving rapid ad-spend gains.
How significant is programmatic buying across Southeast Asia today?
Although non-programmatic still holds 68.95% share, programmatic channels are growing at 15.15% CAGR and gaining ground each year.
What role do super-apps play in regional advertising strategies?
Super-apps like Grab integrate payments, logistics, and commerce, offering closed-loop data that boosts targeting precision and campaign ROI.
Page last updated on:


 Your data is secure and never sold or shared.


