In-App Advertising Market Size and Share
Market Overview
| Study Period | 2020 - 2031 |
|---|---|
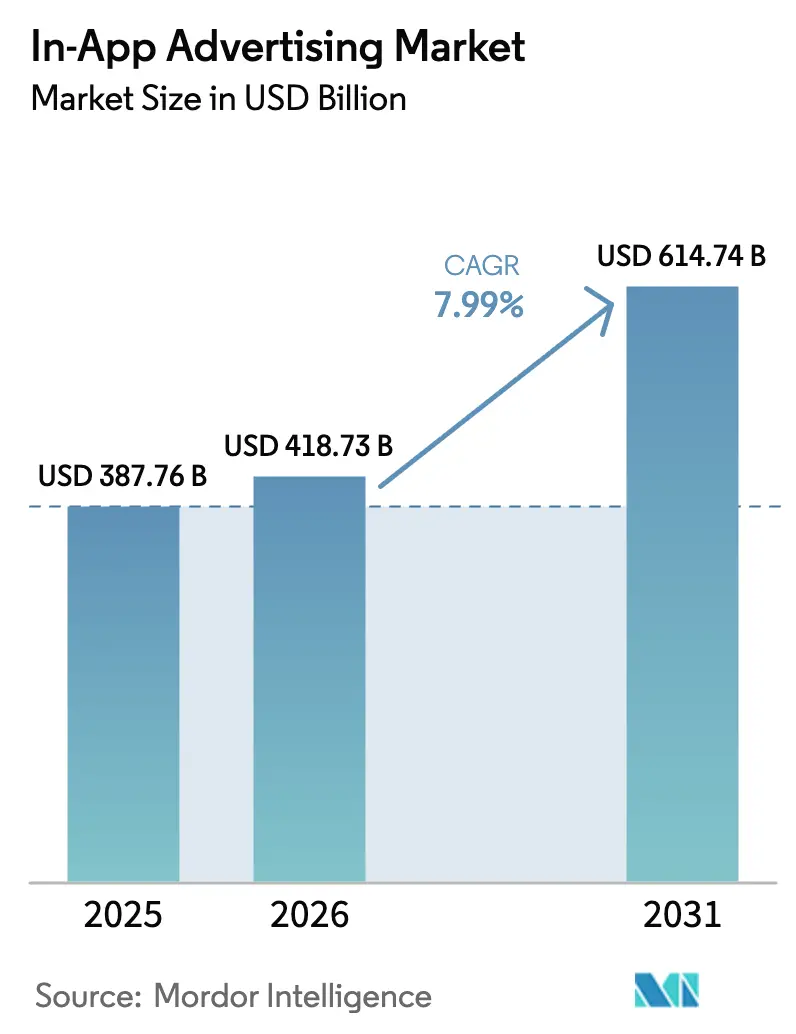
| Market Size (2026) | USD 418.73 Billion |
| Market Size (2031) | USD 614.74 Billion |
| Growth Rate (2026 - 2031) | 7.99% CAGR |
| Fastest Growing Market | Middle East and Africa |
| Largest Market | Asia Pacific |
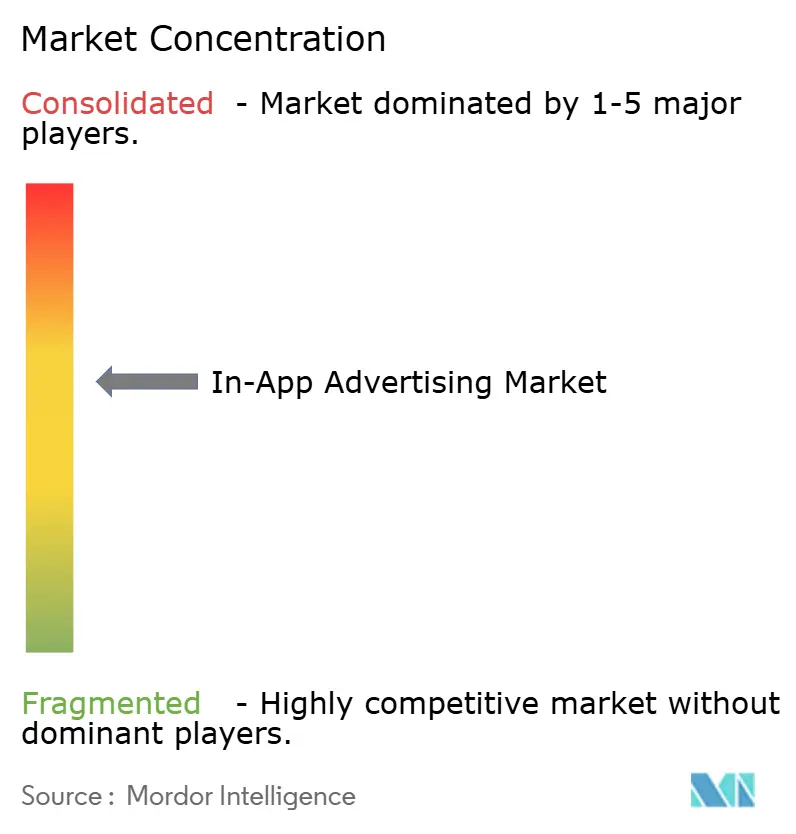
| Market Concentration | Medium |
Major Players *Disclaimer: Major Players sorted in no particular order Image © Mordor Intelligence. Reuse requires attribution under CC BY 4.0. | |
In-App Advertising Market Analysis by Mordor Intelligence
The in-app advertising market size is expected to grow from USD 387.76 billion in 2025 to USD 418.73 billion in 2026 and is forecast to reach USD 614.74 billion by 2031 at 7.99% CAGR over 2026-2031. Robust smartphone penetration and longer in-app session times are widening premium inventory, while privacy-led targeting limits are pushing budgets toward creative formats that can work without personal identifiers. Asia-Pacific commands the largest regional share at 38.4% in 2024, driven by mobile-first consumption and fast 5G rollout. Video remains the top ad type with 37.2% share, and rewarded video leads growth with a projected 12.8% CAGR because it aligns user incentives with advertiser goals. Platform diversification is underway as Android holds 69.1% share, yet HarmonyOS captured 19% of China’s devices by end-2024, forcing planners to rethink OS-level allocations. Advertisers are countering rising ad fatigue and stricter compliance rules with AI-driven creative optimisation and contextual targeting that restore performance while safeguarding privacy.
Key Report Takeaways
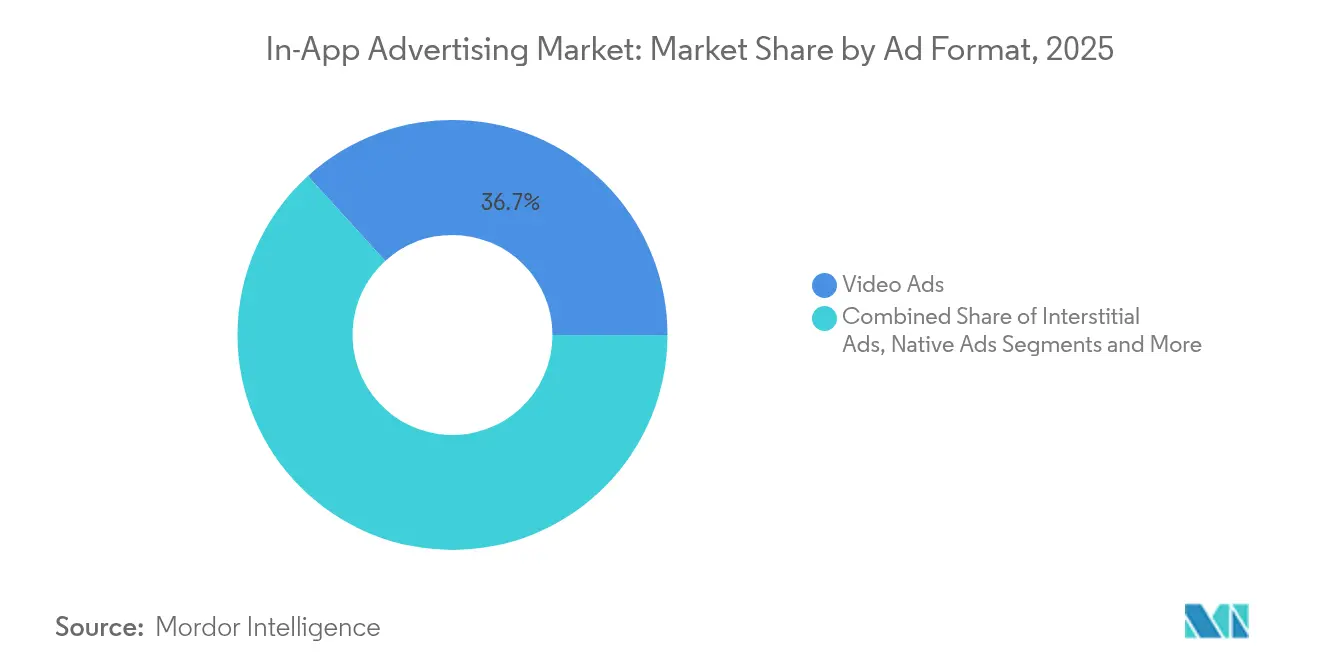
- By ad format, video ads led with 36.74% of the in-app advertising market share in 2025; rewarded video is projected to expand at a 12.29% CAGR to 2031.
- By platform, Android held 68.35% of the in-app advertising market in 2025, while other platforms together are projected to grow at a 14.45% CAGR through 2031.
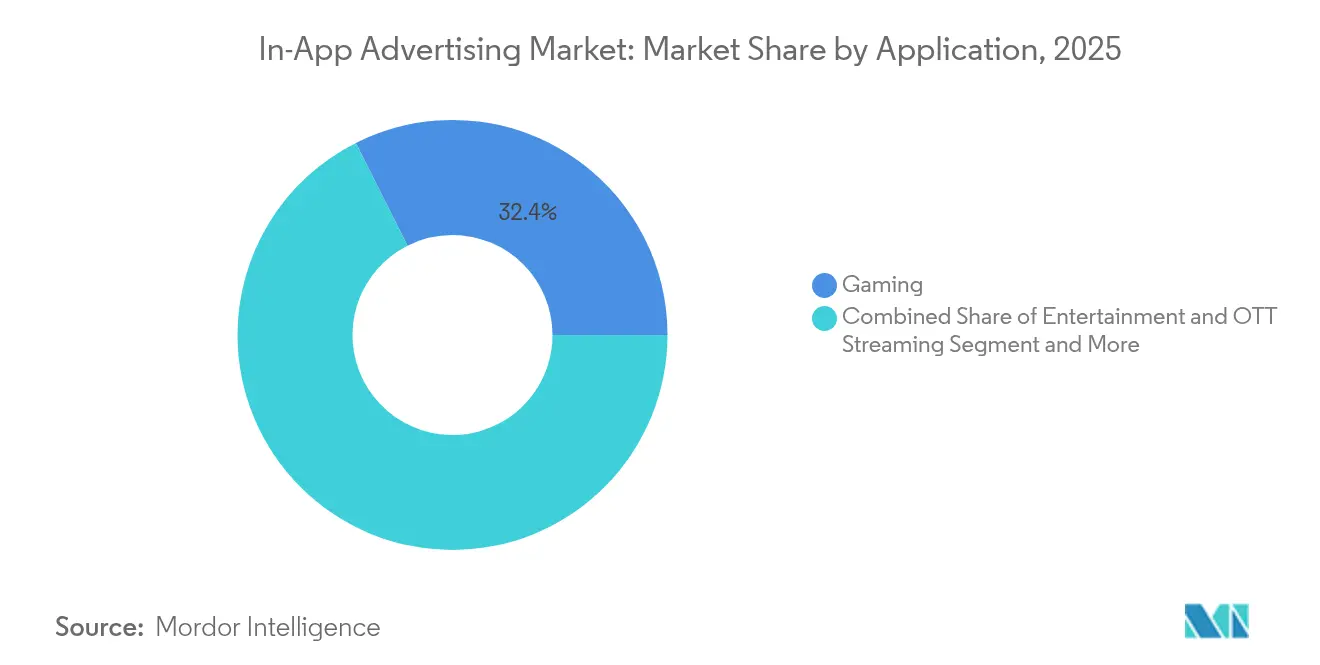
- By application, gaming captured 32.42% revenue share of the in-app advertising market in 2025; financial services and payments apps are advancing at a 12.98% CAGR to 2031.
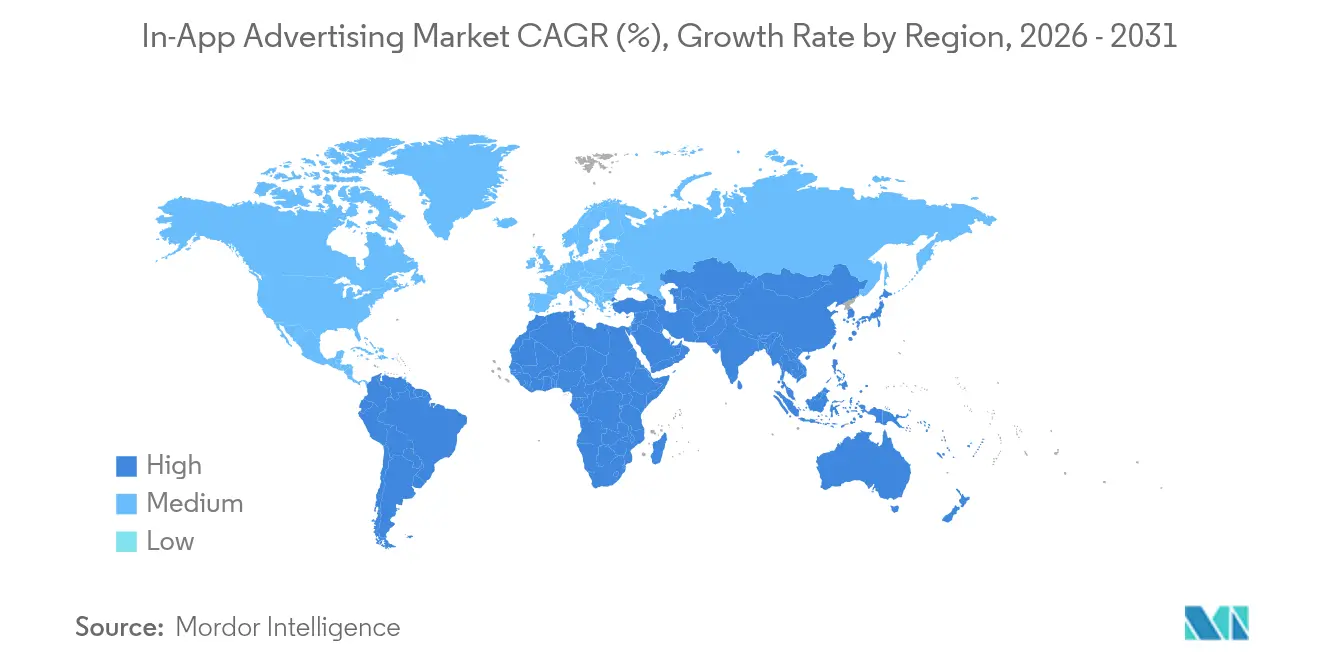
- By geography, Asia-Pacific dominated with 37.91% share in 2025, whereas the Middle East and Africa region is forecast to deliver a 10.55% CAGR through 2031.
Note: Market size and forecast figures in this report are generated using Mordor Intelligence’s proprietary estimation framework, updated with the latest available data and insights as of 2026.
Global In-App Advertising Market Trends and Insights
Drivers Impact Analysis*
| Driver | (~) % Impact on CAGR Forecast | Geographic Relevance | Impact Timeline |
|---|---|---|---|
| 5G-enabled HD rewarded video monetisation | +1.80% | APAC core; spill-over to North America | Medium term (2-4 years) |
| Privacy-safe contextual targeting surge post-ATT | +1.20% | North America and EU | Short term (≤ 2 years) |
| AI-based dynamic creative optimisation | +1.50% | Global; stronger in emerging markets | Medium term (2-4 years) |
| Super-app retail media networks | +0.90% | Southeast Asia | Medium term (2-4 years) |
| Programmatic in-app bidding by streaming apps | +1.10% | North America and EU | Short term (≤ 2 years) |
| Fintech and crypto apps’ performance spend | +0.70% | Latin America | Medium term (2-4 years) |
| Source: Mordor Intelligence | |||
5G-Enabled HD Rewarded Video Monetisation in APAC Gaming Apps
Widespread 5G connectivity across Asia-Pacific allows publishers to stream high-definition rewarded videos without buffering, lifting completion rates by 25% versus 4G environments. Game studios in South Korea and China now integrate longer HD ad segments that boost eCPM and user retention. Enhanced bandwidth also lets developers embed richer reward mechanics, which raises average session duration. As 5G coverage extends to secondary cities, incremental inventory becomes available, reinforcing the in-app advertising market’s upside. Marketers gain superior brand storytelling while maintaining performance metrics, keeping this driver relevant through the medium term.
Privacy-Safe Contextual Targeting Surge post-ATT in North America an EU
Apple’s App Tracking Transparency stabilised opt-in rates near 30% in 2024, forcing advertisers to pivot to content-level signals rather than user IDs. AI engines parse on-screen text, engagement patterns and cohort behaviour to deliver ads with almost 85% of the conversion efficiency previously achieved via deterministic IDs. Android’s share of mobile ad spend rose to 45% as budgets balanced privacy risk and scale. Regulators in the EU welcome the method, accelerating its local adoption. Brands appreciate faster creative iterations, making contextual solutions a cornerstone of the in-app advertising market.
AI-Based Dynamic Creative Optimisation Boosting eCPM in Emerging Markets
Dynamic creative optimisation tools assemble text, image and call-to-action elements in real time based on contextual cues, driving up to 2x higher click-through rates within a few weeks of rollout. The technology excels in bandwidth-constrained emerging markets by detecting device capability and tailoring asset weight accordingly. Resulting eCPM gains reach 50%, lifting publisher yields without raising ad load. Because DCO uses cohort data rather than personal IDs, it aligns with privacy statutes and broadens advertiser access to the in-app advertising market.
Super-App Retail Media Networks Scaling Native Placements in Southeast Asia
Grab and Gojek are evolving from multiservice utilities into retail media powerhouses that merge rides, food and payments data. Their native placements exploit first-party purchase journeys, tripling conversion rates compared with standard display placements.. GroupM’s 2024 partnership with GrabAds strengthened deterministic audience modelling that respects privacy constraints. As these networks expand into adjacent APAC territories, global advertisers gain fresh inventory at scale, deepening the in-app advertising market’s opportunity.
Restraints Impact Analysis*
| Restraint | (~) % Impact on CAGR Forecast | Geographic Relevance | Impact Timeline |
|---|---|---|---|
| ATT signal loss curtails audience granularity | -1.30% | Global; peak impact in North America and EU | Short term (≤ 2 years) |
| Rising and fatigue an interstitial blocks | -0.80% | EU; spill-over to North America | Medium term (2-4 years) |
| India data-localisation mandate | -0.60% | India; implications worldwide | Medium term (2-4 years) |
| Google Play SDK Runtime and iOS ATT 2.0 compliance cost | -0.90% | Global | Short term (≤ 2 years) |
| Source: Mordor Intelligence | |||
ATT Signal Loss Curtailing Audience Granularity on iOS
Removal of IDFA access cut Meta click-through rates by 37% and revenue by 39.4% for firms leaning on Meta channels. Probabilistic attribution has reached 85% accuracy, yet performance still lags deterministic levels. Advertisers shift spend to Android and web, dampening iOS investment and shaving near-term growth from the in-app advertising market.
Rising Ad-Fatigue and Interstitial Blocks Among EU Users
EU audiences report higher intolerance for disruptive formats, pushing interstitial block rates up 15% year-over-year in 2024 The Interactive Advertising Bureau urges shorter, skippable placements, nudging developers toward native and rewarded units. Compliance adds creative overhead, yet also steers the in-app advertising market toward user-value models.
*Our forecasts treat driver/restraint impacts as directional, not additive. The impact forecasts reflect baseline growth, mix effects, and variable interactions.
Segment Analysis
By Ad Type: Rewarded Video Drives Engagement Revolution
Video ads secured 36.74% of the in-app advertising market in 2025, propelled by 3-5x higher eCPM than banner inventory. The format’s immersive storytelling elevates brand recall, giving publishers leverage to command premium rates. Rewarded video, a sub-segment, is forecast to deliver 12.29% CAGR, benefitting from fair value exchange that keeps opt-out rates low. The in-app advertising market size for video ads is projected to increase sharply along with 5G diffusion, reinforcing its lead position.
Publishers still deploy interstitials at natural pauses, yet EU fatigue is curbing frequency caps. Native ads blend seamlessly into feeds and are attracting brand budgets because they avoid user irritation. Rich-media and audio slots open incremental reach, especially during multitasking scenarios. Together, these innovations diversify monetisation without swelling ad load, fueling sustainable growth inside the in-app advertising market.


By Platform: Android Dominance Amid OS Diversification
Android retained 68.35% of global inventory in 2025, with adoption highest in cost-sensitive markets where entry-level devices dominate. The in-app advertising market size tied to Android campaigns is set to expand further as OEMs pre-install monetisation SDKs. Advertisers value Android scale and lower CPM, positioning it as the default channel for performance acquisition.
Other platforms collectively are forecast for a 14.45% CAGR as HarmonyOS gains share in China and KaiOS penetrates feature-phone segments. HarmonyOS’s 19% national share by end-2024 surpassed iOS, signalling rising fragmentation. iOS still commands premium yields because of higher spending power. Privacy changes elevated Apple Search Ads to 35% of iOS app-install budgets, showing how platform owners capture spend even when identifiers vanish. This multi-OS balance compels agencies to build flexible creatives that adapt across SDK rules, keeping the in-app advertising market fluid.
By Application: Gaming Leads While Finance Accelerates
Gaming delivered 32.42% of the in-app advertising market in 2025 because of high session frequency and broad genre diversity. Adventure titles achieved ARPM of USD 7.71 compared with the aggregate USD 3.10, underscoring monetisation headroom. Asia-Pacific generated 64% of global mobile gaming revenue, and 5G connectivity allows richer ad placements that deepen yield. The in-app advertising market share held by gaming therefore remains resilient even when user acquisition costs rise.
Financial services and payments apps post the fastest 12.98% CAGR through 2031. Aggressive wallet-top-up incentives and lower acquisition cost are redirecting budgets into always-on retention flows. Social media, entertainment streaming and e-commerce continue to siphon brand dollars thanks to scaled reach and commerce proximity. News and utility apps provide contextual niches valued for brand safety, solidifying a wide vertical spread that propels the in-app advertising market forward.
Geography Analysis
Asia-Pacific led with 37.91% of the in-app advertising market in 2025. China’s super-app economy and 5G maturity create environments where high-definition video completes seamlessly. HarmonyOS’s rise reshapes OS targeting, while Japan and South Korea contribute premium gaming inventory supported by reliable broadband. India’s ad spend is growing rapidly, although data localisation rules are tightening cross-border data flows. These trends indicate lasting momentum for the in-app advertising market.
The Middle East and Africa region records the fastest 10.55% CAGR. UAE smartphone penetration stands at 97%, with users online 4.5 hours daily, supporting an estimated USD 317 million in-app budgets for 2024. Gaming revenue in the UAE is forecast to rise from USD 50 million in 2024 to USD 68 million by 2027, underpinning ad growth. Social and chat apps claim 48% of regional spend, and retailers increasingly deploy programmatic buying to capture fast-growing youth audiences. Converging media habits sustain robust expansion of the in-app advertising market.
North America remains pivotal, spearheaded by the United States where programmatic penetration tops 90% of mobile video impressions. Europe’s stringent privacy rules accelerate contextual adoption, widening share for vendors specialising in AI-led content analysis. South America, led by Brazil, shows rising fintech and gaming activity that spurs sophisticated performance spending, positioning the region as an emerging growth pillar for the in-app advertising market.

Competitive Landscape
The in-app advertising market shows moderate fragmentation with platform owners on the top tier. Google AdMob, Meta Audience Network and Apple Search Ads exploit deep device integration and first-party data. Independent networks such as AppLovin, ironSource and InMobi differentiate through cross-platform mediation, specialised gaming focus and AI-driven optimisation. Consolidation is climbing; June 2024 averaged one ad-tech deal per week, including Seedtag buying Beachfront Media and Madhive acquiring Frequence
Privacy constraints raise entry barriers and push incumbents toward proprietary measurement stacks. Vendors invest in creative automation that swaps copy and imagery in real time, maintaining relevance without personal identifiers. Retail media inside super-apps offers fresh revenue for platforms like Grab, creating a new competitor set anchored in commerce data. Audio monetisation via programmatic insertion expands user-reach moments, allowing publishers to tap idle attention spans.[2]AdTonos, “Audio Ads in Programmatic Media: 2025 Trends,” adtonos.com
Strategic priorities centre on AI capabilities, context engines and industry-specific toolkits. Companies providing turnkey solutions for fintech, healthcare or gaming attract premium valuations. Partnerships between telcos and DSPs, such as T-Mobile with Vistar for out-of-home extensions, reveal how connectivity owners leverage exclusive data to capture upstream spend. [3]T-Mobile US Inc., “T-Mobile Advertising Solutions Unveils New Capabilities,” t-mobile.com These dynamics affirm ongoing evolution in the in-app advertising market.
In-App Advertising Industry Leaders
Google AdMob (Alphabet Inc.)
AppLovin Corp.
InMobi Pte Ltd.
Apple Search Ads / Apple Inc.
Chartboost Inc. (LoopMe)
- *Disclaimer: Major Players sorted in no particular order

Recent Industry Developments
- May 2025: Google unveiled AI Overviews, AI Marketing Assistants and new creative tools such as Image-to-Video Transformation at Google Marketing Live 2025
- May 2025: T-Mobile Advertising Solutions integrated its first-party data with the Vistar platform and rolled out in-store retail media offers
- January 2025: Microsoft Advertising launched Curate for Commerce and Sponsored Promotions by Brands, letting retailers monetise first-party data on a cost-per-sale basis
- January 2025: Attentive surpassed USD 500 million ARR and advanced AI-driven RCS messaging in partnership with Google


Global In-App Advertising Market Report Scope
In-app advertising places ads directly within mobile applications, enabling brands to engage users during their app interactions. These advertisements come in diverse formats: banner ads, interstitials, video ads, native ads, and rewarded ads. By harnessing user data like demographics and behavior, in-app advertising delivers tailored and targeted messages. Predominantly utilized in gaming, social media, and utility apps, in-app advertising boasts superior engagement and visibility over conventional web ads.
In-app advertising market is segmented by type (banner ads, interstitial ads, rich media ads, video ads, and other types), platform (android, iOS, and other platforms), application (entertainment, gaming, social, online shopping, payment & ticketing, news, and other applications), geography (North America, Europe, Asia, Australia, New Zealand, Latin America, and Middle East & Africa).
The market size and forecasts are provided in terms of value (USD) for all the above segments.
| Video Ads |
| Interstitial Ads |
| Native Ads |
| Rich-Media Ads |
| Rewarded Video Ads |
| Other Types |
| Android |
| iOS |
| Other Platforms (HarmonyOS, KaiOS, etc.) |
| Social Media |
| Gaming |
| Entertainment and OTT Streaming |
| E-commerce and Retail |
| Financial Services and Payments |
| News and Publishing |
| Other Applications |
| North America | United States |
| Canada | |
| Mexico | |
| South America | Brazil |
| Argentina | |
| Rest of South America | |
| Europe | United Kingdom |
| Germany | |
| France | |
| Italy | |
| Spain | |
| Russia | |
| Rest of Europe | |
| Asia Pacific | China |
| Japan | |
| India | |
| South Korea | |
| Australia and New Zealand | |
| Southeast Asia | |
| Rest of Asia Pacific | |
| Middle East | Saudi Arabia |
| United Arab Emirates | |
| Turkey | |
| Rest of Middle East | |
| Africa | South Africa |
| Nigeria | |
| Kenya | |
| Rest of Africa |
| By Ad Type | Video Ads | |
| Interstitial Ads | ||
| Native Ads | ||
| Rich-Media Ads | ||
| Rewarded Video Ads | ||
| Other Types | ||
| By Platform | Android | |
| iOS | ||
| Other Platforms (HarmonyOS, KaiOS, etc.) | ||
| By Application | Social Media | |
| Gaming | ||
| Entertainment and OTT Streaming | ||
| E-commerce and Retail | ||
| Financial Services and Payments | ||
| News and Publishing | ||
| Other Applications | ||
| By Geography | North America | United States |
| Canada | ||
| Mexico | ||
| South America | Brazil | |
| Argentina | ||
| Rest of South America | ||
| Europe | United Kingdom | |
| Germany | ||
| France | ||
| Italy | ||
| Spain | ||
| Russia | ||
| Rest of Europe | ||
| Asia Pacific | China | |
| Japan | ||
| India | ||
| South Korea | ||
| Australia and New Zealand | ||
| Southeast Asia | ||
| Rest of Asia Pacific | ||
| Middle East | Saudi Arabia | |
| United Arab Emirates | ||
| Turkey | ||
| Rest of Middle East | ||
| Africa | South Africa | |
| Nigeria | ||
| Kenya | ||
| Rest of Africa | ||


Key Questions Answered in the Report
What is the current size of the in-app advertising market?
The market stands at USD 418.73 billion in 2026 and is projected to rise to USD 614.74 billion by 2031, reflecting a 7.99% CAGR.
Which ad format generates the highest revenue?
Video ads lead with 36.74% share, and rewarded video is the fastest-growing sub-format with a 12.29% projected CAGR to 2031.
Why is Asia-Pacific so dominant in the in-app advertising market?
The region combines large mobile-first populations, fast 5G rollout and super-app ecosystems, resulting in 37.91% of global revenue in 2025.
How have privacy rules affected targeting strategies?
Apple’s ATT and Google’s upcoming changes have accelerated the shift to contextual and cohort-based approaches that replace individual IDs while retaining 80-85% of prior conversion efficiency.
Which application category is growing fastest for ad spend?
Financial services & payments apps are projected to grow at a 12.98% CAGR as fintech players invest in performance marketing to lower acquisition costs.
What is the expected growth rate for the Middle East & Africa segment?
The region is forecast to expand at a 10.55% CAGR to 2031, driven by high smartphone penetration and a young, digitally engaged population.
Page last updated on:


