
Software Asset Management With Sustainability Scoring Market Size and Share
Market Overview
| Study Period | 2020 - 2031 |
|---|---|
| Market Size (2026) | USD 1.14 Billion |
| Market Size (2031) | USD 2.59 Billion |
| Growth Rate (2026 - 2031) | 17.84 % |
| Fastest Growing Market | Asia-Pacific |
| Largest Market | Europe |
| Market Concentration | Medium |
Major Players *Disclaimer: Major Players sorted in no particular order Image © Mordor Intelligence. Reuse requires attribution under CC BY 4.0. | |
Software Asset Management With Sustainability Scoring Market Analysis by Mordor Intelligence
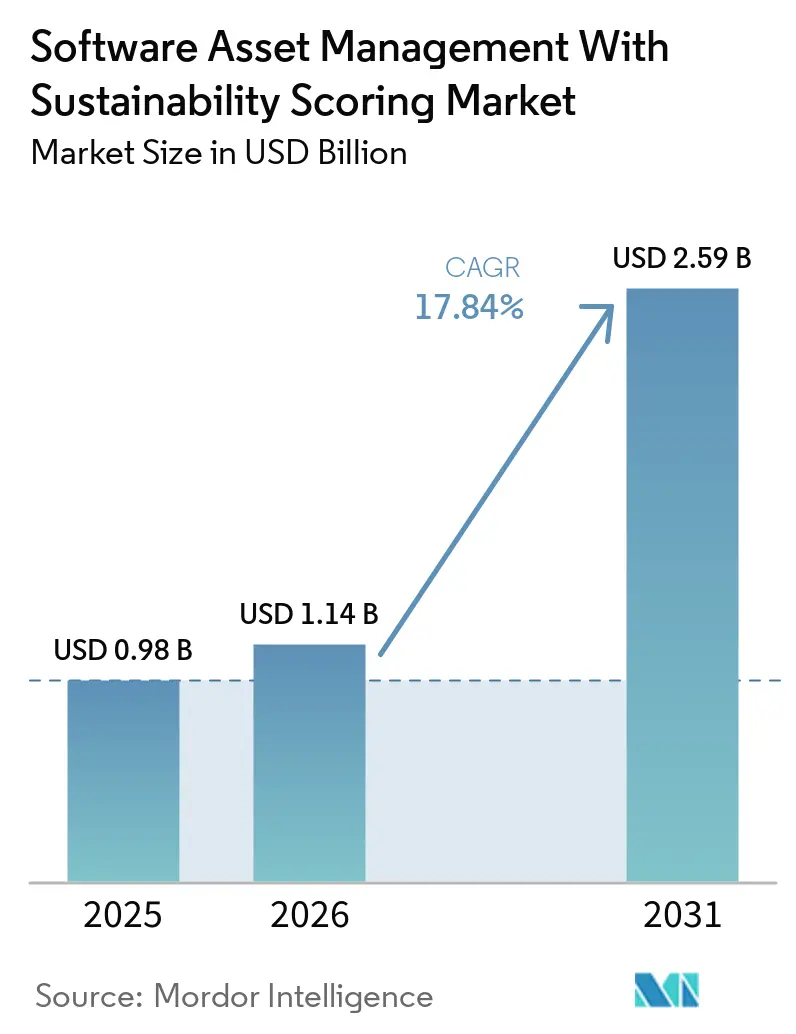
The Software Asset Management with Sustainability Scoring market size was valued at USD 0.98 billion in 2025 and estimated to grow from USD 1.14 billion in 2026 to reach USD 2.59 billion by 2031, at a CAGR of 17.84% during the forecast period (2026-2031). The Software Asset Management with Sustainability Scoring market is expanding because enterprises now treat software oversight as a combined cost, compliance, and environmental discipline rather than a narrow license control function. Demand is rising as large organizations need tools that connect software discovery, usage tracking, and reporting with clearer evidence on emissions tied to digital operations. SaaS sprawl continues to widen the governance gap, pushing buyers toward platforms that can identify inactive subscriptions, support cleanup actions, and connect those actions to sustainability reporting goals. Regulatory momentum in Europe and stronger disclosure expectations in other regions are reinforcing procurement interest, while broader digital transformation is creating new room for vendors that can blend financial oversight with sustainability scoring. Competition is increasingly shaped by platform breadth, workflow integration, and the ability to support carbon-aware decision making across complex software estates, which keeps the Software Asset Management with Sustainability Scoring market on a strong growth path.
Key Report Takeaways
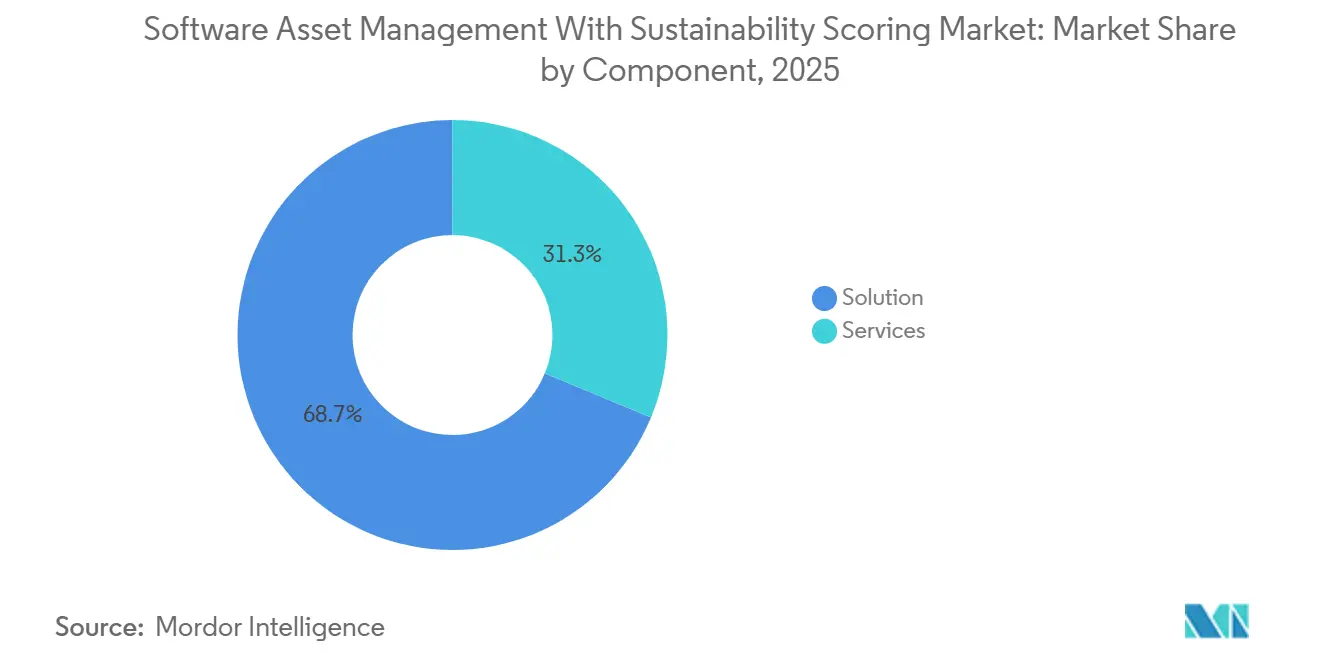
- By component, solution held 68.74% of the Software Asset Management with Sustainability Scoring market share in 2025, while services are projected to expand at an 18.25% CAGR through 2031.
- By deployment mode, cloud accounted for 65.12% of the Software Asset Management with Sustainability Scoring market size in 2025, while hybrid is expected to record the highest CAGR of 18.05% through 2031.
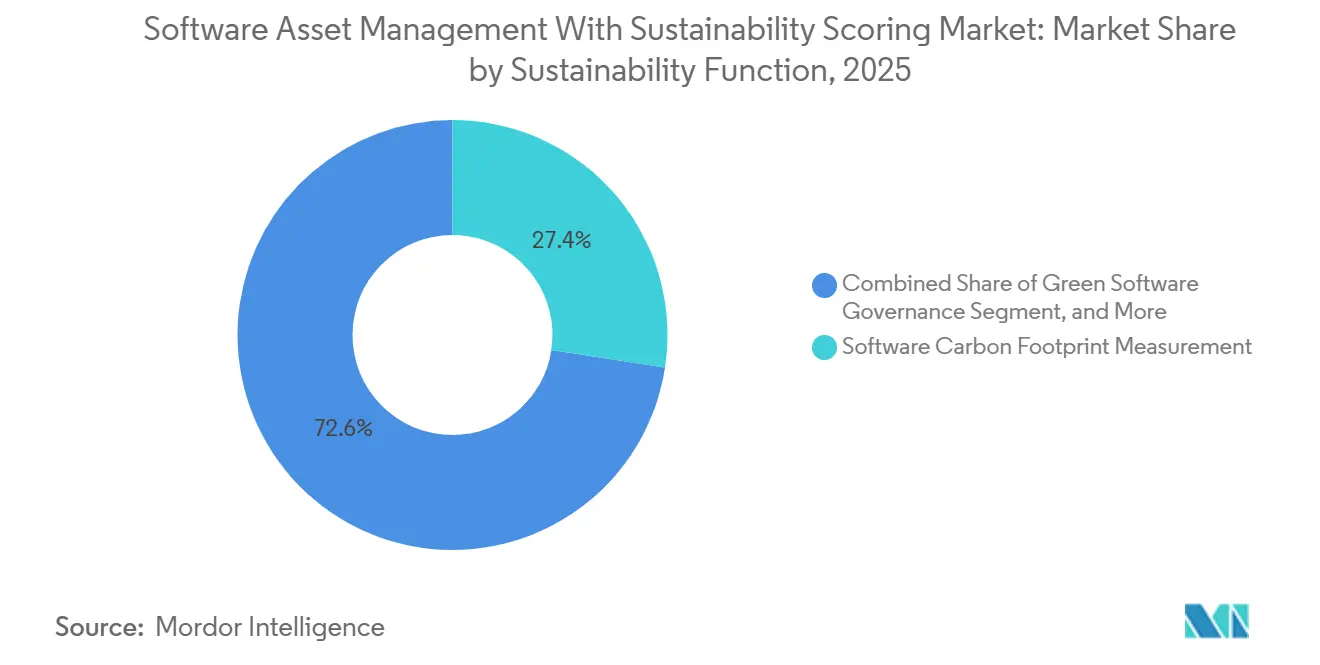
- By sustainability function, software carbon footprint measurement accounted for 27.41% in 2025, while green software governance is projected to advance at a 18.65% CAGR through 2031.
- By end-use industry, IT and telecom led with 28.63% share in 2025, while retail and e-commerce are expected to expand at an 18.45% CAGR through 2031.
- By enterprise size, large enterprises held 63.45% share in 2025, while SMEs are projected to grow at an 18.12% CAGR through 2031.
- By geography, Europe held 34.56% share in 2025, while Asia-Pacific is projected to record the fastest CAGR of 18.72% through 2031.
Note: Market size and forecast figures in this report are generated using Mordor Intelligence’s proprietary estimation framework, updated with the latest available data and insights as of January 2026.
Market Trends and Insights
Drivers Impact Analysis of Software Asset Management With Sustainability Scoring Market*
| Driver | (~) % Impact on CAGR Forecast | Geographic Relevance | Impact Timeline |
|---|---|---|---|
| Rising SaaS License Leakage and Unused Entitlements | +4.5% | Global, pronounced in North America and Europe | Short term (≤ 2 years) |
| Need for Carbon-Aware Software Portfolio Rationalization | +3.8% | Europe-led, expanding to Asia-Pacific and North America | Medium term (2-4 years) |
| FinOps, ITAM, and Sustainability Reporting Convergence | +3.2% | Global, with Asia-Pacific showing faster integration | Medium term (2-4 years) |
| Audit Pressure From Complex Vendor Contracting Models | +2.6% | North America and Europe | Short term (≤ 2 years) |
| Demand for Shadow AI and Shadow SaaS Discovery | +2.1% | Global, strongest in North America and Western Europe | Short term (≤ 2 years) |
| Workspace Reallocation and Device Refresh Optimization | +1.2% | North America, Europe, and Asia-Pacific | Medium term (2-4 years) |
| Source: Mordor Intelligence | |||
Rising SaaS License Leakage and Unused Entitlements
Rising SaaS waste is creating a direct, measurable demand base for the Software Asset Management with Sustainability Scoring market, as enterprises can no longer ignore large volumes of paid-for but unused subscriptions. In Q1 2026, 66% of enterprise SaaS licenses were untouched or surplus to requirements, indicating how far governance has fallen behind the pace of software adoption.[1] In 2025, 35% of organizations said SaaS waste had worsened over the prior year, and only 50% felt comfortable with their SaaS visibility, which reinforces the same operational gap from a broader ITAM perspective. In the Software Asset Management with Sustainability Scoring market, this problem matters because inactive cloud software still consumes supporting compute resources, turning license waste into both a cost and an emissions issue. Buyers are therefore favoring platforms that translate reclamation actions into savings data and sustainability evidence in a single workflow, thereby strengthening the commercial case for the Software Asset Management with Sustainability Scoring market.
Need for Carbon-Aware Software Portfolio Rationalization
The need to rationalize software portfolios with a carbon lens is becoming a core growth engine for the Software Asset Management with Sustainability Scoring market, as many enterprises still lack a reliable way to link software use with emissions outcomes. The Software Carbon Intensity framework, aligned with ISO/IEC 21031:2024, provides vendors and buyers with a clearer way to measure emissions per functional unit of software, rather than relying on broad averages.[2] The same foundation ratified the Sustainable Organizational Framework for Technology in November 2025, which moved the discussion from simple measurement to governance, operational accountability, and repeatable implementation models. The EU Corporate Sustainability Reporting Directive has also increased pressure on large organizations to improve the quality and auditability of sustainability disclosures, which raises the value of software-level evidence within the Software Asset Management with Sustainability Scoring market. As a result, enterprises that once focused only on software spend are now looking at portfolio cleanup, workload choices, and procurement discipline in a more connected way, which supports stronger adoption across the Software Asset Management with Sustainability Scoring market.
FinOps, ITAM, and Sustainability Reporting Convergence
The Software Asset Management with Sustainability Scoring market is also benefiting from the practical merger of FinOps, ITAM, and sustainability work inside large organizations. A strategic partnership announced in June 2025 formalized that convergence, and the initiative included joint work on integration practices and FinOps for SaaS training.[3] This matters because buyers increasingly want one governance layer that can explain spend, usage, compliance, and sustainability outcomes without forcing separate teams to reconcile inconsistent records. In the Software Asset Management with Sustainability Scoring market, vendors with stronger integrations are better placed because budget owners now prefer tools that reduce duplication and support shared reporting workflows. That shift is making standalone point tools less attractive, while platforms that connect asset intelligence with financial and ESG processes are gaining relevance across the Software Asset Management with Sustainability Scoring market.
Audit Pressure From Complex Vendor Contracting Models
Audit pressure remains a strong short-term trigger for the Software Asset Management with Sustainability Scoring market because vendor licensing models have become more complex rather than simpler in cloud and subscription settings. In 2025, 45% of organizations had paid more than USD 1 million in software audit fines over the previous 3 years, with Microsoft involved in 50% of audit incidents, IBM in 37%, and SAP in 32%. These figures show why enterprises continue to invest in discovery, reconciliation, and usage validation even before sustainability scoring becomes the primary buying reason. In the Software Asset Management with Sustainability Scoring market, platforms that improve data quality for license defense also create the same inventory discipline needed for emissions tracking, thereby strengthening the value proposition. This overlap between compliance readiness and sustainability readiness is helping the Software Asset Management with Sustainability Scoring market secure budget support from multiple stakeholders simultaneously.
Restraints Impact Analysis of Software Asset Management With Sustainability Scoring Market*
| Restraint | (~) % Impact on CAGR Forecast | Geographic Relevance | Impact Timeline |
|---|---|---|---|
| Data Normalization Gaps Across SaaS, On-Premises, and Cloud Licenses | -3.5% | Global | Medium term (2-4 years) |
| Weak Internal Ownership Between Procurement, IT, and Sustainability Teams | -2.9% | Global, more acute in mid-market enterprises across Europe and Asia-Pacific | Medium term (2-4 years) |
| Limited ROI Visibility for Mid-Market Buyers | -2.2% | Global, particularly SMEs in emerging markets | Short term (≤ 2 years) |
| Model Complexity for Measuring Sustainability Scores at Software Asset Level | -1.8% | Global | Long term (≥ 4 years) |
| Source: Mordor Intelligence | |||
Data Normalization Gaps Across SaaS, On-Premises, and Cloud Licenses
Data normalization remains a central restraint on the Software Asset Management with Sustainability Scoring market because sustainability scoring depends on one trusted software inventory across environments that were rarely designed to work together. Enterprises often hold software records in procurement systems, cloud consoles, ITSM tools, and local spreadsheets, and those records do not always align on product names, owners, use rights, or usage intensity. The Software Carbon Intensity model underscores the need for consistent data because carbon measurement must connect software activity to the operating context rather than rely on broad organizational averages. In the Software Asset Management with Sustainability Scoring market, weak normalization slows deployment, weakens confidence in reported scores, and makes formal assurance more difficult for organizations facing stricter disclosure expectations. Until enterprises improve the data foundation across SaaS, on-premises, and cloud assets, the Software Asset Management with Sustainability Scoring market will continue to face adoption friction even where buyer interest is already strong.
Weak Internal Ownership Between Procurement, IT, and Sustainability Teams
Weak ownership across procurement, IT, and sustainability teams is another significant brake on the Software Asset Management with Sustainability Scoring market, as no single group typically controls the full chain of contract, usage, and emissions information. In 2025, integration patterns changed unevenly across functions, and sustainability collaboration did not advance as consistently as cost and operations alignment. This leaves many projects stuck between teams that each manage one part of the problem, but not the whole operating model. In the Software Asset Management with Sustainability Scoring market, it slows approvals, delays integrations, and weakens accountability after deployment, especially in mid-market organizations with limited specialist resources. Vendors that simplify cross-team workflow design can reduce this barrier, but the Software Asset Management with Sustainability Scoring market still depends on stronger internal sponsorship for wider adoption.
*Our forecasts treat driver/restraint impacts as directional, not additive. The impact forecasts reflect baseline growth, mix effects, and variable interactions.
Software Asset Management With Sustainability Scoring Market Segment Analysis
By Component:
Solution Leadership Reflects Preference for Unified PlatformsThe solution segment held 68.74% of the Software Asset Management with Sustainability Scoring market share in 2025, reflecting clear buyer preference for a single platform that covers discovery, normalization, reconciliation, reporting, and sustainability scoring in a single operating layer. In the Software Asset Management with Sustainability Scoring market, large organizations usually prefer integrated platforms because separate tools create more reconciliation work and weaken confidence in software records at the point of audit or disclosure. Buyers are also placing greater value on software publisher coverage, depth of usage, and reporting consistency because these features support both day-to-day governance and formal reporting needs. The Software Asset Management with Sustainability Scoring industry is, therefore, rewarding vendors that can combine operational control with a defensible sustainability framework rather than offering narrow tracking features. This explains why platform depth remains a decisive factor in enterprise purchasing across the Software Asset Management with Sustainability Scoring market.
Services are projected to expand at a 18.25% CAGR through 2031, reflecting that many buyers still lack internal teams to configure and manage these programs at scale. The Software Asset Management with Sustainability Scoring market is seeing growing demand for managed support as reporting obligations become more structured and hybrid software estates require continuous data cleanup. The EU Corporate Sustainability Reporting Directive is reinforcing this need by pushing large enterprises toward more auditable sustainability processes, which increases demand for implementation and reporting support. Service growth also aligns with the reality that software governance is not a one-time setup, since contracts, subscriptions, user behavior, and infrastructure patterns change throughout the year. For that reason, the Software Asset Management with Sustainability Scoring market continues to give strong weight to solution providers that can pair software platforms with sustained advisory, managed, and integration services.[4]
By Deployment Mode:
Cloud Leads Today While Hybrid Gains Faster GroundCloud accounted for 65.12% of the Software Asset Management with Sustainability Scoring market in 2025, indicating that buyers still favor the speed, lower infrastructure burden, and easier scalability of SaaS-delivered platforms. Cloud deployment aligns well with organizations that already manage large SaaS portfolios and want centralized updates, faster rollouts, and fewer local maintenance requirements. In the Software Asset Management with Sustainability Scoring market, this model also aligns well with enterprises that need faster visibility into subscription usage and want reporting outputs without a long on-premises setup cycle. The appeal is especially strong where software estates are already shifting toward cloud-native applications, remote work models, and broader workflow automation. As a result, cloud remained the most established delivery model across the Software Asset Management with Sustainability Scoring market in 2025.
Hybrid is projected to grow at a 18.05% CAGR through 2031, pointing to a different reality in large enterprises, where legacy environments and modern SaaS portfolios continue to coexist. The Software Asset Management with Sustainability Scoring market is benefiting from hybrid demand, as many enterprises cannot retire on-premises systems quickly but still need a view across older infrastructure software and newer subscription tools. Hybrid setups also provide a more comprehensive data baseline for sustainability scoring by combining agent-driven discovery in traditional estates with cloud connectors in newer environments. This matters in the Software Asset Management with Sustainability Scoring market because software emissions governance is only credible when buyers can see the full estate rather than just the cloud portion. On-premises deployment is losing relative momentum in new projects, but it still retains a place in regulated settings where cloud migration is slower, and data control remains a higher priority.
By Enterprise Size:
Large Enterprises Hold the Lead While SMEs Add Growth MomentumLarge enterprises commanded 63.45% share in 2025, and that lead came from the scale and complexity of their software estates, higher audit exposure, and stronger pressure to formalize sustainability reporting. The Software Asset Management with Sustainability Scoring market has gained earlier traction in this group because large enterprises are more likely to run broad software portfolios across multiple business units, geographies, and licensing models. They also have a more immediate need to connect software optimization with financial control and sustainability governance under formal internal oversight structures. The EU reporting timetable has added further pressure on large companies to support more rigorous sustainability disclosures and evidence chains. Because of these factors, the Software Asset Management with Sustainability Scoring market still draws its largest current revenue base from large enterprise buyers.
SMEs are projected to expand at a 18.12% CAGR through 2031, indicating that the next wave of growth is moving toward smaller organizations with growing software dependence but fewer internal control resources. In the Software Asset Management with Sustainability Scoring market, SME demand is being supported by more affordable SaaS-native offerings, lower setup barriers, and broader expectations from customers, partners, and parent organizations. Many smaller firms now face indirect reporting pressure within supplier ecosystems, making structured software oversight more relevant even when formal disclosure rules do not apply in the same way. The Software Asset Management with Sustainability Scoring industry is responding by favoring simpler pricing, faster onboarding, and phased module activation so that buyers can start with software visibility and expand later into sustainability features. This is why SMEs are emerging as the faster growth engine in the Software Asset Management with Sustainability Scoring market, even though large enterprises still dominate the revenue base.
By Sustainability Function:
Measurement Remains the Entry Point While Governance Scales FasterSoftware carbon footprint measurement captured a 27.41% share in 2025, indicating that most organizations still begin their sustainability efforts by trying to see and quantify the problem before reshaping policy or operating behavior. The Software Asset Management with Sustainability Scoring market has therefore built much of its early demand around measurement-led use cases that help buyers connect software assets with emissions visibility. This function is easier to justify in the first stage because it supports internal baselining, reporting preparation, and a clearer understanding of where software-related emissions may be concentrated. The Software Carbon Intensity framework has given measurement work more structure, making it easier for vendors to explain and standardize their scoring logic. That is why measurement remained the largest function within the Software Asset Management with Sustainability Scoring market in 2025.
Green software governance is projected to grow at a 18.65% CAGR through 2031, indicating that buyers are moving beyond observation toward active control of software-related environmental outcomes. The Software Asset Management with Sustainability Scoring market is shifting in this direction because enterprises increasingly want sustainability criteria embedded into procurement, deployment choices, decommissioning plans, and broader software policy. The Sustainable Organizational Framework for Technology, ratified in November 2025, supports that move by providing organizations with a more comprehensive model for strategy, implementation, operations, and compliance. Functions such as utilization optimization and license rationalization remain important because they offer immediate cost benefits, but governance-oriented demand is rising faster as buyers seek more repeatable decision rules. This change shows that the Software Asset Management with Sustainability Scoring market is maturing from measurement-first programs toward broader operational discipline with sustainability built into everyday software management.
By End-Use Industry:
IT and Telecom Leads While Retail and E-Commerce Moves FasterIT and telecom held a 28.63% share in 2025, reflecting the sector’s dense software environments, strong reliance on digital tools, and earlier readiness to align software management with sustainability goals. The Software Asset Management with Sustainability Scoring market finds a natural fit in this vertical because software portfolios are broad, change quickly, and create continuous pressure around visibility, entitlement control, and reporting. Organizations in this group also tend to adopt governance tools earlier because their operating models are already software-intensive and because inefficiencies are easier to detect in heavily digitized environments. The Software Asset Management with Sustainability Scoring market, therefore, continued to draw its largest end-user base from IT and telecom in 2025. BFSI and manufacturing remained important adjacent adopters because both sectors manage high-value software estates and place strong emphasis on compliance, vendor control, and structured operations.
Retail and e-commerce are projected to expand at an 18.45% CAGR through 2031, driven by rapid SaaS adoption, distributed digital work patterns, and growing scrutiny of software and cloud efficiency across modern retail operations. In the Software Asset Management with Sustainability Scoring market, this vertical is moving quickly because digital retailers often add tools rapidly and then need stronger oversight once license sprawl and inactive usage become apparent. Energy and utilities are also finding value in aligning software oversight with broader environmental accountability across operations. Government and public sector demand is developing more slowly, yet the Software Asset Management with Sustainability Scoring market still has room to grow there, as standardized software oversight supports accountability, procurement discipline, and long-term reporting quality. Other industries are further along in adoption, but many are following the same path from compliance-focused software controls toward broader sustainability-linked governance as digital maturity improves.
Geography Analysis
Europe Software Asset Management with Sustainability Scoring Market
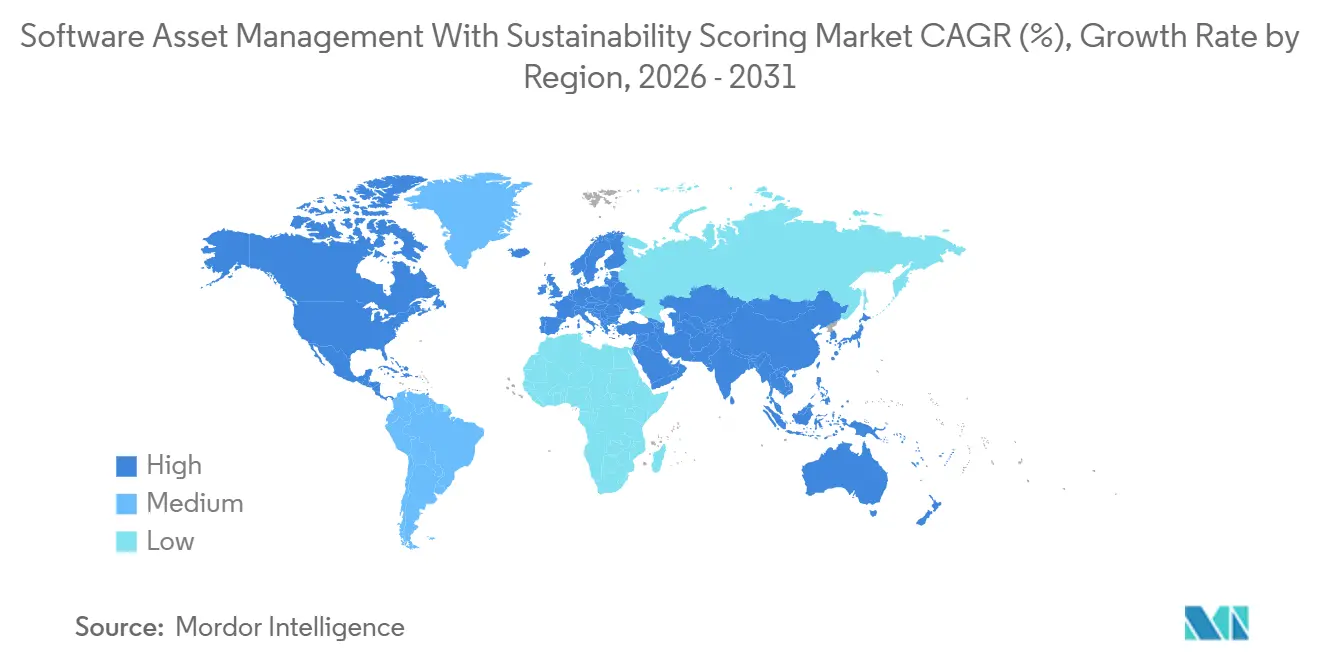
Europe held 34.56% of the Software Asset Management with Sustainability Scoring market share in 2025, reflecting earlier regulatory pressure, stronger reporting expectations, and more mature governance practices across large enterprises. The phased implementation of the Corporate Sustainability Reporting Directive has been central to this position because it has widened the number of organizations that must support structured sustainability disclosures with stronger evidence and control. Wave 1 listed companies filed their first reports on FY2024 data in 2025, and other large undertakings are now reporting on FY2025 data in 2026, which is expanding current demand for auditable systems. The revised threshold discussion around more than 1,000 employees and over EUR 450 million, USD 486 million, in net turnover has concentrated the immediate mandated buyer pool while leaving broader voluntary adoption to continue through supplier ecosystems. Within Europe, Germany remains one of the more established national environments for this category because software governance and transparency in sustainability are treated as linked operational needs. For these reasons, the Software Asset Management with Sustainability Scoring market remains strongest in Europe.
North America Software Asset Management with Sustainability Scoring Market
North America continues to hold a major secondary position in the Software Asset Management with Sustainability Scoring market because enterprises in the region manage large SaaS estates and face heavy audit exposure from major software vendors. Demand there is driven more by cost control, license governance, and enterprise-led sustainability goals than by a single federal disclosure regime. Even so, multinational companies with European reporting obligations are extending their governance practices across broader global software estates, which supports adoption in the United States and Canada. This means the Software Asset Management with Sustainability Scoring market in North America remains commercially attractive even without a CSRD-style federal framework.
APAC, South America and MEA Software Asset Management with Sustainability Scoring Market
Asia-Pacific is projected to record the fastest CAGR of 18.72% through 2031, reflecting large-scale digital transformation across China, India, Japan, and South Korea. The Software Asset Management with Sustainability Scoring market is expanding rapidly in the region, as SaaS adoption is outpacing governance maturity in many enterprise environments. India adds a distinct growth path because large IT services firms often need auditable software and sustainability data for global client relationships. South America remains smaller but is emerging, with multinational subsidiaries aligning their reporting practices with those of their overseas parents. The Middle East and Africa are still at an earlier stage, yet adoption is growing as organizations first use software asset management tools for cost and compliance, then add sustainability functions as program maturity improves.
Competitive Landscape
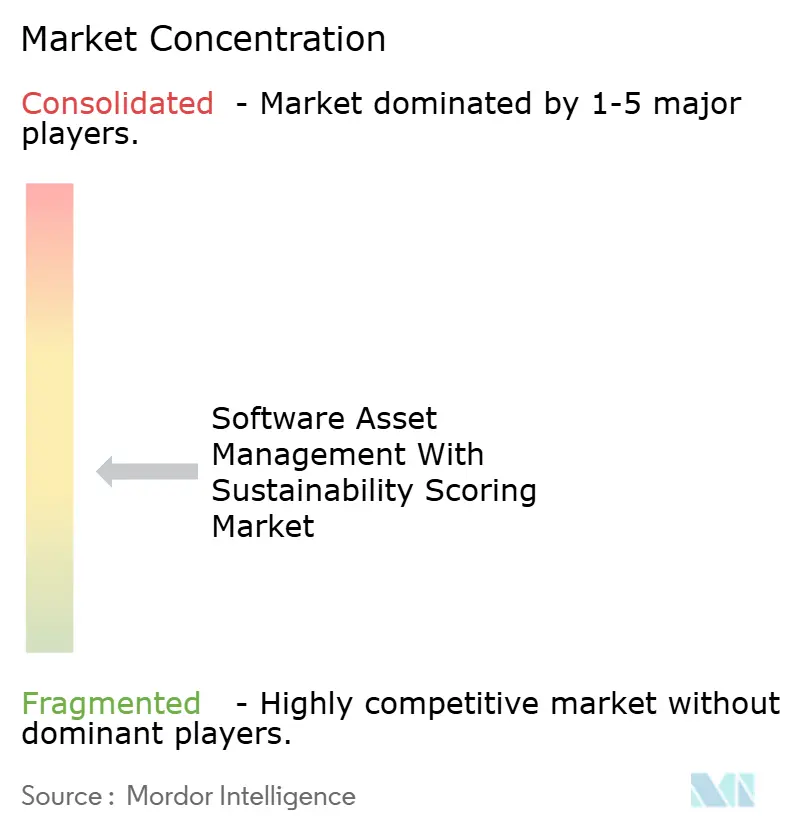
The Software Asset Management with Sustainability Scoring market is moderately concentrated in large-enterprise deals, but the broader vendor set remains fragmented, as many suppliers compete on narrower functions such as spend control, discovery depth, workflow integration, or sustainability reporting overlays. This creates a structure where a smaller group of full-platform vendors is strongest in complex accounts, while specialists still retain room in mid-market and feature-led opportunities. The Software Asset Management with Sustainability Scoring market is therefore not dominated by a single provider; yet scale, integration capabilities, and breadth of software coverage matter more as buyers move toward enterprise-wide governance programs. Flexera has strengthened its position through product expansion that ties software management more closely to sustainability and broader cloud governance. The company launched Flexera One SaaS Management in July 2025 to combine Flexera and Snow capabilities into a single SaaS discovery and optimization platform.
Flexera then added carbon emissions forecasting to Flexera One Cloud Sustainability in January 2026, demonstrating how leading vendors are moving from reactive reporting to predictive planning support. In April 2026, it also integrated Flexera One IT Visibility with SAM on Snow Atlas, bringing strategic asset insight and compliance data closer together in a single operating interface. These moves matter because the Software Asset Management with Sustainability Scoring market increasingly rewards vendors that connect discovery, optimization, and sustainability outputs without forcing buyers to manage several disconnected systems. ServiceNow also remains an important competitive force because embedding SAM within a broader ITSM environment reduces deployment friction for organizations that already use its workflow
Competitive pressure is also coming from adjacent governance categories where cloud cost, AI oversight, and software control are starting to overlap. IBM Apptio expanded its visibility tools in June 2025 with AI TCO and Usage and Hybrid IT TCO Impact features, which signaled stronger convergence between software governance and broader technology financial management. OpenText and TELUS launched a Canadian sovereign cloud offering in September 2025, addressing data residency concerns that can affect cloud-based governance adoption in sensitive environments. In February 2025, Hitachi Vantara and BMC announced a strategic alliance to optimize mainframe and open systems environments, reflecting the continued importance of hybrid enterprise estates. Taken together, these moves show that the Software Asset Management with Sustainability Scoring market is being shaped by vendors that can support unified control across cloud, legacy systems, software economics, and sustainability reporting.
Software Asset Management With Sustainability Scoring Industry Leaders
-
Flexera
-
ServiceNow, Inc.
-
USU Software AG
-
Snow Software AB
-
Ivanti, Inc
- *Disclaimer: Major Players sorted in no particular order
Software Asset Management With Sustainability Scoring Market Companies Covered in this Report
- Flexera
- ServiceNow, Inc.
- USU Software AG
- Ivanti, Inc.
- Certero Limited
- Matrix42 AG
- Snow Software AB
- OpenText Corporation
- Lansweeper NV
- Eracent, Inc.
- License Dashboard Ltd.
- Belarc, Inc.
- Asset Panda, LLC
- Zluri Inc.
- Productiv, Inc.
- BetterCloud, Inc.
- Torii Labs Ltd.
- Zylo, Inc.
- Apptio, Inc.
- BMC Software, Inc.
- Tangoe, Inc.
Recent Industry Developments in Software Asset Management With Sustainability Scoring Market
- May 2026: Flexera One SaaS Management introduced recommended user assignment logic for overlapping ServiceNow subscriptions, reducing manual effort in license reconciliation for enterprises running complex ServiceNow deployment models.
- April 2026: Flexera integrated Flexera One IT Visibility with SAM on Snow Atlas, combining Technopedia-powered asset enrichment with software compliance and spend management into a unified strategic IT insights interface.
- January 2026: Flexera added carbon emissions forecasting to its Flexera One Cloud Sustainability product, enabling organizations to predict and proactively manage cloud-based carbon emissions with auditable trend visuals, shifting sustainability management from reactive reporting to predictive planning aligned with the same cadence as cloud spend budgeting
- January 2026: OpenText and TELUS jointly launched the OpenText and TELUS Canadian Sovereign Cloud, offering enterprise-grade cloud computing and AI capabilities with full data sovereignty within Canadian borders. Availability to commercial and government customers began September 2025, addressing data residency constraints that had limited cloud-based SAM adoption in the Canadian public sector.
Global Software Asset Management With Sustainability Scoring Market Report Scope
The Software Asset Management with Sustainability Scoring market comprises platforms and services that combine traditional SAM capabilities with sustainability-focused metrics to optimize software use, reduce environmental impact, and align IT operations with ESG goals. These solutions provide functionalities such as carbon footprint measurement of software assets, SaaS utilization optimization, license rationalization, cloud resource efficiency monitoring, sustainability reporting, and governance frameworks for green software practices.
The Software Asset Management with Sustainability Scoring market report is segmented by Component (Solution, and Services), Deployment Mode (Cloud, On-Premises, and Hybrid), Enterprise Size (Large Enterprises, and Small and Medium Enterprises), Sustainability Function (Software Carbon Footprint Measurement, SaaS Utilization Optimization, License Rationalization, Cloud Resource Efficiency Monitoring, Sustainability Reporting, and Green Software Governance), End-Use Industry (IT and Telecom, BFSI, Manufacturing, Energy and Utilities, Retail and E-Commerce, Construction and Infrastructure, Government and Public Sector, and Other End-User Industries), and Geography (North America, South America, Europe, Asia-Pacific, Middle East, and Africa). The Market Forecasts are Provided in Terms of Value (USD).
Segmentation Overview
| Solution |
| Services |
| Cloud |
| On-Premises |
| Hybrid |
| Large Enterprises |
| Small And Medium Enterprises |
| Software Carbon Footprint Measurement |
| SaaS Utilization Optimization |
| License Rationalization |
| Cloud Resource Efficiency Monitoring |
| Sustainability Reporting |
| Green Software Governance |
| IT and Telecom |
| BFSI |
| Manufacturing |
| Energy and Utilities |
| Retail and E-Commerce |
| Construction and Infrastructure |
| Government and Public Sector |
| Other End-User Industries |
| North America | United States | |
| Canada | ||
| Mexico | ||
| South America | Brazil | |
| Argentina | ||
| Rest of South America | ||
| Europe | Germany | |
| United Kingdom | ||
| France | ||
| Italy | ||
| Spain | ||
| Russia | ||
| Rest of Europe | ||
| Asia-Pacific | China | |
| India | ||
| Japan | ||
| South Korea | ||
| Australia | ||
| Rest of Asia-Pacific | ||
| Middle East and Africa | Middle East | Saudi Arabia |
| United Arab Emirates | ||
| Rest of Middle East | ||
| Africa | South Africa | |
| Nigeria | ||
| Rest of Africa | ||
| By Component | Solution | ||
| Services | |||
| By Deployment Mode | Cloud | ||
| On-Premises | |||
| Hybrid | |||
| By Enterprise Size | Large Enterprises | ||
| Small And Medium Enterprises | |||
| By Sustainability Function | Software Carbon Footprint Measurement | ||
| SaaS Utilization Optimization | |||
| License Rationalization | |||
| Cloud Resource Efficiency Monitoring | |||
| Sustainability Reporting | |||
| Green Software Governance | |||
| By End-Use Industry | IT and Telecom | ||
| BFSI | |||
| Manufacturing | |||
| Energy and Utilities | |||
| Retail and E-Commerce | |||
| Construction and Infrastructure | |||
| Government and Public Sector | |||
| Other End-User Industries | |||
| By Geography | North America | United States | |
| Canada | |||
| Mexico | |||
| South America | Brazil | ||
| Argentina | |||
| Rest of South America | |||
| Europe | Germany | ||
| United Kingdom | |||
| France | |||
| Italy | |||
| Spain | |||
| Russia | |||
| Rest of Europe | |||
| Asia-Pacific | China | ||
| India | |||
| Japan | |||
| South Korea | |||
| Australia | |||
| Rest of Asia-Pacific | |||
| Middle East and Africa | Middle East | Saudi Arabia | |
| United Arab Emirates | |||
| Rest of Middle East | |||
| Africa | South Africa | ||
| Nigeria | |||
| Rest of Africa | |||
Key Questions Answered in the Report
What is the current and forecast value of the Software Asset Management with Sustainability Scoring market?
The market was valued at USD 0.98 billion in 2025, reached USD 1.14 billion in 2026, and is forecast to reach USD 2.59 billion by 2031 at a 17.84% CAGR.
What is driving demand for software asset tools with sustainability scoring?
Demand is rising because enterprises need to control SaaS waste, improve license visibility, respond to audit pressure, and support more structured sustainability reporting.
Which component currently leads revenue generation?
Solutions led the market with 68.74% share in 2025 because enterprises prefer integrated platforms that combine discovery, reconciliation, reporting, and sustainability scoring.
Which deployment model is expanding the fastest?
Hybrid is projected to grow the fastest at an 18.05% CAGR through 2031, reflecting the need to manage both legacy on-premises systems and modern cloud software in one view.
Which region shows the strongest growth outlook?
Asia-Pacific is projected to record the fastest CAGR of 18.72% through 2031, supported by fast enterprise digitization and rising governance needs across major economies.
Which end-user group is growing the fastest?
Retail and e-commerce is projected to expand at an 18.45% CAGR through 2031 because rapid SaaS adoption and digital operating models are increasing the need for stronger software oversight.