
Sustainability Performance Management Software Market Size and Share
Market Overview
| Study Period | 2020 - 2031 |
|---|---|
| Market Size (2026) | USD 6.01 Billion |
| Market Size (2031) | USD 11.59 Billion |
| Growth Rate (2026 - 2031) | 14.04 % |
| Fastest Growing Market | Asia-Pacific |
| Largest Market | North America |
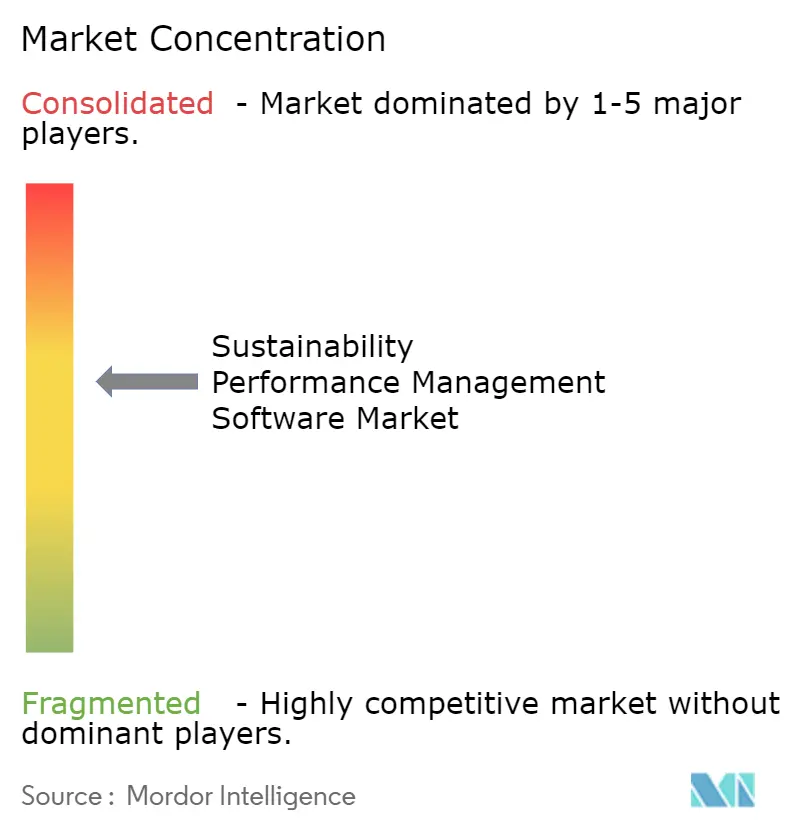
| Market Concentration | Medium |
Major Players *Disclaimer: Major Players sorted in no particular order Image © Mordor Intelligence. Reuse requires attribution under CC BY 4.0. | |
Sustainability Performance Management Software Market Analysis by Mordor Intelligence
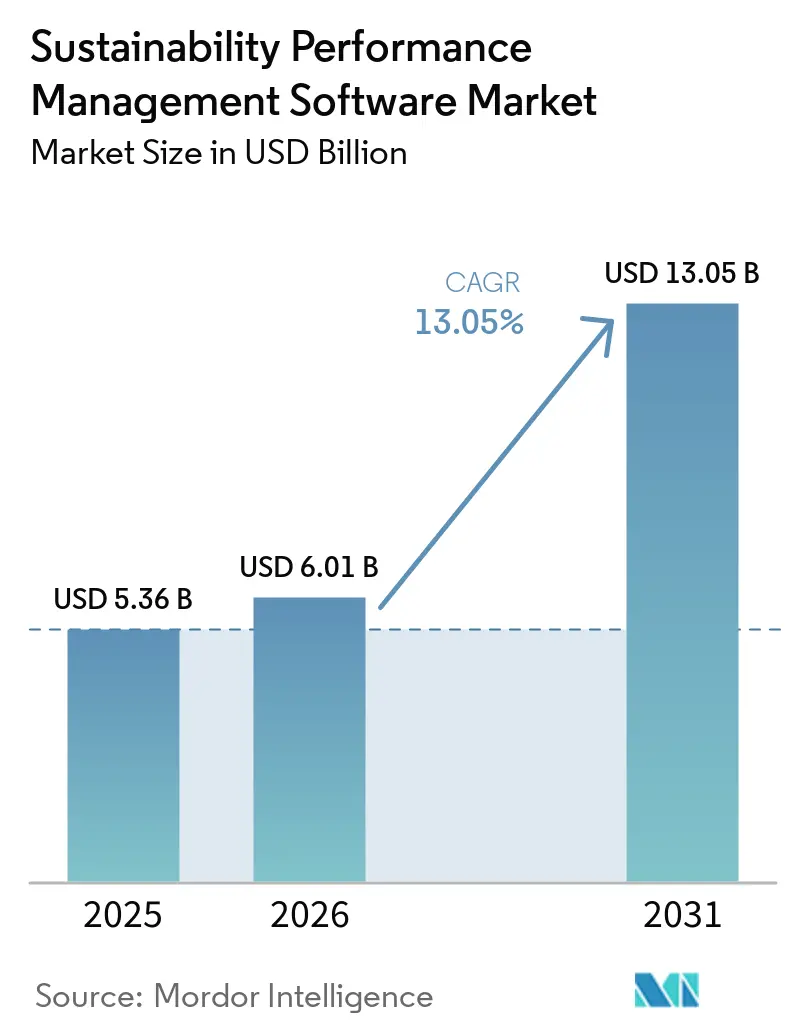
The sustainability performance management software market was valued at USD 5.36 billion in 2025 and is estimated to grow from USD 6.01 billion in 2026 to reach USD 11.59 billion by 2031, at a CAGR of 14.04% during the forecast period 2026-2031. The sustainability performance management software market is moving from a discretionary reporting tool set to a core operating platform because disclosure rules now require more formal workflows, stronger audit trails, and cleaner data controls across large enterprises and their suppliers. AI is also changing buying criteria in the sustainability performance management software market, as companies now want software that can map requirements, flag gaps, and shorten review cycles, rather than just storing metrics for year-end reporting. Demand is widening beyond sustainability teams as finance, treasury, legal, procurement, and risk groups need the same data for filing, assurance, lending, and internal planning, which supports broader platform adoption and larger contract scope. The sustainability performance management software market is also benefiting from the shift toward verified ESG information, as lenders and asset managers increasingly prefer auditable, repeatable data over static narrative disclosures. Competition in the sustainability performance management software market is therefore centered on integration depth, assurance readiness, supplier data c
Key Report Takeaways
- By component, software held 74.13% share of the sustainability performance management software market revenue in 2025, while services are projected to expand at a 16.83% CAGR through 2031.
- By deployment type, cloud-based platforms accounted for 63.12% of revenue in 2025, while cloud-based deployment is also expected to record the fastest growth at a 16.53% CAGR through 2031.
- By application, ESG and Sustainability Reporting accounted for 25.17% of revenue in 2025, while Carbon and Emissions Management is projected to expand at a 18.73% CAGR through 2031.
- By enterprise size, large enterprises held 76.14% of revenue in 2025, while SMEs are expected to post the highest growth at a 17.93% CAGR through 2031.
- By end-use industry, manufacturing accounted for 21.18% of revenue in 2025, while energy and utilities are projected to advance at a 17.53% CAGR through 2031.
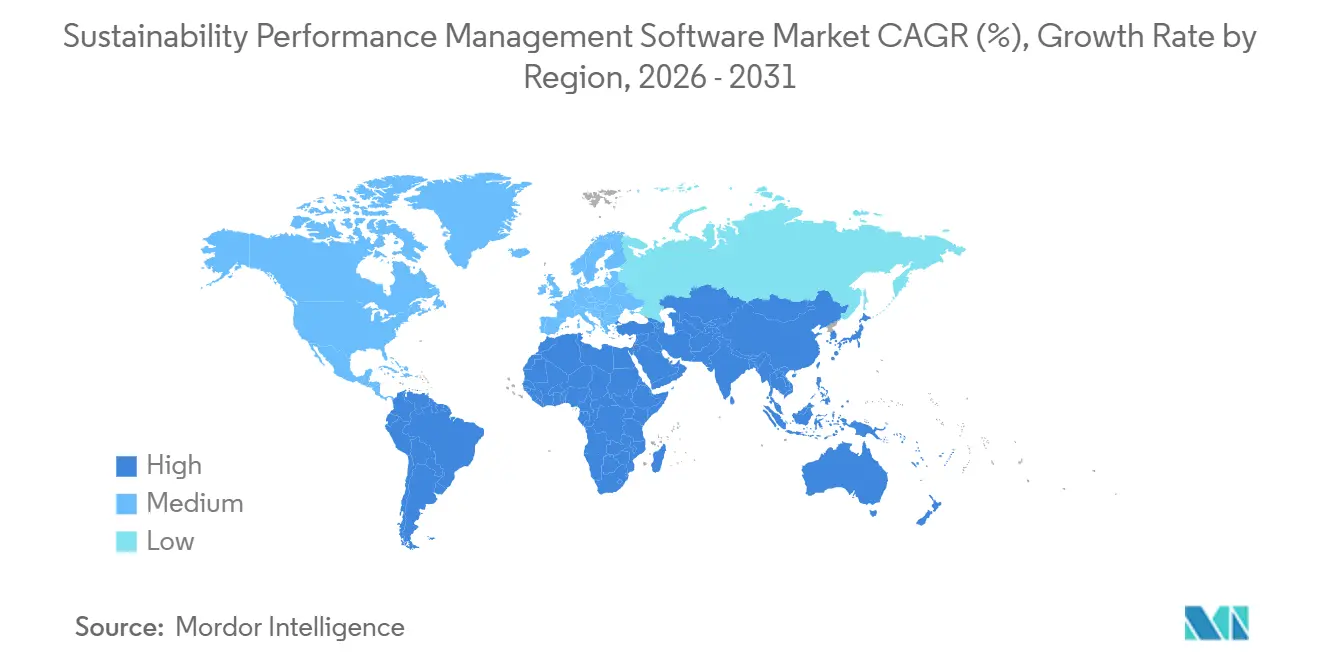
- By geography, North America held 34.53% of revenue in 2025, while the sustainability performance management software market in Asia-Pacific is expected to grow at a 17.83% CAGR through 2031.
Note: Market size and forecast figures in this report are generated using Mordor Intelligence’s proprietary estimation framework, updated with the latest available data and insights as of January 2026.
Market Trends and Insights
Drivers Impact Analysis of Sustainability Performance Management Software Market*
| Driver | (~) % Impact on CAGR Forecast | Geographic Relevance | Impact Timeline |
|---|---|---|---|
| Rising Regulatory Disclosure Mandates | 3.2% | Global, strongest in Europe and North America | Short term (≤ 2 years) |
| AI-Enabled Audit Readiness and Continuous Controls Monitoring | 2.8% | Global | Short term (≤ 2 years) |
| Investor and Lender Preference for Verifiable ESG Data | 2.5% | Global, led by Europe and North America, with spillover into Asia-Pacific and GCC | Medium term (2-4 years) |
| Scope 3 Supplier Data Digitization Pressure | 2.1% | Global, strongest in Asia-Pacific, with spillover into South America and Middle East and Africa | Medium term (2-4 years) |
| Finance to Sustainability Data Convergence in ERP and FP&A Workflows | 1.8% | Global, led by North America and Europe | Medium term (2-4 years) |
| Sustainability Data Trust and Assurance Gap Driving Platform Adoption | 1.5% | Global | Medium term (2-4 years) |
| Source: Mordor Intelligence | |||
Rising Regulatory Disclosure Mandates
European and U.S. reporting rules are pushing companies to replace loose reporting processes with systems that can support structured records, controlled workflows, and repeatable disclosure output. The sustainability performance management software market benefits directly from this shift, as companies can no longer rely on disconnected files when aligning operational metrics with formal filing calendars and internal review steps. In the United States, the SEC climate disclosure rule requires large accelerated filers to disclose Scope 1 and Scope 2 emissions for fiscal years beginning in 2025 and filed in 2026, which creates a defined compliance trigger for software procurement and data cleanup programs.[1] European disclosure obligations are creating a similar effect by increasing the need for consistent tagging, evidence storage, version control, and assurance support across multiple teams. The result is that software spending is moving into planned operating budgets rather than remaining in short-term pilot programs, which strengthens baseline demand in the sustainability performance management software market. This also brings suppliers into the same cycle, because large enterprises need cleaner upstream inputs before they can complete their own reporting and assurance work.
AI-Enabled Audit Readiness and Continuous Controls Monitoring
The sustainability performance management software market is gaining from a clear move away from annual, document-heavy reporting toward continuous monitoring and earlier issue detection. Buyers now want platforms that can identify missing fields, trace source records, and connect regulatory requirements with business data before legal and assurance teams begin their final review. SAP announced new sustainability AI agents in May 2026, including a Footprint Optimization Agent that reduces time spent on Scope 1, Scope 2, and Scope 3 scenario modeling from one working day to 20 minutes, and a Sustainability Regulatory Readiness Agent that automates mapping between materiality assessments and reporting requirements.[2] IBM also expanded this direction in April 2026 with Envizi Emissions Calculations in Excel, which helps companies move manual emissions work into a more scalable and auditable reporting flow. These product moves matter because AI is no longer being treated only as a speed tool, but as a control layer that can reduce review pressure and improve reporting consistency. That shift helps vendors increase platform relevance across finance, audit, and compliance groups, broadening the value proposition of the sustainability performance management software market.
Investor and Lender Preference For Verifiable ESG Data
Capital providers are placing greater weight on the quality and traceability of sustainability data, expanding demand beyond use cases for mandatory reporting. An OECD analysis published in 2025 found that 31% of companies, representing 66% of global market capitalization, that publicly disclose sustainability information had already obtained external verification or assurance of their reporting.[3] That changes the type of software buyers prefer, because data models, evidence trails, and review controls start to matter as much as the final disclosure output itself. The UN Principles for Responsible Investment also reported that 82% of general partners in private debt collect ESG data for direct lending due diligence, indicating that financing decisions increasingly depend on structured, reviewable information. As a result, the sustainability performance management software market is broadening from a reporting-led purchase into a data-governance purchase that touches treasury, credit, and investment decision workflows. This shift also increases switching costs because once those workflows are embedded, companies are less willing to revert to manual or loosely governed systems.
Scope 3 Supplier Data Digitization Pressure
Supplier data remains one of the hardest parts of enterprise sustainability reporting, creating a durable need for platforms that can collect, validate, and exchange information across company boundaries. The sustainability performance management software market is benefiting because large enterprises cannot provide robust emissions disclosures if supplier inputs remain fragmented, estimated, or delayed. EcoVadis said in May 2026 that research cited in its Workiva partnership announcement found that self-reported carbon footprints can understate actual output by a factor of 4 or more when methodological inconsistencies are corrected, which raises risk for companies that still depend on proxy-based calculations.[4] SAP’s Sustainability Data Exchange, built around PACT technical specifications from the World Business Council for Sustainable Development, supports product-level carbon data sharing between trading partners and helps move reporting away from broad averages and toward primary supplier data. This strengthens vendor positions where supplier networks are already large, because onboarding more partners increases both platform stickiness and the value of the underlying data environment. It also expands the sustainability performance management software market's reach into procurement, supplier management, and product carbon workflows that sit outside traditional disclosure teams.
Restraints Impact Analysis of Sustainability Performance Management Software Market*
| Restraint | (~) % Impact on CAGR Forecast | Geographic Relevance | Impact Timeline |
|---|---|---|---|
| Fragmented Enterprise Data Architecture Inhibits Deployment | -2.3% | Global | Medium term (2-4 years) |
| High Integration And Change Management Burden | -1.8% | Global | Medium term (2-4 years) |
| Immature Supplier Data Quality Slows Scope 3 Automation | -1.2% | Asia-Pacific core, with spillover into South America and Middle East and Africa | Medium term (2-4 years) |
| Assurance And Liability Concerns For AI-Generated ESG Narratives | -0.8% | Europe and North America dominant, with global spillover | Long term (≥ 4 years) |
| Source: Mordor Intelligence | |||
Fragmented Enterprise Data Architecture Inhibits Deployment
Many companies still store ESG-related information across finance, procurement, operations, HR, legal, and facility systems, making completeness and ownership difficult to manage. Schneider Electric noted that organizations often end up using one reporting system per jurisdiction, which increases reconciliation work and limits the operational value of the data they collect. The same problem slows the sustainability performance management software market because deployments take longer when data sources are inconsistent, definitions are not aligned, and source evidence is spread across many teams. Research published in 2025 on ScienceDirect also found that fewer than 20% of ESG ontology and data architecture projects validate their models against authentic enterprise data, which highlights the gap between clean design concepts and live operating conditions. For vendors, that means longer implementation periods, higher service demands, and a greater chance that customers delay full rollout until basic data governance improves. It also gives providers with pre-built ERP, HR, and procurement connectors an advantage, as faster integration reduces the effort needed to prove value early in the buying cycle.
High Integration and Change Management Burden
The sustainability performance management software market also faces a practical slowdown due to the volume of cross-functional work required after a contract is signed. A successful deployment often requires links across ERP, facilities, procurement, and HR systems, but it also requires a clear operating model for who owns the numbers, who reviews them, and who approves changes. SAP said in its 2026 Sustainability Control Tower update that CFOs and finance leaders are becoming more influential in ESG software funding decisions because sustainability teams often lack the authority to secure broad IT investment on their own. That funding shift is important, but it can still extend timelines because software decisions move into larger budget cycles and broader control discussions. Mid-sized vendors are more exposed when implementation support is limited, because customers expect more hands-on guidance as a program touches multiple internal systems and reporting frameworks. Until organizational ownership becomes clearer among many buyers, the sustainability performance management software market will continue to see strong demand alongside uneven deployment speed.
*Our forecasts treat driver/restraint impacts as directional, not additive. The impact forecasts reflect baseline growth, mix effects, and variable interactions.
Sustainability Performance Management Software Market Segment Analysis
By Component:
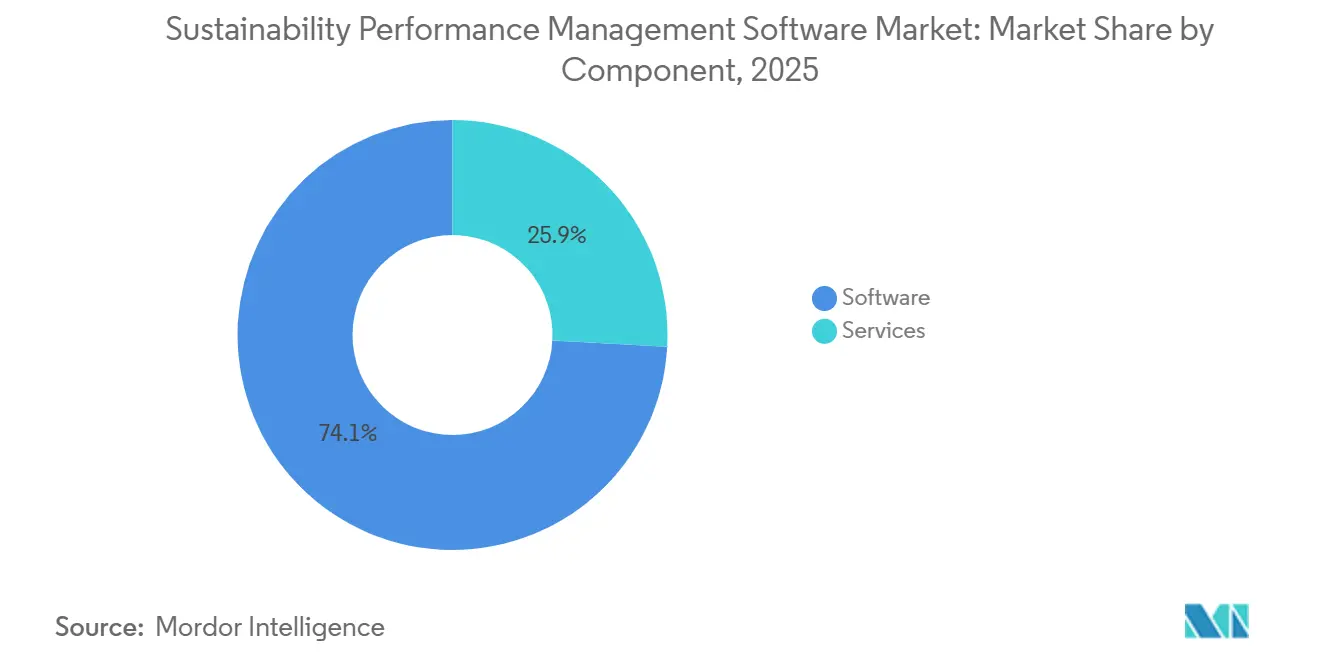
Software Leads While Services Expand FasterSoftware accounted for 74.13% of revenue in 2025, indicating that the largest spending pool still resides in core platforms rather than project-based support work. That weighting reflects how the sustainability performance management software market has matured, because once a platform is integrated with financial close processes, audit records, supplier inputs, and reporting controls, replacing it becomes far more difficult and disruptive. Renewal decisions, therefore, carry more than licensing implications, since moving away from an installed system can trigger data migration, process redesign, and revalidation work across several teams. IBM’s April 2026 launch of Envizi Emissions Calculations in Excel shows how major vendors are still expanding software reach into manual emissions workflows that had not yet been fully absorbed into enterprise systems.
Services are projected to expand at a 16.83% CAGR through 2031, which shows that implementation, data design, and ongoing support remain critical even as platform adoption rises. Companies often need help with materiality work, source mapping, control design, assurance preparation, and workflow configuration before they can fully realize the value of the underlying application layer. Managed services are also becoming increasingly relevant for organizations without large in-house sustainability teams, especially when reporting deadlines are near and data ownership spans several departments. This pattern keeps services closely tied to the sustainability performance management software market, because customers frequently buy advisory and support work alongside the software rather than as a separate category. It also means vendors with stronger partner ecosystems may sustain better expansion potential, since they can support a broader customer base without carrying all delivery work on their own.
By Deployment Type:
Cloud Architecture Supports Both Scale And SpeedCloud-based deployment accounted for 63.12% of the sustainability performance management software market in 2025 and is projected to grow at a 16.53% CAGR through 2031, confirming that the leading delivery model is still gaining momentum rather than losing it. This reflects the practical reality that reporting rules, taxonomy changes, validation logic, and workflow requirements are changing too often for most customers to rely on slower upgrade cycles. Workiva’s May 2026 sustainability release added a Simplified ESRS Intelligence knowledge base tied to draft simplified standards published by EFRAG in December 2025, which illustrates how cloud releases can respond quickly to evolving reporting needs. In the sustainability performance management software industry, the release pace matters because customers increasingly want a single platform that can accommodate rule changes without repeated local upgrades or project-heavy reconfiguration.
On-premise deployment still matters for government users, highly regulated institutions, and industrial operators that place added weight on data residency, internal hosting, or local control over sensitive records. Hybrid models are also gaining appeal where companies want centralized reporting and analytics in the cloud but still need some processing layers to remain closer to local systems or region-specific data controls. Security credentials such as ISO and SOC-style attestations have become part of standard procurement reviews, meaning hosting choice is now judged on assurance evidence as much as on technical preference. The sustainability performance management software market, therefore, remains flexible in deployment terms, but the strongest growth continues to be driven by models that can handle frequent updates and broad workflow coordination. That balance lets vendors address both large global clients and more specialized public-sector or regulated buyers without forcing one architecture on every customer.
By Application:
Reporting Leads Today While Carbon Management Expands FasterESG and Sustainability Reporting accounted for 25.17% of the sustainability performance management software market in 2025, underscoring its position as the most common starting point for enterprise adoption. Many companies still begin with disclosure automation because external reporting deadlines create the clearest budget case, the most visible executive pressure, and the quickest reason to replace spreadsheet-led processes. Carbon and Emissions Management, however, is projected to expand at an 18.73% CAGR through 2031, which shows that the use case is moving from annual disclosure support toward deeper operational management and transaction-level data control. SAP Green Ledger reflects that direction by connecting carbon accounting more closely with financial accounting processes, which supports the view that emissions data is being handled with greater business rigor.
Once the first reporting workflow is in place, companies often expand into environmental performance management, sustainability compliance management, and related monitoring tasks that reuse the same data foundation. Resource and waste management is also gaining importance, where packaging rules, product responsibility requirements, and materials tracking need more structured compliance processes than simple year-end reporting can provide. SAP said in May 2026 that its Packaging Compliance Agent reduces manual compliance review hours by more than 50%, signaling that adjacent applications are entering the same automation phase that carbon management has already begun to see. This sequence supports land-and-expand behavior across the sustainability performance management software market, as the first application often opens the door to subsequent linked modules. It also means vendors that start with reporting can still grow wallet share if they offer credible pathways into operational use cases.
By Enterprise Size:
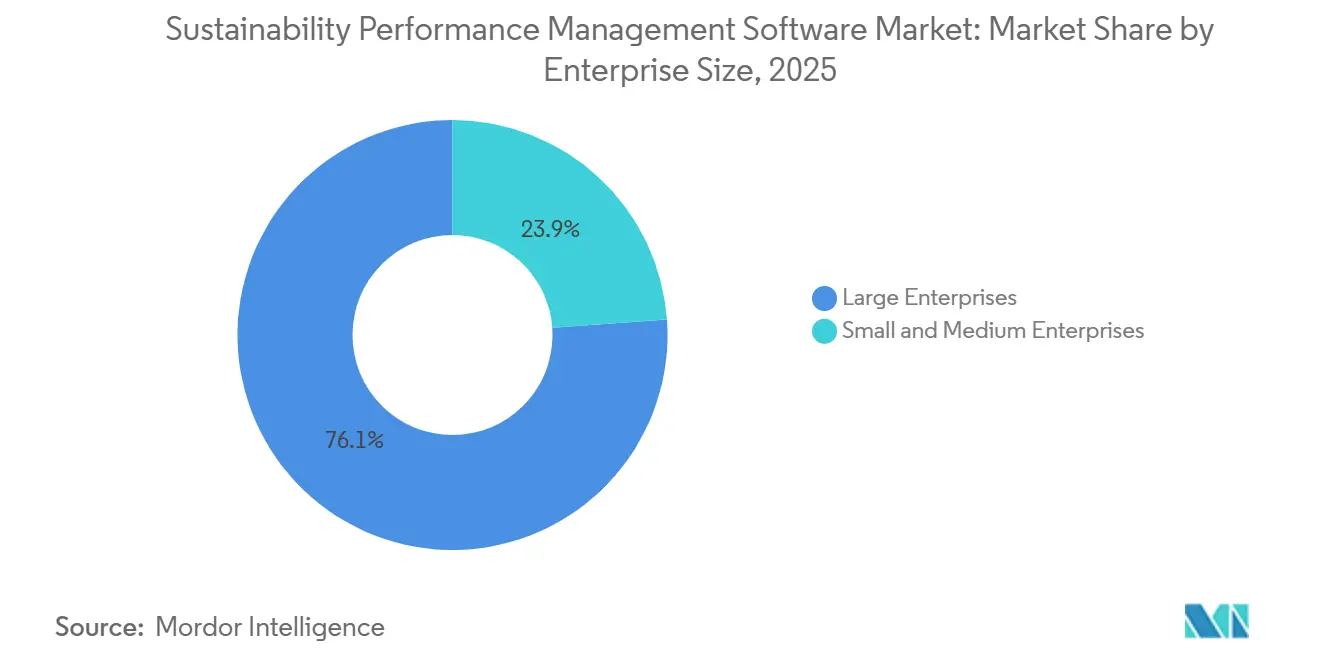
Large Enterprises Anchor Revenue While SMEs Add MomentumLarge enterprises held 76.14% of the sustainability performance management software market share in 2025, reflecting the fact that the earliest adoption wave favored organizations with broader regulatory exposure, more complex operating footprints, and stronger IT budgets. These buyers usually manage more sites, more suppliers, more jurisdictions, and more assurance expectations, so the cost of staying with manual reporting is higher and easier to justify against platform spending. They also tend to demand stronger governance, better evidence management, and cleaner integration with finance and enterprise systems, which raises the performance bar for vendors serving the upper end of the market. In the sustainability performance management software market, the market keeps enterprise-tier competitors focused on control depth, cross-framework usability, and the ability to scale across multiple business units without breaking data consistency.
SMEs are projected to grow at a 17.93% CAGR through 2031, indicating that the next expansion wave is being shaped by supply-chain pressures as much as by direct regulation. Smaller companies increasingly need to provide structured emissions and sustainability data because large customers require those inputs for their own disclosures, supplier screening, and product footprint calculations. This makes easier deployment, lighter workflows, and managed support more valuable, since many of these buyers do not have dedicated teams to run complex sustainability programs on their own. The sustainability performance management software market is therefore widening into a more layered structure where enterprise-grade platforms and simpler mid-market configurations can both find room to grow. In the sustainability performance management software industry, this shift also supports greater partnership and acquisition activity as larger vendors seek faster access to SME customer bases and lighter implementation models.
By End-Use Industry:
Manufacturing Holds The Lead While Utilities Advance QuicklyManufacturing accounted for 21.18% of the sustainability performance management software market in 2025, reflecting the sector’s complex facility emissions, supplier-heavy value chains, and growing need for product-level carbon information. Manufacturers often face reporting needs that go beyond corporate totals, as customers, regulators, and investors increasingly demand data traceable to products, plants, materials, and sourcing decisions. UL Solutions launched ULTRUS UL 360 in May 2026 to help manufacturing and procurement teams calculate product carbon footprints using supplier-provided primary emissions data, indicating where software demand is deepening within this user group. IBM Envizi’s Supply Chain Intelligence module reinforces this direction by helping companies aggregate supplier- and transaction-level data for Scope 3 purchased goods and services calculations.
Energy and utilities are projected to expand at a 17.53% CAGR through 2031, which reflects pressure to demonstrate measurable decarbonization progress while also supporting climate-related financial disclosures and scenario analysis. The sector has high visibility, large emissions profiles, and a direct link between operational change and reporting expectations, making continuous data management more important than static annual reporting. BFSI, IT and telecom, retail and e-commerce, construction and infrastructure, and government and public sector also broaden the revenue base, because each group brings different combinations of portfolio disclosure, energy use, supplier oversight, or public accountability. This range shows that the sustainability performance management software market is no longer tied to one narrow buyer group, but is spreading across sectors with very different operating models and data maturity levels. It also indicates that vendors need configurable workflows rather than rigid templates to effectively serve the full set of end-use requirements.
Geography Analysis
The Americas Sustainability Performance Management Software Market
North America held 34.53% of the sustainability performance management software market share in 2025, maintaining its leading regional position as buyers respond to formal reporting requirements and strong enterprise software adoption. The U.S. market benefits from the SEC's climate disclosure rule, while California’s SB 253 and SB 261 add further pressure on large companies to report on emissions and climate-related financial reporting. This region also has an advantage in installed enterprise systems, which reduces friction when companies add sustainability layers to finance, procurement, and reporting workflows. Canada adds another source of demand through climate risk disclosure expectations for federally regulated financial institutions, which supports adoption in finance-led use cases. South America remains smaller, but the sustainability performance management software market continues to gain relevance there as exporters and larger listed companies face growing expectations from customers, investors, and overseas compliance chains.
Europe Sustainability Performance Management Software Market
Europe represents the deepest compliance-led demand environment in 2026, because companies often need to align several sustainability-related frameworks rather than just one disclosure requirement. That raises the value of platforms that can reuse the same data across reporting, assurance, taxonomy mapping, and supplier oversight tasks without the need for repeated manual work. The sustainability performance management software market is, therefore, well placed in Europe, where workflow breadth can matter as much as the final report itself. Workiva’s May 2026 update to its sustainability platform, which added Simplified ESRS Intelligence after EFRAG published draft simplified standards, reflects how software providers are responding to evolving European reporting needs with faster product support.
APAC and MEA Sustainability Performance Management Software Market
Asia-Pacific is the fastest-growing regional segment, with a 17.83% CAGR through 2031, suggesting a large expansion runway as companies across the region build more formal sustainability data systems. Growth in the sustainability performance management software market across Asia-Pacific is supported by rising disclosure expectations, growing supplier-data demands from multinational customers, and a broad shift toward more structured ESG reporting processes. Many companies in the region are building formal workflows for the first time, creating space for vendors that can offer scalable onboarding, lighter deployment models, and stronger supplier connectivity. The Middle East and Africa are still smaller, but enterprise sustainability programs are becoming more structured as national transition agendas, capital-market expectations, and listed-company reporting needs mature. The sustainability performance management software market should therefore see its next layer of geographic expansion increasingly come from regions that are still earlier in the system adoption cycle, even though North America and Europe remain the most established demand centers today.
Competitive Landscape
The sustainability performance management software market is moderately concentrated at the enterprise tier, where large ERP-embedded vendors compete against purpose-built reporting and sustainability specialists. SAP, IBM, Salesforce, and Microsoft bring broad enterprise relationships and installed system access, while Workiva, Wolters Kluwer’s Enablon, and Sphera compete with stronger reporting or domain-specific focus. That split matters because the winning factor is often not only feature breadth, but also where the vendor already sits inside the customer’s operating stack and control environment. SAP’s Green Ledger is a clear strategic move in this direction because it brings carbon accounting closer to transaction-level financial workflows, which makes sustainability data harder to separate from core finance processes. As a result, the sustainability performance management software market continues to reward vendors that can integrate sustainability data into a broader control architecture rather than treating it as a stand-alone reporting layer.
Strategic activity in 2026 has centered on AI, supplier data quality, and migrating manual workflows into governed software environments. IBM launched Envizi Emissions Calculations in Excel in April 2026 to help organizations move fragmented greenhouse gas calculations into a more scalable, auditable process, targeting companies still early in their system maturity. EcoVadis and Workiva also announced a May 2026 partnership that connects EcoVadis’ Carbon Data Network with Workiva Carbon, which strengthens the path from supplier data collection to governed disclosure. Schneider Electric made another move in January 2026, introducing Resource Advisor+ with Carbon Performance and Supply Chain products, and planned to release further modules later in 2026.
Mid-market competition remains active because many customers still want faster deployment, narrower scope, and lighter service demands than top-tier enterprise suites usually provide. White space remains in double materiality support, climate risk quantification tied directly to financial outcomes, and portfolio-level Scope 3 tracking for financial institutions, so the field is not closed to product specialization. Vendors that can demonstrate stronger audit trails, easier data ingestion, and greater supplier network participation tend to stand out earlier in buying cycles, especially when compliance deadlines are near. The sustainability performance management software market also remains open to partnerships and smaller acquisitions, as regulatory breadth is expanding faster than many individual product roadmaps. This keeps the sustainability performance management software market competitive, with clear leaders at the enterprise end but enough fragmentation elsewhere to prevent a winner-take-all structure.
Sustainability Performance Management Software Industry Leaders
-
SAP SE
-
Salesforce, Inc.
-
Microsoft Corporation
-
Persefoni AI, Inc.
-
Watershed Technology, Inc.
- *Disclaimer: Major Players sorted in no particular order
Sustainability Performance Management Software Market Companies Covered in this Report
- Workiva Inc.
- Wolters Kluwer N.V.
- SAP SE
- IBM Corporation
- Salesforce, Inc.
- Sphera Solutions, Inc.
- Schneider Electric SE
- Intelex Technologies ULC
- Cority Software Inc.
- UL Solutions Inc.
- Microsoft Corporation
- Diligent Corporation
- ServiceNow, Inc.
- EcoVadis SAS
- OneTrust, LLC
- Benchmark Digital Partners LLC
- Persefoni AI, Inc.
- FigBytes Inc.
- Quentic GmbH
- IsoMetrix Software (Pty) Ltd.
Recent Industry Developments in Sustainability Performance Management Software Market
- May 2026: SAP announced new sustainability AI agents at SAP Sapphire 2026, to be generally available by year-end 2026. The Footprint Optimization Agent reduces Scope 1, Scope 2, and Scope 3 scenario simulation time from approximately one working day to 20 minutes, and the Sustainability Regulatory Readiness Agent automates CSRD and IFRS S1/S2 materiality-to-regulatory data mapping, delivering over 50% reduction in manual compliance review hours for packaging compliance workflows.
- May 2026: UL Solutions launched ULTRUS UL 360, an AI-powered product carbon footprint software capability for manufacturing and procurement teams, enabling repeatable calculation of product-level carbon footprints from supplier-provided primary emissions data to support CSRD, CDP, and SBTi disclosures.
- May 2026: EcoVadis and Workiva announced a strategic partnership connecting EcoVadis’ Carbon Data Network with Workiva Carbon, enabling enterprise customers to replace industry-average Scope 3 estimates with primary supplier data in an audit-grade, governed calculation and disclosure environment.
- April 2026: IBM launched Envizi Emissions Calculations in Excel, designed for sustainability teams transitioning from manual GHG calculation workflows toward scalable enterprise reporting and audit processes, enabling organizations to consolidate emissions data into a single, auditable system of record.
Global Sustainability Performance Management Software Market Report Scope
The Sustainability Performance Management Software market refers to platforms and services that enable organizations to monitor, measure, and optimize their environmental, social, and governance (ESG) performance across operations. These solutions provide functionalities such as environmental performance tracking, carbon and emissions management, resource and waste optimization, compliance management, and sustainability reporting. By embedding sustainability intelligence into enterprise workflows, these platforms help organizations reduce environmental impact, ensure regulatory compliance, enhance transparency, and align with global ESG frameworks. Ultimately, they support enterprises in achieving operational efficiency, strengthening stakeholder trust, and driving long-term resilience through sustainable business practices.
The Sustainability Performance Management Software market report is segmented by Component (Software, and Service), Deployment Type (Cloud-Based, On-Premise, and Hybrid), Application (Environmental Performance Management, Carbon and Emissions Management, Resource and Waste Management, Sustainability Compliance Management, and ESG and Sustainability Reporting), Enterprise Size (Large Enterprises, and Small and Medium Enterprises), End-Use Industry (IT and Telecom, BFSI, Manufacturing, Energy and Utilities, Retail and E-Commerce, Construction and Infrastructure, Government and Public Sector, and Other End-User Industries), and Geography (North America, South America, Europe, Asia-Pacific, Middle East, and Africa). The Market Forecasts are Provided in Terms of Value (USD).
Segmentation Overview
| Software |
| Service |
| Cloud Based |
| On Premise |
| Hybrid |
| Environmental Performance Management |
| Carbon and Emissions Management |
| Resource and Waste Management |
| Sustainability Compliance Management |
| ESG and Sustainability Reporting |
| Large Enterprises |
| Small And Medium Enterprises |
| IT and Telecom |
| BFSI |
| Manufacturing |
| Energy and Utilities |
| Retail and E-Commerce |
| Construction and Infrastructure |
| Government and Public Sector |
| Other End-User Industries |
| North America | United States | |
| Canada | ||
| Mexico | ||
| South America | Brazil | |
| Argentina | ||
| Rest of South America | ||
| Europe | Germany | |
| United Kingdom | ||
| France | ||
| Italy | ||
| Spain | ||
| Russia | ||
| Rest of Europe | ||
| Asia-Pacific | China | |
| India | ||
| Japan | ||
| South Korea | ||
| Australia | ||
| Rest of Asia-Pacific | ||
| Middle East and Africa | Middle East | Saudi Arabia |
| United Arab Emirates | ||
| Rest of Middle East | ||
| Africa | South Africa | |
| Nigeria | ||
| Rest of Africa | ||
| By Component | Software | ||
| Service | |||
| By Deployment Type | Cloud Based | ||
| On Premise | |||
| Hybrid | |||
| By Application | Environmental Performance Management | ||
| Carbon and Emissions Management | |||
| Resource and Waste Management | |||
| Sustainability Compliance Management | |||
| ESG and Sustainability Reporting | |||
| By Enterprise Size | Large Enterprises | ||
| Small And Medium Enterprises | |||
| By End-Use Industry | IT and Telecom | ||
| BFSI | |||
| Manufacturing | |||
| Energy and Utilities | |||
| Retail and E-Commerce | |||
| Construction and Infrastructure | |||
| Government and Public Sector | |||
| Other End-User Industries | |||
| By Geography | North America | United States | |
| Canada | |||
| Mexico | |||
| South America | Brazil | ||
| Argentina | |||
| Rest of South America | |||
| Europe | Germany | ||
| United Kingdom | |||
| France | |||
| Italy | |||
| Spain | |||
| Russia | |||
| Rest of Europe | |||
| Asia-Pacific | China | ||
| India | |||
| Japan | |||
| South Korea | |||
| Australia | |||
| Rest of Asia-Pacific | |||
| Middle East and Africa | Middle East | Saudi Arabia | |
| United Arab Emirates | |||
| Rest of Middle East | |||
| Africa | South Africa | ||
| Nigeria | |||
| Rest of Africa | |||
Key Questions Answered in the Report
What is the current size and forecast for sustainability performance management software?
The sustainability performance management software market was valued at USD 5.36 billion in 2025, reached USD 6.01 billion in 2026, and is forecast to reach USD 11.59 billion by 2031 at a 14.04% CAGR.
What is driving demand for sustainability performance management software in 2026?
The strongest demand drivers are formal disclosure rules, growing need for verifiable ESG data, rising supplier-data requirements, and AI tools that improve audit readiness and reduce manual review work.
Which application area is expanding the fastest?
Carbon and Emissions Management is the fastest-growing application, with an 18.73% CAGR through 2031, as companies move from annual reporting toward deeper operational carbon tracking.
Which customer group accounts for most spending today?
Large enterprises held 76.14% of revenue in 2025 because they face broader regulatory exposure, more complex operations, and larger data integration needs than smaller firms.
Which region offers the strongest growth outlook?
Asia-Pacific has the fastest regional growth outlook with a 17.83% CAGR through 2031, supported by rising disclosure expectations and growing demand for structured supplier data.
Which end-use sector is the biggest buyer today?
Manufacturing led with 21.18% of revenue in 2025 because product footprints, multi-site emissions, and supplier reporting needs make sustainability data management especially complex in this sector.