Property Management Software Market Size and Share
Market Overview
| Study Period | 2020 - 2031 |
|---|---|
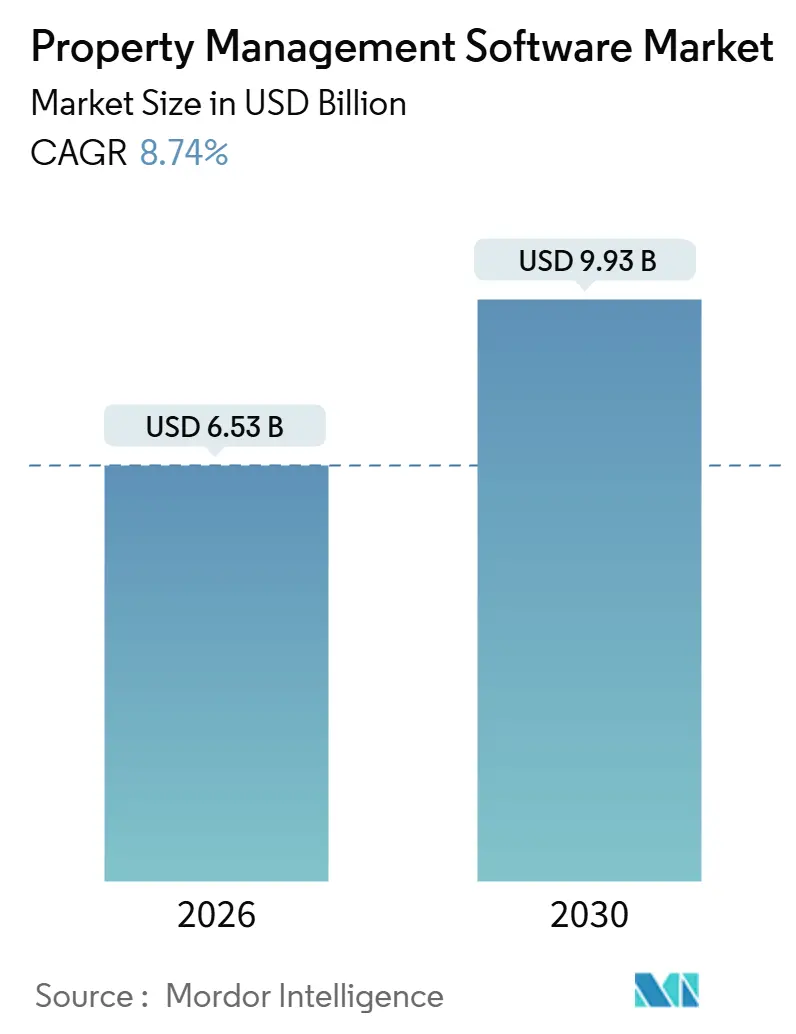
| Market Size (2026) | USD 6.53 Billion |
| Market Size (2031) | USD 9.93 Billion |
| Growth Rate (2026 - 2030) | 8.74% CAGR |
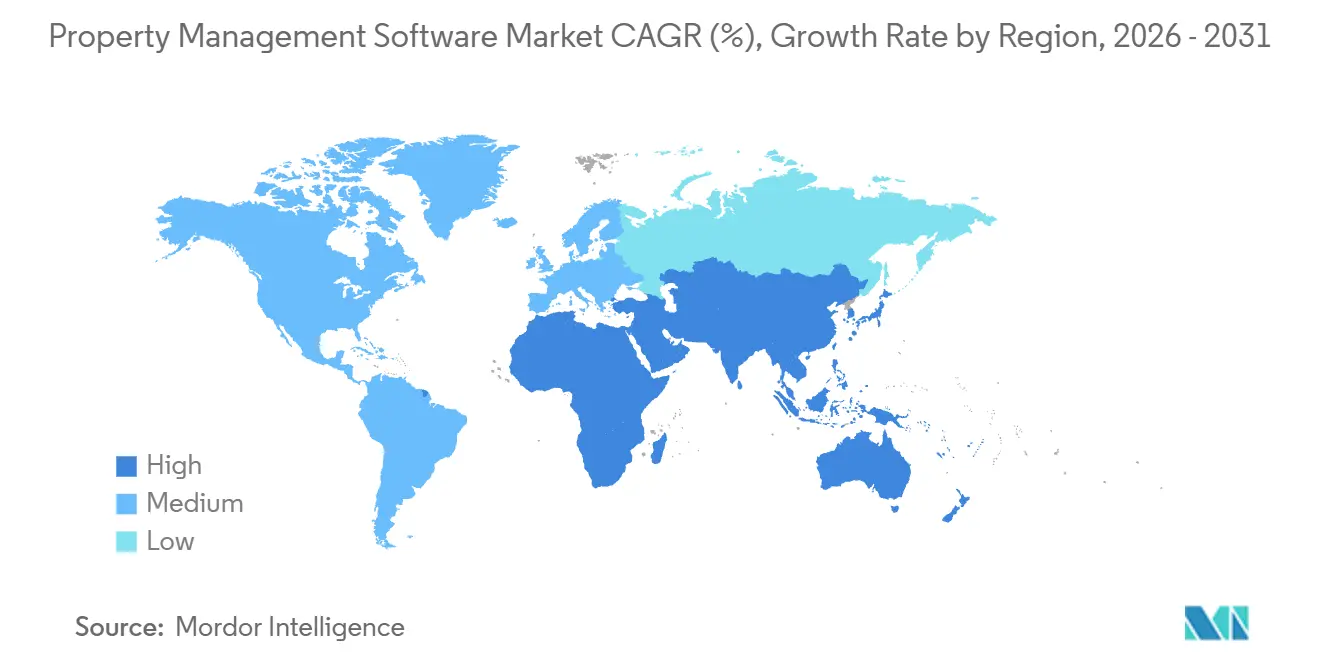
| Fastest Growing Market | Asia Pacific |
| Largest Market | North America |
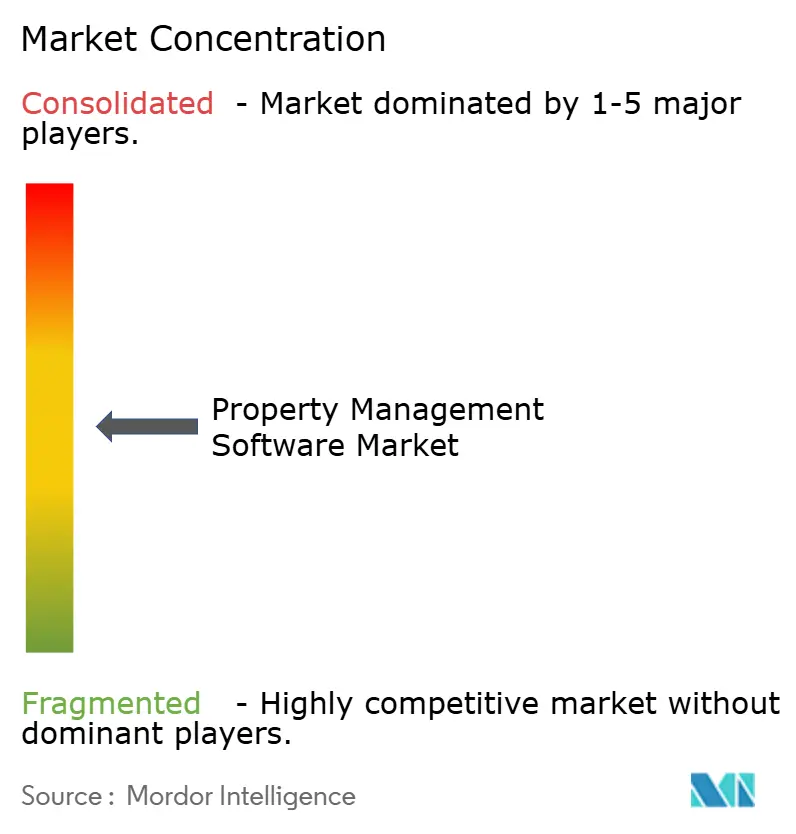
| Market Concentration | Medium |
Major Players *Disclaimer: Major Players sorted in no particular order Image © Mordor Intelligence. Reuse requires attribution under CC BY 4.0. | |
Property Management Software Market Analysis by Mordor Intelligence
The property management software market size reached USD 6.53 billion in 2026 and is projected to climb to USD 9.93 billion by 2031, reflecting an 8.74% CAGR. Robust demand stems from institutional investors upgrading fragmented on-premises tools to cloud platforms that automate lease accounting, predictive maintenance, and integrated payments. In North America and Europe, mandatory compliance with ASC 842 and IFRS 16 continues to drive strong adoption momentum, while real-time payment rails embedded in tenant portals reduce Days Sales Outstanding and generate new fee-income streams. Asia Pacific capital inflows into build-to-rent, student housing, and co-living assets add another layer of structural demand, particularly as regional landlords favor mobile-first applications that scale across jurisdictions. Although data-security breaches and venture-funding pullbacks weigh on sentiment, measurable operating-expense reductions and ancillary revenue opportunities continue to underpin long-term growth.
Key Report Takeaways
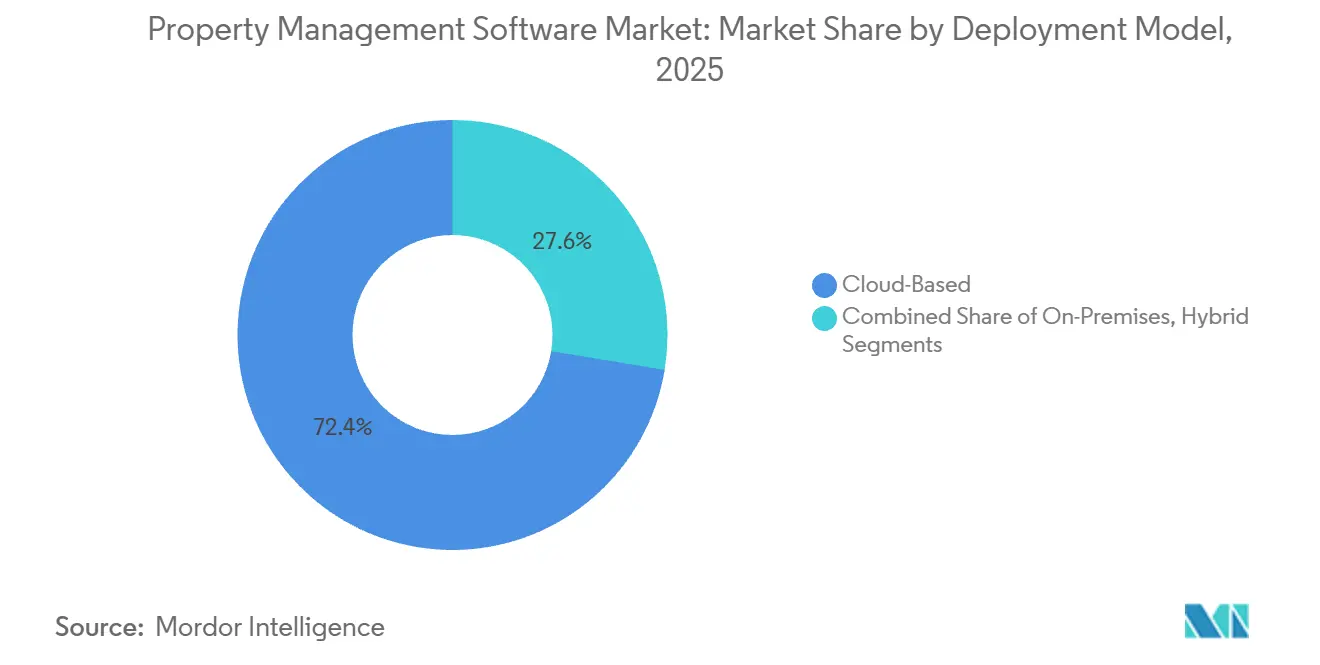
- By deployment model, cloud solutions captured 72.41% of the 2025 revenue, while hybrid architectures are expected to expand at a 9.12% CAGR through 2031.
- By property type, residential assets held 58.19% of 2025 spending, whereas industrial and logistics units are advancing at a 10.34% CAGR.
- By end user, property managers and agents accounted for 42.73% of 2025 outlays, but facilities-management firms are projected to grow at an 11.12% CAGR.
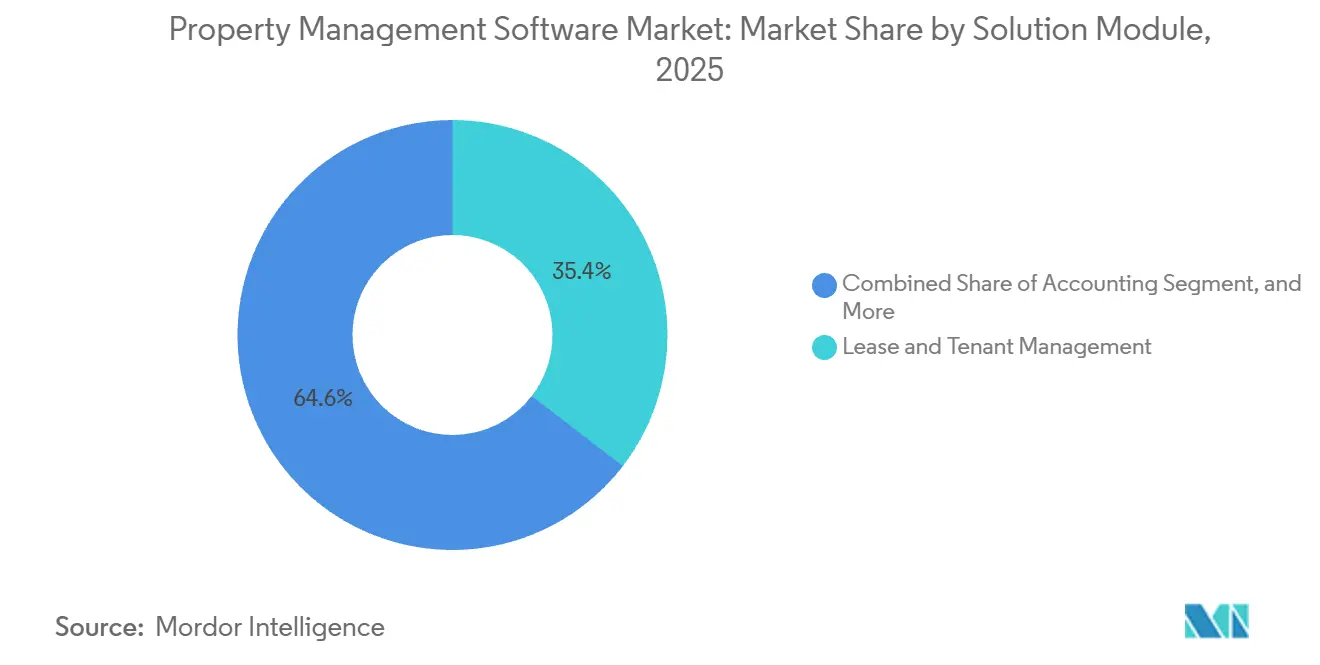
- By solution module, lease and tenant management accounted for 35.44% of 2025 sales, while integrated payments are rising at a 10.77% CAGR.
- By organization size, mid-sized portfolios (501-5,000 units) secured 46.93% of 2025 turnover, while small operators (1-500 units) are digitizing at an 11.13% CAGR.
- By geography, North America retained 40.27% of 2025 revenue, whereas Asia Pacific is forecast to expand at a 13.44% CAGR to 2031.
Note: Market size and forecast figures in this report are generated using Mordor Intelligence’s proprietary estimation framework, updated with the latest available data and insights as of January 2026.
Global Property Management Software Market Trends and Insights
Drivers Impact Analysis*
| Driver | (~) % Impact on CAGR Forecast | Geographic Relevance | Impact Timeline |
|---|---|---|---|
| Growing Adoption of Cloud-Based SaaS Platforms | +2.1% | Global, highest penetration in North America and Europe | Medium term (2-4 years) |
| Rising Demand for Integrated Tenant and Lease Automation | +1.8% | North America and Asia Pacific, expanding to Europe and Middle East | Short term (≤ 2 years) |
| Expansion of Real-Estate Portfolios by Institutional Investors | +1.5% | Asia Pacific core, spill-over to Middle East and North America | Long term (≥ 4 years) |
| Compliance Pressure (ASC 842/IFRS 16) Boosting Software Uptake | +1.3% | North America and Europe, emerging in Asia Pacific | Short term (≤ 2 years) |
| Convergence of Property Management and Embedded FinTech | +1.2% | Global, led by North America and select Asia Pacific markets | Medium term (2-4 years) |
| AI-Powered Predictive Maintenance for OPEX Reduction | +0.9% | North America and Europe, pilot deployments in Asia Pacific | Medium term (2-4 years) |
| Source: Mordor Intelligence | |||
Growing Adoption of Cloud-Based SaaS Platforms
Cloud deployment eliminates server overhead, cuts IT staffing needs, and provides continuous feature releases that keep portfolios current. Mid-sized landlords report a 30-40% lower total cost of ownership compared to perpetual-license models, while mobile-optimized workflows enable leasing teams to operate from any device. Multi-tenant architectures also accelerate geographic expansion because new property instances spin up in hours, a critical edge for investors closing cross-border acquisitions. Finally, open APIs transform modern platforms into orchestration layers that connect accounting software, payment gateways, and Internet-of-Things sensors, creating a unified data fabric that enhances decision-making quality.
Rising Demand for Integrated Tenant and Lease Automation
Automated document generation, renewal notifications, and escalation calculations now displace manual clerical tasks that once consumed up to 30% of a property manager’s labor hours. Tenant portals supporting maintenance requests, digital rent payments, and self-service renewals lift Net Promoter Scores while shrinking administrative costs. Instant-payment functionality, expected to be in use by 59% of property managers by 2028, transforms monthly billing cycles into real-time cash management, and auto-populated lease abstracts reduce acquisition due diligence timelines from weeks to days.
Compliance Pressure (ASC 842/IFRS 16) Boosting Software Uptake
New lease-accounting rules require granular tracking of payment schedules, discount rates, and modifications, tasks ill-suited for spreadsheets. Audit-ready journal entries, data governance controls, and integrated disclosure reports embedded in purpose-built platforms have thus become essential. Post-implementation reviews confirm that the standards enhanced transparency but also added operational complexity, reinforcing the transition to automated software that streamlines classification and amortization workflows.[1]International Financial Reporting Standards Foundation, “IFRS 16 Post-Implementation Review,” IFRS.ORG
AI-Powered Predictive Maintenance for OPEX Reduction
Machine-learning models that ingest work-order histories and sensor feeds forecast equipment failures before they occur, enabling scheduled fixes that avoid emergency premiums. Case studies demonstrate 30-40% energy cost savings and 12-18% reductions in total operating expenses, with return-on-investment ratios exceeding 4:1. As sustainability mandates become increasingly stringent, predictive maintenance further supports this by optimizing water usage and carbon footprints, thereby integrating asset performance into broader environmental, social, and governance metrics.
Restraints Impact Analysis*
| Restraint | (~) % Impact on CAGR Forecast | Geographic Relevance | Impact Timeline |
|---|---|---|---|
| Data-Security and Privacy Concerns in Multi-Tenant SaaS | -1.4% | Global, heightened scrutiny in North America and Europe | Short term (≤ 2 years) |
| High Switching Costs from Legacy Systems | -1.1% | North America and Europe, where legacy penetration is highest | Medium term (2-4 years) |
| Fragmented Property-Data Standards Hindering Interoperability | -0.8% | Global, particularly acute in Asia Pacific and Middle East | Long term (≥ 4 years) |
| Tightening PropTech Venture Funding Cycle Post-2022 | -0.6% | Global, pronounced impact in North America and Europe | Short term (≤ 2 years) |
| Source: Mordor Intelligence | |||
Data-Security and Privacy Concerns in Multi-Tenant SaaS
Recent breaches at Essex Property Trust, TELACU Community Capital, and Berkeley Rent Registry have exposed tens of thousands of tenant records, triggering regulatory probes and prompting buyers to demand SOC 2 Type II audits, penetration tests, and cyber insurance from vendors. Compliance costs rise in tandem, lengthening sales cycles and prompting some landlords to consider hybrid deployments that keep sensitive data on local servers.[2]Massachusetts Attorney General, “Property Management Data Breach Settlement,” MASS.GOV
High Switching Costs from Legacy Systems
Large portfolios often maintain customized integrations linking property databases to accounting, procurement, and HR platforms. Migrating these bespoke workflows to new cloud architectures requires extensive data cleansing, API mapping, and staff retraining. As a result, decision timelines stretch, and the perceived risk of modernization slows despite clear long-term efficiency gains.
*Our forecasts treat driver/restraint impacts as directional, not additive. The impact forecasts reflect baseline growth, mix effects, and variable interactions.
Segment Analysis
By Deployment Model: Hybrid Adoption Balances Sovereignty and Scale
Hybrid architectures are expanding at a 9.12% CAGR, outpacing the overall property management software market. Operators with multinational portfolios use local servers for personally identifiable information while utilizing the cloud for analytics, gaining compliance with data-residency laws without sacrificing elasticity. In contrast, cloud solutions continue to dominate with a 72.41% market share in property management software in 2025, primarily because they minimize upfront capital expenditures and provide continuous updates. Over time, phased migration strategies prioritize low-risk workflows first, followed by financial modules once security reviews are complete, thereby accelerating the growth of the property management software market for hybrid tools as regulations become more stringent.
Cloud maintenance automation also cuts emergency repairs by 40% and maintenance costs by 30%, tangible proof points that convince risk-averse landlords to shift critical workloads. Government agencies that once specified on-premises deployments now publish hybrid best practices, encouraging operators to classify data and align storage locations accordingly. As artificial-intelligence models demand more compute power, this dual-environment setup lets firms train in the cloud but run inference locally to reduce latency, reinforcing hybrid’s long-term role within the property management software market.


By Property Type: Industrial and Logistics Accelerate on Fulfillment Demand
Residential assets led 2025 spending, reflecting a 58.19% property management software market share; however, warehouses and distribution centers are growing fastest at a 10.34% CAGR. E-commerce operators rely on specialized lease-management features that handle complex rent structures, cross-dock scheduling, and space utilization analytics, driving the property management software market size for industrial applications upward over the forecast period. Student housing, senior living, and co-living formats each add unique workflow requirements, broadening vendor addressable segments.
Office and retail managers, meanwhile, integrate foot-traffic and occupancy analytics to renegotiate flexible leases, while hospitality operators blend nightly reservations and monthly tenancies within unified systems. Mixed-use projects require consolidated financial statements that allocate expenses across asset classes, prompting investors to standardize on multi-module suites. This diversity of needs encourages vendors to maintain configurable templates, ensuring growth in every property vertical.
By End User: Facilities-Management Firms Seek IWMS Convergence
Property managers and agents controlled 42.73% of 2025 expenditure, but facilities-management firms are advancing at an 11.12% CAGR as corporations outsource building operations. These firms seek an Integrated Workplace Management System (IWMS) view that consolidates lease obligations, space allocation, and preventive maintenance under one platform, thereby expanding the property management software market dedicated to complex corporate estates. Housing associations center on compliance automation for rent subsidies, while investors demand dashboards that benchmark assets and model potential acquisitions.
Facilities specialists servicing life-science labs and data centers require uptime tracking and vendor-certification management to meet stringent regulator audits, a niche driving premium software tiers. Hybrid work trends amplify demand for desk-reservation analytics, enabling corporates to right-size their footprints and lower rent expenses, presenting a clear return-on-investment story that propels continued uptake.
By Solution Module: Integrated Payments Monetize Rent Flows
Lease and tenant management remains foundational with a 35.44% revenue share in 2025, but integrated payments are expanding at a 10.77% CAGR, the swiftest among modules. Embedded fintech enables managers to capture interchange fees and generate float income, transforming software from a cost center into a revenue driver within the property management software market. Automation also enforces local rent-control rules, reducing legal exposure.
Analytics add another layer, forecasting rent growth and occupancy risk with machine-learning models trained on historical patterns. Generative-AI assistants draft leases and answer resident questions, trimming administrative burden by double-digit percentages. As modules converge, platform vendors upsell advanced functionality, lifting average revenue per unit and solidifying long-term contracts.
By Organization Size: Freemium Tiers Unlock Small-Landlord Digitization
Mid-sized portfolios accounted for 46.93% of the 2025 spend, as they strike a balance between scale economies and agile decision-making processes. In contrast, landlords managing up to 500 units showed the fastest growth at an 11.13% CAGR. Low-cost or free entry plans, mobile interfaces, and transaction-based monetization models make enterprise-grade capability accessible to nonprofessional owners, expanding the user base of the property management software market. Larger portfolios, although smaller in number, require API ecosystems, multi-entity consolidation, and advanced security, which sustain a lucrative premium tier.
Graduation paths see small owners migrate from freemium tools to paid subscriptions as their portfolios grow, ensuring an expansion of customer lifetime value. Vendors segment product lines accordingly, dedicating engineering resources to both simplified and enterprise versions without fragmenting codebases, a strategy that maximizes share across organization sizes.
Geography Analysis
North America accounted for 40.27% of 2025 revenue, leveraging mature multifamily markets, stringent accounting rules, and widespread embedded fintech usage. U.S. rent-control ordinances and state privacy acts also prompt landlords to adopt software that automates compliance and breach reporting. Canada’s growing purpose-built rental stock and Mexico’s rising middle class present incremental gains despite regulatory complexity and currency risk.
Asia Pacific is the fastest-growing region, set to register a 13.44% CAGR through 2031. Institutional capital earmarked for build-to-rent in Australia, student housing in China, and co-living in India drives platform demand, while logistics expansion across Southeast Asia boosts industrial modules. Residential allocations among ANREV members increased from 11% to 16% between 2020 and 2025, signaling a structural shift in appetite for technology that professionalizes asset management.[3]Asia Pacific Institutional Real Estate Association, “ANREV Data and Research,” ANREV.ORG Rising smartphone penetration and government digitalization agendas further accelerate uptake.
Europe combines mature markets in the United Kingdom, Germany, and France with developing ones in Southern and Eastern countries, where European Union funding modernizes real estate management. The General Data Protection Regulation favors providers with local data centers, and energy-efficiency directives spur adoption of predictive-maintenance features. The Middle East experiences rapid real-estate diversification tied to giga-projects, while South America’s growth remains sensitive to political and currency volatility. Africa shows early traction in Kenya and Nigeria but continues to lag because of infrastructure gaps.

Competitive Landscape
The property management software market is dominated by a core group of incumbent platform providers, including Yardi Systems, RealPage, and MRI Software, which together manage millions of residential and commercial units worldwide. Despite their scale, the combined share of the top five vendors is only about 45%, leaving space for specialists and new entrants. Private equity continues to drive consolidation, highlighted by Thoma Bravo’s USD 10.2 billion take-private of RealPage in April 2024. Buyers view that transaction as an affirmation of the sector’s sticky recurring revenue and upsell potential. MRI Software responded by acquiring MRI Qube to enhance its commercial property functionality and expand its reach in Europe and the Middle East.
Product roadmaps center on artificial intelligence that automates leasing, maintenance, and resident engagement. AppFolio introduced an AI Leasing Assistant in February 2024, which follows up with prospects and reduces time-to-lease by 15%. Entrata responded with ResidentGPT, a generative tool that drafts leases and resolves tenant inquiries, reducing the workload of leasing agents by 25%. RealPage has added On-Site Leasing, a tablet application that enables agents to sign leases in the field and syncs data with its AI Maintenance module. Yardi Systems focused on analytics, launching Yardi Kube to unify operational, accounting, and Internet-of-Things data for portfolios above 10,000 units.
Vertical specialists pursue white-space opportunities such as industrial logistics, single-family rentals, and student housing where tailored workflows can differentiate against broad suites. Open-API strategies have become table stakes because owners increasingly stitch together best-of-breed stacks and demand effortless data portability. Vendors that quantify value are winning competitive bids, with case studies from Re-Leased showing 12-18% operating-expense reductions and ROI multiples above 4x for properties using predictive maintenance. Conversely, providers that cannot demonstrate measurable savings face accelerated churn as customers migrate to platforms promising faster payback periods.
Property Management Software Industry Leaders
Yardi Systems, Inc.
RealPage, Inc.
MRI Software LLC
AppFolio, Inc.
Oracle Corporation
- *Disclaimer: Major Players sorted in no particular order

Recent Industry Developments
- January 2026: AppFolio rolled out PortfolioPulse, a cohort-analysis dashboard that identifies underperforming assets and simulates capital-improvement scenarios.
- November 2025: RealPage released ESG Manager, enabling landlords to track carbon emissions and automate reporting for global frameworks such as GRESB.
- September 2025: Berkeley Rent Registry disclosed a breach that impacted 60,000 renters, prompting regulators to issue new guidance on encryption standards for tenant data.
- July 2025: TELACU Community Capital reported a security incident exposing resident financial documents, leading the firm to mandate multi-factor authentication across all vendor systems.


Research Methodology Framework and Report Scope
Market Definitions and Key Coverage
Our study defines the property management software market as digital platforms that automate leasing, rent accounting, maintenance scheduling, and portfolio reporting for residential, commercial, and mixed-use properties worldwide. The assessment covers license and subscription revenues from newly deployed cloud, on-premise, and hybrid solutions that vendors actively support.
Scope Exclusion: ancillary professional services (facility outsourcing, brokerage commissions) and standalone IoT hardware do not fall within this analysis.
Segmentation Overview
- By Deployment Model
- Cloud-Based
- On-Premises
- Hybrid
- By Property Type
- Residential
- Multifamily
- Single-Family
- Student Housing
- HOA / Condo Associations
- Commercial
- Office
- Retail
- Industrial / Logistics
- Hospitality
- Mixed-Use
- Residential
- By End User
- Property Managers and Agents
- Housing Associations
- Property Investors
- Corporate Real-Estate Departments
- Facilities-Management Firms
- By Solution Module
- Lease and Tenant Management
- Accounting and Reporting
- Maintenance Management
- Marketing and Listing
- Integrated Payments
- Advanced Analytics and AI Tools
- By Organization Size
- Small (1-500 units)
- Mid (501-5 000 units)
- Large (>5 000 units)
- By Geography
- North America
- United States
- Canada
- Mexico
- South America
- Brazil
- Argentina
- Rest of South America
- Europe
- Germany
- United Kingdom
- France
- Italy
- Spain
- Russia
- Rest of Europe
- Asia Pacific
- China
- Japan
- South Korea
- India
- Australia
- New Zealand
- Rest of Asia Pacific
- Middle East
- United Arab Emirates
- Saudi Arabia
- Turkey
- Rest of Middle East
- Africa
- South Africa
- Nigeria
- Kenya
- Rest of Africa
- North America
Detailed Research Methodology and Data Validation
Primary Research
Interviews with property managers, prop-tech founders, and cloud integrators across North America, Europe, and Asia Pacific let Mordor analysts validate price bands, average units under management, and adoption timelines that rarely surface in documents. These conversations close information gaps and reinforce final assumptions.
Desk Research
We begin by mapping the addressable property pool through sources such as United States Census Bureau rental vacancy surveys, Eurostat building-permit series, and the National Apartment Association's operating cost benchmarks. Annual reports and 10-Ks filed by listed real-estate trusts help our team link unit counts to software spend. To cross-check revenue signals, our analysts extract import-export shipment tags from Volza, scan patent filings in Questel for emerging functionalities, and monitor funding news via Dow Jones Factiva. This roster is illustrative only; many other public and paid references underpin our desk work.
Market-Sizing & Forecasting
A top-down model reconstructs demand from occupied rental stock, turnover rates, and software penetration. We then cross-verify totals through selective bottom-up roll-ups of supplier revenues and sampled subscription prices, adjusting for freemium tiers and regional discounts. Key variables include gross rental receipts, new housing starts, cloud adoption ratios, landlord digitization incentives, and compliance triggers such as ASC-842 lease rules. Multivariate regression on lagged rental receipts and cloud-spend indices underpins the five-year forecast; coefficient gaps identified during expert calls are filled before re-running the model.
Data Validation & Update Cycle
Outputs face variance checks against housing and ICT spend indices, followed by senior analyst review. Models refresh each year, with interim updates whenever large acquisitions, regulatory shifts, or currency swings materially alter inputs.
Why Mordor's Property Management Software Baseline Commands Reliability
Published estimates often diverge because firms mix service revenues, apply differing inflation treatments, or refresh on uneven schedules. By declaring a software-only scope and updating annually, Mordor Intelligence offers decision-makers a baseline they can defend.
Key gap drivers are clear. Some studies bundle facility services and hospitality platforms, while others inflate totals by using list pricing or one-off spot exchange rates. Our disciplined approach filters those elements before modeling.
Benchmark comparison
| Market Size | Anonymized source | Primary gap driver |
|---|---|---|
| USD 6.0 Billion (2025) | Mordor Intelligence | - |
| USD 26.55 Billion (2025) | Global Consultancy A | Includes building services and hospitality platforms, much broader scope |
| USD 27.95 Billion (2025) | Industry Analyst B | Counts implementation services and applies undiscounted list prices |
| USD 5.81 Billion (2024) | Research House C | Omits small-landlord segment and uses conservative cloud-uptake weights |
The external figures of USD 26.55 billion, USD 27.95 billion, and USD 5.81 billion derive from publicly available report pages. Our 2025 value, sourced from the transparent steps above, gives clients a balanced, traceable baseline.


Key Questions Answered in the Report
How large is the property management software market in 2026?
It totaled USD 6.53 billion in 2026 and is on course to reach USD 9.93 billion by 2031.
What is driving rapid growth in Asia Pacific?
Institutional investment in build-to-rent, student housing, and logistics facilities is fueling a 13.44% CAGR through 2031.
Which deployment model is growing fastest?
Hybrid architectures are advancing at a 9.12% CAGR as landlords balance data sovereignty with cloud scalability.
Why are integrated payments important for operators?
Embedded fintech allows managers to capture interchange fees, speed cash application, and cut Days Sales Outstanding.
What security concerns affect adoption?
Recent multi-tenant SaaS breaches have heightened demand for SOC 2 audits, encryption, and hybrid options to safeguard tenant data.
Which end-user group is expanding most quickly?
Facilities-management firms are growing at an 11.12% CAGR because corporate real-estate departments seek unified IWMS platforms.
Page last updated on:


