Smart Surfaces Market Size and Share
Market Overview
| Study Period | 2020 - 2031 |
|---|---|
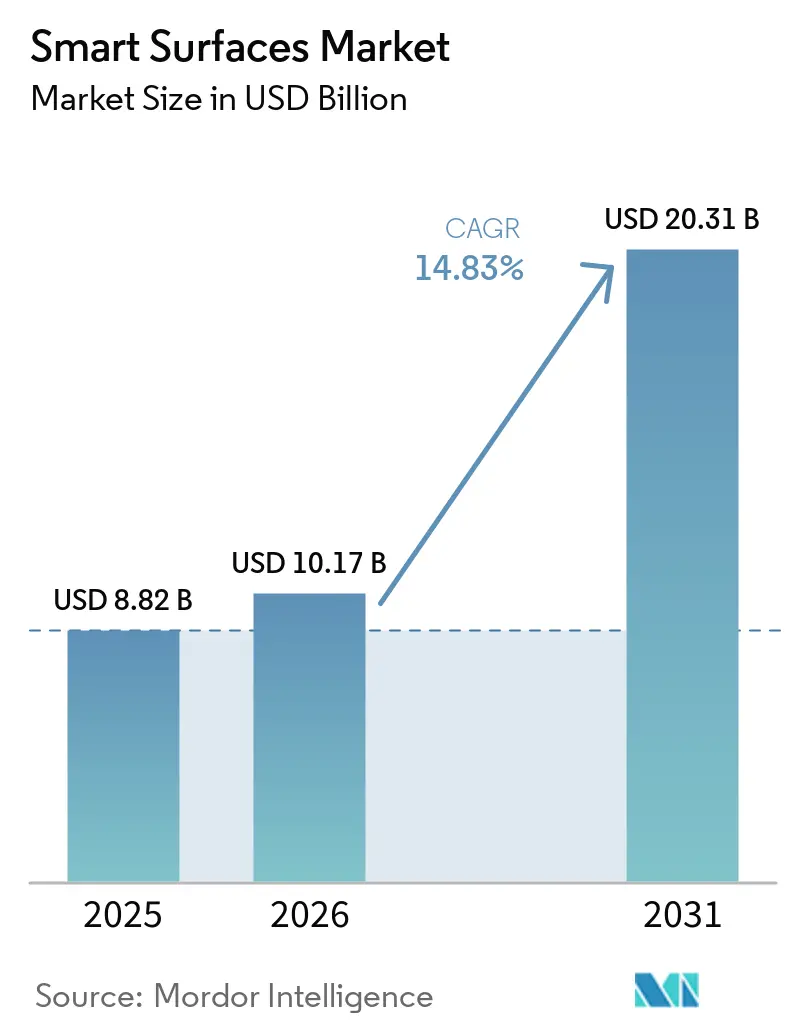
| Market Size (2026) | USD 10.17 Billion |
| Market Size (2031) | USD 20.31 Billion |
| Growth Rate (2026 - 2031) | 14.83% CAGR |
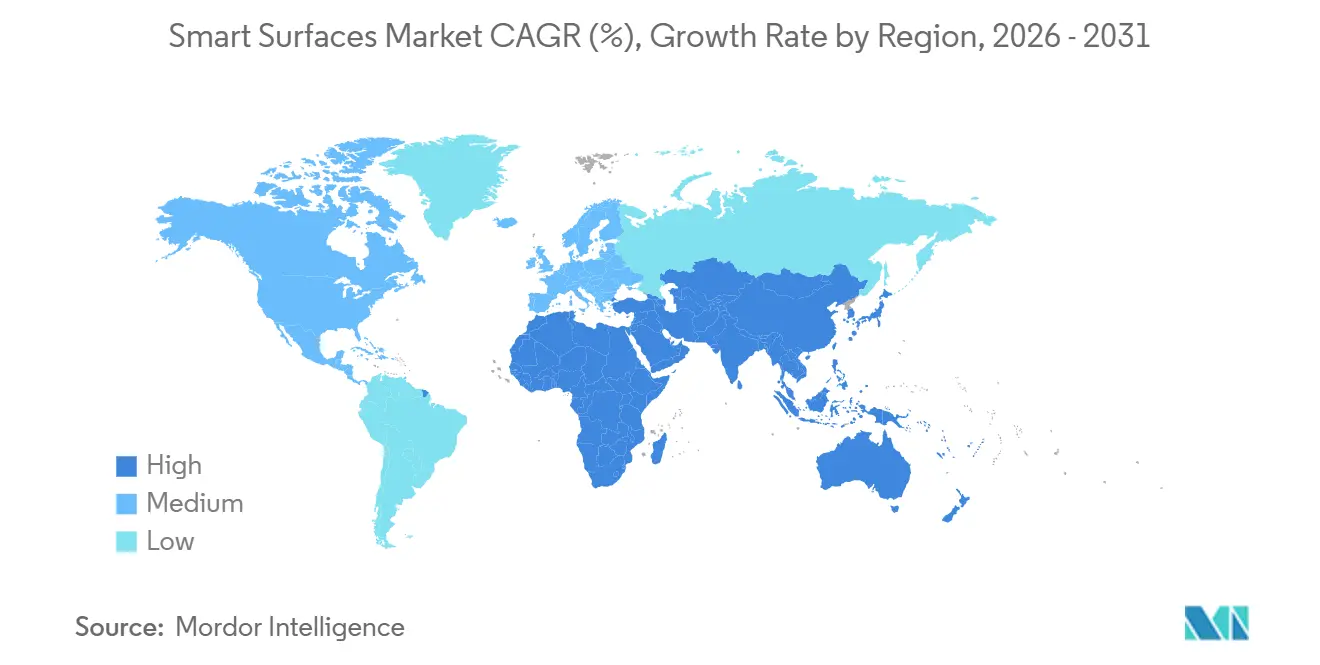
| Fastest Growing Market | Asia-Pacific |
| Largest Market | Asia Pacific |
| Market Concentration | Medium |
Major Players *Disclaimer: Major Players sorted in no particular order Image © Mordor Intelligence. Reuse requires attribution under CC BY 4.0. | |
Smart Surfaces Market Analysis by Mordor Intelligence
The smart surfaces market size was valued at USD 8.82 billion in 2025 and estimated to grow from USD 10.17 billion in 2026 to reach USD 20.31 billion by 2031, at a CAGR of 14.83% during the forecast period (2026-2031). Robust capital spending on engineered coatings across medical, mobility, and renewable-energy assets is translating directly into revenue momentum for suppliers. Manufacturers are prioritizing surface functionality over bulk material substitution because nanofabrication, digital manufacturing, and regulatory pressure on waste reduction together lower the total cost of ownership. Formulators are commercializing multi-functional layers that deliver self-cleaning, anti-microbial, and anti-corrosion performance in a single stack, a capability rarely viable at commercial scale before 2024. Asia-Pacific remains the anchor geography as China scales spray-based layer-by-layer (LbL) lines, India links production incentives to medical exports, and Japan exploits adaptive optics for augmented-reality headsets. Meanwhile, suppliers with dual-use chemistries are offsetting the phasedown of PFAS platforms by onboarding defense projects that demand radar-stealth nano-textured skins.
Key Report Takeaways
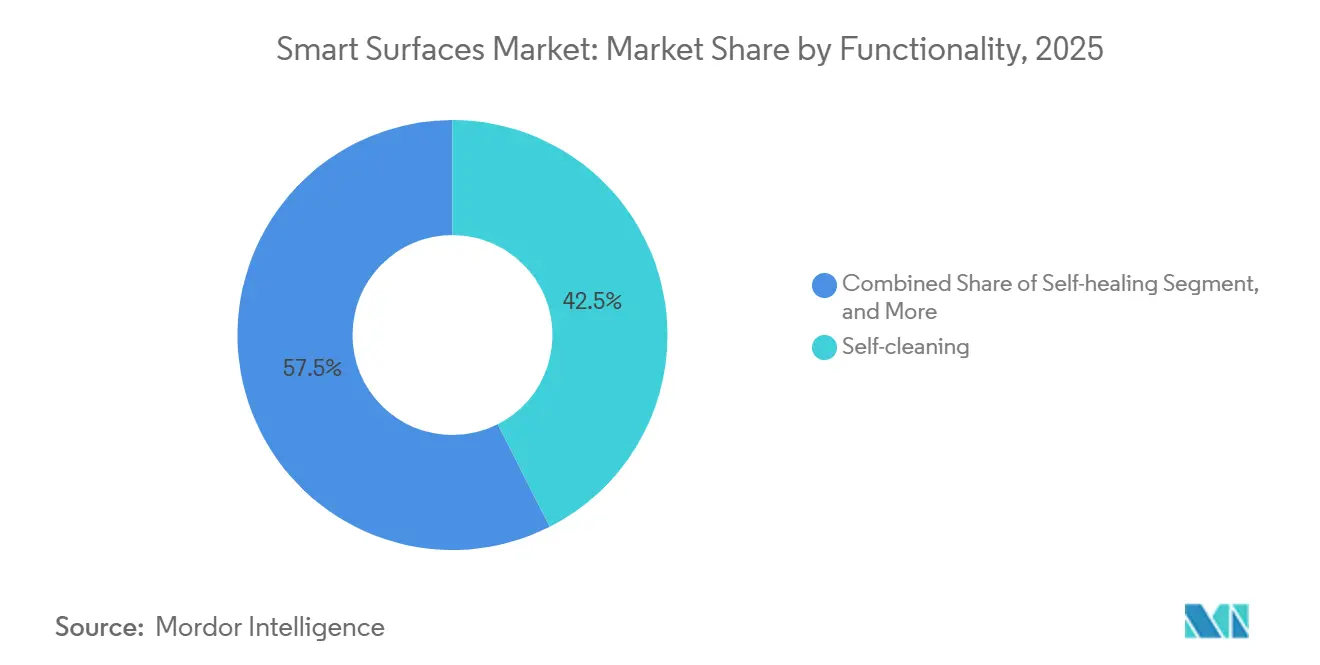
- By functionality, self-cleaning formulations led with 42.54% of the smart surfaces market share in 2025, while self-healing systems are projected to expand at a 15.63% CAGR through 2031.
- By material, polymers accounted for 34.11% of the smart surfaces market size in 2025 and nanocomposites are advancing at a 15.71% CAGR between 2026-2031.
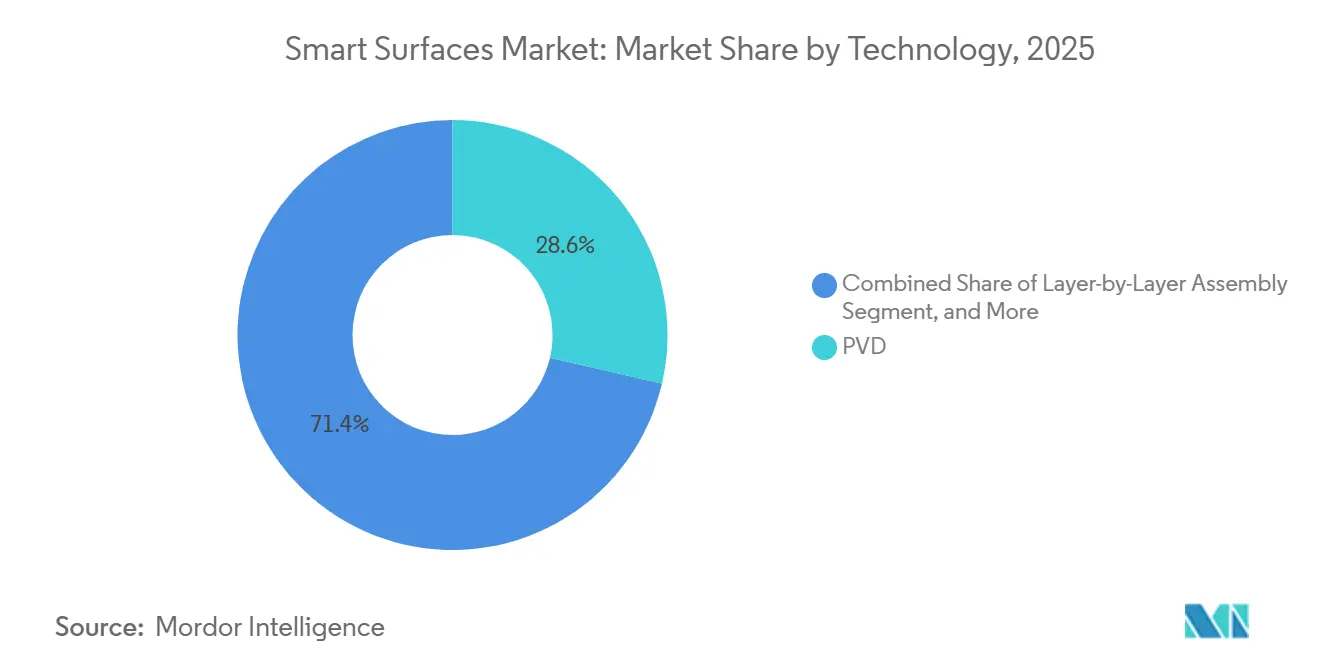
- By technology, physical vapor deposition held 28.64% of the smart surfaces market share in 2025 and spray-based LbL assembly is the fastest-growing technique at 15.66% CAGR to 2031.
- By end-use industry, building and construction represented 37.29% of the smart surfaces market size in 2025, whereas medical and healthcare applications are set to grow at a 15.94% CAGR over the same horizon.
- By geography, Asia-Pacific commanded 33.42% of the smart surfaces market share in 2025 and is forecast to register a 15.99% CAGR through 2031.
Note: Market size and forecast figures in this report are generated using Mordor Intelligence’s proprietary estimation framework, updated with the latest available data and insights as of January 2026.
Global Smart Surfaces Market Trends and Insights
Drivers Impact Analysis*
| Driver | (~) % Impact on CAGR Forecast | Geographic Relevance | Impact Timeline |
|---|---|---|---|
| Surge in Demand for Anti-Microbial Hospital Surfaces Post-COVID-19 | +3.2% | Global, with concentration in North America and Europe | Medium term (2-4 years) |
| Accelerating Adoption of Self-Cleaning Architectural Coatings | +2.8% | Asia-Pacific core, spillover to Middle East | Long term (≥ 4 years) |
| Rapid Expansion of EV Charging Infrastructure Requiring Anti-Corrosion Surfaces | +2.1% | North America, Europe, China | Medium term (2-4 years) |
| Government Incentives for Ice-Phobic Coatings in Wind Turbines | +1.9% | Europe, North America, select Asia-Pacific markets | Long term (≥ 4 years) |
| Emergence of Smart-Surface Enabled Adaptive Optics in AR/VR Headsets | +1.6% | Global, led by United States, Japan, South Korea | Short term (≤ 2 years) |
| Defense Funding for Radar-Stealth Nano-Textured Skins | +1.4% | United States, Europe, select Middle East nations | Long term (≥ 4 years) |
| Source: Mordor Intelligence | |||
Surge In Demand for Anti-Microbial Hospital Surfaces Post-COVID-19
Hospitals are embedding anti-microbial layers into door handles, bed rails, and operating room fixtures to cut infection rates that historically affected 7% of in-patients. Chlorhexidine-bonded stainless steel removes 99.9% of methicillin-resistant Staphylococcus aureus under ISO 22196 protocols within two hours, meeting procurement criteria that prioritize rapid pathogen kill without surface degradation. Transparent copper films deposited by physical vapor deposition (PVD) preserve design aesthetics while matching the efficacy of bulk copper, widening adoption in pediatric and oncology wards. Zinc-based spray coatings are scaling in outpatient clinics because existing architectural equipment can apply them without retooling. The European Union’s Medical Device Regulation now requires anti-microbial durability after 10,000 disinfectant wipe cycles, funneling demand toward high-end formulations that maintain efficacy under harsh cleaning. Wirelessly monitored pressure sensors with anti-microbial hydrogel interfaces entered clinical trials in December 2025, demonstrating how digital health and surface science together reshape infection-control protocols.[1]European Parliament, “Assembly Bill 1817 and PFAS Restrictions,” europarl.europa.eu
Accelerating Adoption of Self-Cleaning Architectural Coatings
Titanium-dioxide (TiO₂) photocatalytic coatings reduce facade-cleaning frequency from yearly to once every three years, trimming lifecycle costs by up to 40% for commercial real-estate owners. Visible-light activated variants launched in 2025 extend photocatalysis into shaded urban canyons, unlocking dense retrofit markets. Germany’s KfW 40 Plus energy-efficiency standard mandates self-cleaning topcoats on external insulation systems, securing a regulatory pull for builders renovating aging housing stock. Hydrophobic silica nanoparticles on glass curtain walls reach water-contact angles above 150°, preventing mineral spotting in Middle Eastern cities prone to hard-water deposits. In the solar sector, self-cleaning layers curb dust build-up, elevating panel output by 2-5% and shortening payback periods on large ground-mount arrays. Contract language is evolving, with building owners requesting quantified performance guarantees, a shift that rewards data-rich suppliers able to certify durability and cleaning cost reductions.
Rapid Expansion of EV Charging Infrastructure Requiring Anti-Corrosion Surfaces
National networks plan hundreds of thousands of electric vehicle charging ports by 2030, yet coastal and industrial sites report enclosure lifespans of only 5-7 years without advanced coatings. Polyamide 6 and polyamide 66 nanocomposites reinforce charging bollards, offering 25% weight savings and immunity to salt spray compared with galvanized steel. Zinc-nickel electroplates on connector housings mitigate galvanic corrosion that generated 18% of early warranty claims. Self-healing anti-corrosion layers, where microcapsules rupture on damage to release inhibitors, are now in pilot deployment and restore barrier integrity within 24 hours. The United States Department of Energy specifies 15-year corrosion resistance under ASTM B117 tests for projects funded through the USD 5 billion National Electric Vehicle Infrastructure program, giving formulators a clear benchmark. Suppliers are optimizing spray processes compatible with high-speed fabrication lines to meet the tempo of large public-private rollouts.
Government Incentives for Ice-Phobic Coatings in Wind Turbines
Ice accumulation can halve wind-turbine output and escalate blade loads, pushing operators in Nordic and Canadian markets to seek passive solutions. Polydimethylsiloxane (PDMS) layers with ice-adhesion strengths below 100 kilopascals shed ice naturally, avoiding the 200‐500-kilowatt heating loads of resistive systems. Fluoropolymer coatings achieve even lower adhesion but face rapid phase-outs under European PFAS proposals, accelerating migration to polyurethane-epoxy hybrids that show similar performance without regulatory baggage. Hybrid topcoat-primer stacks trialed offshore Norway extended recoating intervals from 3 years to 7 years, lowering lifecycle maintenance by EUR 60,000 (USD 67,000) per turbine over a decade. The forthcoming IEC 61400-1 revision embeds ice-phobic testing, standardizing qualification and unlocking cross-border subsidies that cover up to 50% of application costs in designated cold-climate zones.
Restraints Impact Analysis*
| Restraint | (~) % Impact on CAGR Forecast | Geographic Relevance | Impact Timeline |
|---|---|---|---|
| Stringent VOC and PFAS Regulations Constraining Fluorinated Chemistries | -2.4% | Global, most acute in Europe and California | Short term (≤ 2 years) |
| High Fabrication Costs of Multi-Functional Nano-Coatings | -1.8% | Global, particularly impacting price-sensitive segments | Medium term (2-4 years) |
| Scale-Up Bottlenecks for Layer-by-Layer Assembly Processes | -1.3% | Global, concentrated in North America and Europe | Medium term (2-4 years) |
| Limited Long-Term Durability Data Under Real-World Conditions | -0.9% | Global | Long term (≥ 4 years) |
| Source: Mordor Intelligence | |||
Stringent VOC And PFAS Regulations Constraining Fluorinated Chemistries
California’s Assembly Bill 1817 removed per- and polyfluoroalkyl substances from most coatings beginning January 2025, compelling suppliers to retire formulations that delivered hydrophobic and oleophobic performance for two decades. The European Chemicals Agency’s pending PFAS ban could eliminate 15-20% of current smart-surface chemistries by 2027, triggering emergency reformulation. At the same time, United States and European volatile-organic-compound caps restrict solvent content to 250 grams per liter, tightening the processing window for multi-functional stacks that depend on solvent-borne viscosity control. Large original-equipment manufacturers now embed PFAS-avoidance clauses into purchase contracts, blocking market entry for non-compliant products well ahead of legal deadlines. Transitioning to fluorine-free systems adds USD 2-5 million of R&D per product line and delays commercialization by up to two years, constraining near-term revenue and slowing the overall smart surfaces market.
High Fabrication Costs of Multi-Functional Nano-Coatings
Deposition methods capable of multi-functionality, such as layer-by-layer assembly and chemical vapor deposition, often require dozens of individual cycles or vacuum chambers that push capital costs beyond USD 500,000 per line. Material premiums inflate further when graphene oxide or carbon-nanotube feeds cost three to five times more than standard resins, a hurdle for building, appliance, and low-margin consumer segments. Early adopters frequently invest another USD 100,000-300,000 in custom spray booths because no universal platform exists for emerging chemistries. Yield losses from nano-texturing defects can exceed 20% until statistical process capability stabilizes, squeezing margins during scale-up years. Collectively, these barriers temper adoption outside high-value niches and cap the pace of smart surfaces market penetration.
*Our forecasts treat driver/restraint impacts as directional, not additive. The impact forecasts reflect baseline growth, mix effects, and variable interactions.
Segment Analysis
By Functionality: Medical Demand Drives Self-Healing Surge
Self-healing coatings are advancing at a 15.63% CAGR through 2031, outperforming the overall smart surfaces market as automotive and aerospace builders integrate microcapsule systems that autonomously seal micro-cracks. The smart surfaces market size tied to these formulations is rising fastest in electric-vehicle battery enclosures and aircraft composite panels, were warranty cycles hinge on surface integrity. Self-cleaning layers still commanded 42.54% of 2025 revenue, dominated by TiO₂ photocatalytic stacks on glass and solar modules that reduce labor costs 30-40% over a decade.
Healthcare operators now specify anti-microbial coatings across intensive-care units, leveraging chlorhexidine-bonded alloys and transparent copper films that demonstrate 99.9% pathogen kill under ISO 22196. Anti-icing PDMS layers cut Nordic wind-turbine downtime by up to 50%, and anti-fouling silicone systems lower hull drag 5-10% for global shipping fleets. Anti-corrosion polyamide nanocomposites nearly triple the service life of coastal EV charging gear, while aerospace programs evaluate shape-memory polymers for hail-damage recovery. Collectively, these functional pathways diversify revenue and stabilize the smart surfaces market against single-application volatility.


By Material: Nanocomposites Redefine Performance Ceilings
Nanocomposites built with graphene oxide or carbon nanotubes are growing at 15.71% because they amplify tensile strength by up to 200% and boost thermal conductivity fivefold relative to neat resins. Although polymers retained 34.11% of 2025 demand, high-performance nanocomposites are displacing them in medical implants and defense aerostructures, where cost is secondary to mission durability.
Silica-reinforced polymers achieve water-contact angles above 150°, keeping Middle Eastern curtain walls free of staining despite hard-water conditions. Zinc-nickel metal plates seal charging connectors against galvanic attack, while glass and ceramics underpin low-reflection solar covers that lift module efficiency by 2-5%. Clay-platelet hybrids slow oxygen ingress by up to 60%, extending shelf life for electronic sensors shipped worldwide. Price-sensitive builders still default to commodity acrylics, but performance-driven buyers continue migrating toward nanocomposite solutions, sustaining double-digit growth within the smart surfaces market.
By Technology: Layer-By-Layer Assembly Overcomes Scale Barriers
Spray-based LbL processes introduced in 2025 trimmed deposition cycles from hours to minutes, pushing the technology toward mass production and supporting a 15.66% CAGR through 2031. Physical vapor deposition kept 28.64% of revenue in 2025, favored for optics, medtech, and radar-stealth skins that demand sub-nanometer uniformity.
Chemical vapor deposition still dominates diamond-like carbon hard coats for implants and cutting tools, while sol-gel routes supply cost-effective self-cleaning glass layers without vacuum chambers. Laser and reactive-ion etching create shark-skin micro-textures that slash biofouling 70-80% on maritime hulls. Traditional spray coating equipment secures volume efficiency in building and industrial machinery, giving incumbents a capital-depreciation advantage. The convergence of precision and speed in LbL enables multi-functional stacks at automotive line tact-times, marking a structural shift in the smart surfaces market.
By End-Use Industry: Healthcare Outpaces Construction
Building and construction still controlled 37.29% of 2025 turnover through facade, roofing, and glazing projects, yet medical and healthcare demand is growing at 15.94% on the back of infection-control upgrades and sensorized implants. Hospitals purchasing self-healing catheters and anti-microbial wall panels are broadening the revenue funnel for coatings qualified under ISO 10993.
Automotive programs now integrate self-repairing battery casings, bumpers, and interior trims that extend warranties from 8 years to 12 years. Electronics OEMs embed anti-fingerprint layers on touchscreens with surface energies under 20 mN/m to assure visual clarity. Energy firms specify anti-soiling solar covers and ice-phobic wind coatings to stabilize output in harsh climates. Maritime, aerospace, and industrial equipment adopters focus on drag reduction, radar signature management, and wear resistance. The diversity of verticals insulates the smart surfaces market from cyclical spending in any single sector and underpins long-run growth.
Geography Analysis
Asia-Pacific posted the largest regional footprint at 33.42% of 2025 revenue and is forecast to grow at 15.99% through 2031. China’s IMR Technology invested CNY 551 million (USD 76 million) in Guangdong for spray-based LbL lines that support automotive and electronics orders beginning 2025. India earmarked INR 3,420 crore (USD 410 million) under its Production Linked Incentive scheme to scale medical-device coatings, catalyzing domestic supply. Japan’s electronics leaders deploy liquid-crystal elastomer optics in augmented-reality products, highlighting the region’s innovation depth. South Korean shipyards implement silicone foul-release layers to meet International Maritime Organization bans on tributyltin, and Australia’s miners specify anti-corrosion treatments for coastal haul trucks.
North America and Europe are recalibrating portfolios around PFAS phase-outs. California’s 2025 ban forces immediate product changeovers, and the European Chemicals Agency’s restriction proposal tightens timelines further. Horizon Europe’s EUR 4 million (USD 4.4 million) SafeTouch grant accelerates anti-microbial transit surfaces, while Germany’s KfW 40 Plus standard mandates self-cleaning topcoats on retrofits that make up 60% of current construction activity. The United States Department of Energy’s USD 5 billion charging-station budget embeds 15-year salt-spray requirements, creating predictable pull for anti-corrosion stacks.[2]United States Environmental Protection Agency, “40 CFR Part 59 VOC Rules,” epa.gov
The Middle East, Africa, and South America present rising adjacencies. Saudi Arabia and the United Arab Emirates demand self-cleaning solar modules to stem 5-10% monthly efficiency loss from dust. South African mining operators extend equipment uptime threefold with wear-resistant coatings, while Brazil’s offshore platforms adopt anti-corrosion and anti-fouling packages to withstand 0.5-1.5 mm annual steel loss in aggressive Atlantic waters. Argentina’s farm machinery makers spray self-cleaning layers on harvesters, raising throughput 10-15% during peak season. Collectively, these initiatives sustain the global spread of the smart surfaces market.

Competitive Landscape
The market remains moderately fragmented: the top five vendors hold well under 50% combined revenue, allowing nimble regional players to prosper. PFAS retirement compresses margins for incumbents tied to fluoropolymer catalogs, while newcomers pitch polyurethane-epoxy and silica-nano hydrophobics that sidestep regulation. Dual-use firms leverage radar-stealth research budgets to co-fund commercial product pipelines, a structural edge over single-vertical specialists.
P2i exemplifies this pivot by launching PFAS-free liquid-barrier coatings for medical devices in December 2025 and rolling out thermal-management layers for automotive printed-circuit boards one month earlier. The company secured EUR 8 million (USD 8.7 million) from Jolt Capital to scale an Indian facility, reflecting investor appetite for compliant chemistries. Patent filings around Diels-Alder reversible polymers rose 40% between 2024 and 2025, underscoring intensifying intellectual-property competition.[3]P2i Limited, “PFAS-Free Coating Launch,” p2i.com
Technological bifurcation is visible: capital-heavy PVD and CVD lines dominate high-margin medical, optics, and defense contracts, whereas scalable spray and sol-gel platforms win construction, consumer, and industrial bids. Suppliers that master rapid LbL spraying unlock automotive takt-time compatibility, positioning themselves for high-volume contracts as electric vehicles and consumer electronics demand multi-functional, defect-free surfaces.
Smart Surfaces Industry Leaders
P2i Limited
Aculon, Inc.
NEI Corporation
Tesla NanoCoatings, Inc.
Abrisa Technologies
- *Disclaimer: Major Players sorted in no particular order


Recent Industry Developments
- December 2025: P2i launched PFAS-free liquid-barrier coatings for medical devices, passing ISO 10993 biocompatibility and achieving 140° water-contact angles.
- November 2025: P2i introduced thermal-management coatings for automotive PCB assemblies that maintain dielectric strength above 20 kV/mm from -40 °C to 125 °C.
- June 2025: The European Union, via Horizon Europe, granted EUR 4 million (USD 4.4 million) to the SafeTouch project for anti-microbial public-transport surfaces, with field trials planned in Paris and Berlin.
- January 2025: California’s Assembly Bill 1817 took effect, eliminating PFAS from most architectural and automotive coatings and accelerating nationwide reformulation cycles.


Global Smart Surfaces Market Report Scope
The smart surfaces market encompasses advanced materials and engineered technologies designed to respond to external stimuli such as light, temperature, and pressure. These surfaces, integrated with sensors, actuators, and responsive coatings, provide functionalities including self-healing, energy harvesting, and dynamic control. They are widely utilized across industries such as automotive, aerospace, construction, healthcare, electronics, and consumer goods.
The Smart Surfaces Market Report is Segmented by Functionality (Self-Cleaning, Self-Healing, Anti-Icing, Anti-Fouling, Anti-Corrosion, Anti-Microbial, and Other Functionality), Material (Polymers, Metals and Alloys, Glass and Ceramics, Nanocomposites, and Other Material), Technology (Physical Vapor Deposition (PVD), Chemical Vapor Deposition (CVD), Sol-Gel, Layer-by-Layer Assembly, Spray Coating, Micro/Nano-Texturing, and Other Technology), End-Use Industry (Building and Construction, Automotive and Transportation, Medical and Healthcare, Electronics and Consumer Devices, Energy, Maritime and Aerospace, Industrial Machinery, and Other End-Use Industry), and Geography (North America, Europe, Asia-Pacific, Middle East, Africa, and South America). The Market Forecasts are Provided in Terms of Value (USD).
| Self-Cleaning |
| Self-Healing |
| Anti-Icing |
| Anti-Fouling |
| Anti-Corrosion |
| Anti-Microbial |
| Other Functionality |
| Polymers |
| Metals and Alloys |
| Glass and Ceramics |
| Nanocomposites |
| Other Material |
| Physical Vapor Deposition (PVD) |
| Chemical Vapor Deposition (CVD) |
| Sol-Gel |
| Layer-by-Layer Assembly |
| Spray Coating |
| Micro/Nano-Texturing |
| Other Technology |
| Building and Construction |
| Automotive and Transportation |
| Medical and Healthcare |
| Electronics and Consumer Devices |
| Energy (Solar and Wind) |
| Maritime and Aerospace |
| Industrial Machinery |
| Other End-Use Industry |
| North America | United States |
| Canada | |
| Mexico | |
| Europe | Germany |
| United Kingdom | |
| France | |
| Russia | |
| Rest of Europe | |
| Asia-Pacific | China |
| Japan | |
| India | |
| South Korea | |
| Australia | |
| Rest of Asia-Pacific | |
| Middle East | Saudi Arabia |
| United Arab Emirates | |
| Rest of Middle East | |
| Africa | South Africa |
| Egypt | |
| Rest of Africa | |
| South America | Brazil |
| Argentina | |
| Rest of South America |
| By Functionality | Self-Cleaning | |
| Self-Healing | ||
| Anti-Icing | ||
| Anti-Fouling | ||
| Anti-Corrosion | ||
| Anti-Microbial | ||
| Other Functionality | ||
| By Material | Polymers | |
| Metals and Alloys | ||
| Glass and Ceramics | ||
| Nanocomposites | ||
| Other Material | ||
| By Technology | Physical Vapor Deposition (PVD) | |
| Chemical Vapor Deposition (CVD) | ||
| Sol-Gel | ||
| Layer-by-Layer Assembly | ||
| Spray Coating | ||
| Micro/Nano-Texturing | ||
| Other Technology | ||
| By End-Use Industry | Building and Construction | |
| Automotive and Transportation | ||
| Medical and Healthcare | ||
| Electronics and Consumer Devices | ||
| Energy (Solar and Wind) | ||
| Maritime and Aerospace | ||
| Industrial Machinery | ||
| Other End-Use Industry | ||
| By Geography | North America | United States |
| Canada | ||
| Mexico | ||
| Europe | Germany | |
| United Kingdom | ||
| France | ||
| Russia | ||
| Rest of Europe | ||
| Asia-Pacific | China | |
| Japan | ||
| India | ||
| South Korea | ||
| Australia | ||
| Rest of Asia-Pacific | ||
| Middle East | Saudi Arabia | |
| United Arab Emirates | ||
| Rest of Middle East | ||
| Africa | South Africa | |
| Egypt | ||
| Rest of Africa | ||
| South America | Brazil | |
| Argentina | ||
| Rest of South America | ||


Key Questions Answered in the Report
What revenue level are smart surfaces expected to reach by 2031?
Global sales are forecast to hit USD 20.31 billion by 2031, reflecting a 14.83% CAGR from 2026-2031 as per Mordor Intelligence.
Which region currently leads adoption of engineered, multi-functional coatings?
Asia-Pacific held 33.42% share in 2025 and remains the fastest-growing geography through 2031, buoyed by large-scale capacity additions in China and incentive-backed medical exports from India as per Mordor Intelligence.
How quickly are self-healing formulations expanding compared with other functionalities?
Self-healing coatings are advancing at a 15.63% CAGR to 2031, outpacing the overall growth rate and closing the gap with the dominant self-cleaning segment as per Mordor Intelligence.
Which deposition method is recording the highest growth momentum?
Spray-based layer-by-layer assembly is the speed leader, projected to grow at 15.66% CAGR as automated systems cut cycle times from hours to minutes.
Why are hospitals showing heightened interest in smart surfaces?
Anti-microbial layers certified under ISO 22196 reduce pathogen loads by 99.9%, helping facilities curb hospital-acquired infections that still affect about 7% of in-patients worldwide.
How do tightening PFAS and VOC rules influence supplier strategies?
Regulations in California and the European Union are phasing out fluorinated chemistries, forcing reformulation investments of USD 2-5 million per product line and accelerating the shift toward fluorine-free hydrophobic systems.
Page last updated on:


