Smart Lighting Market Size and Share
Market Overview
| Study Period | 2020 - 2031 |
|---|---|
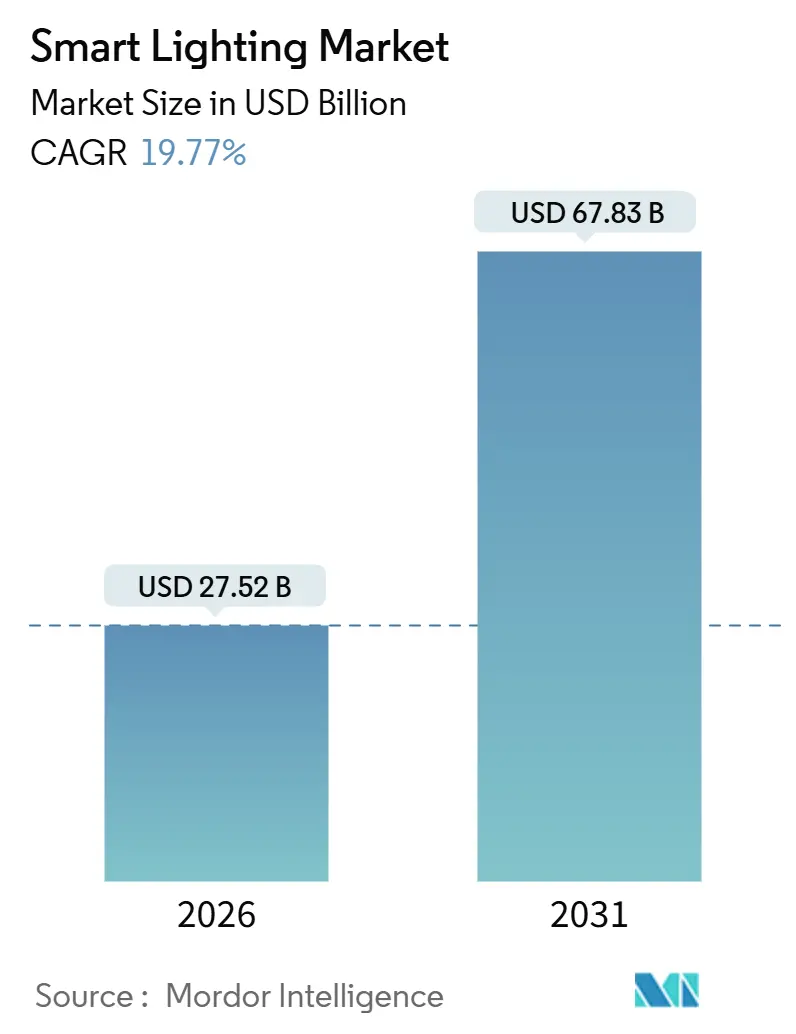
| Market Size (2026) | USD 27.52 Billion |
| Market Size (2031) | USD 67.83 Billion |
| Growth Rate (2026 - 2031) | 19.77% CAGR |
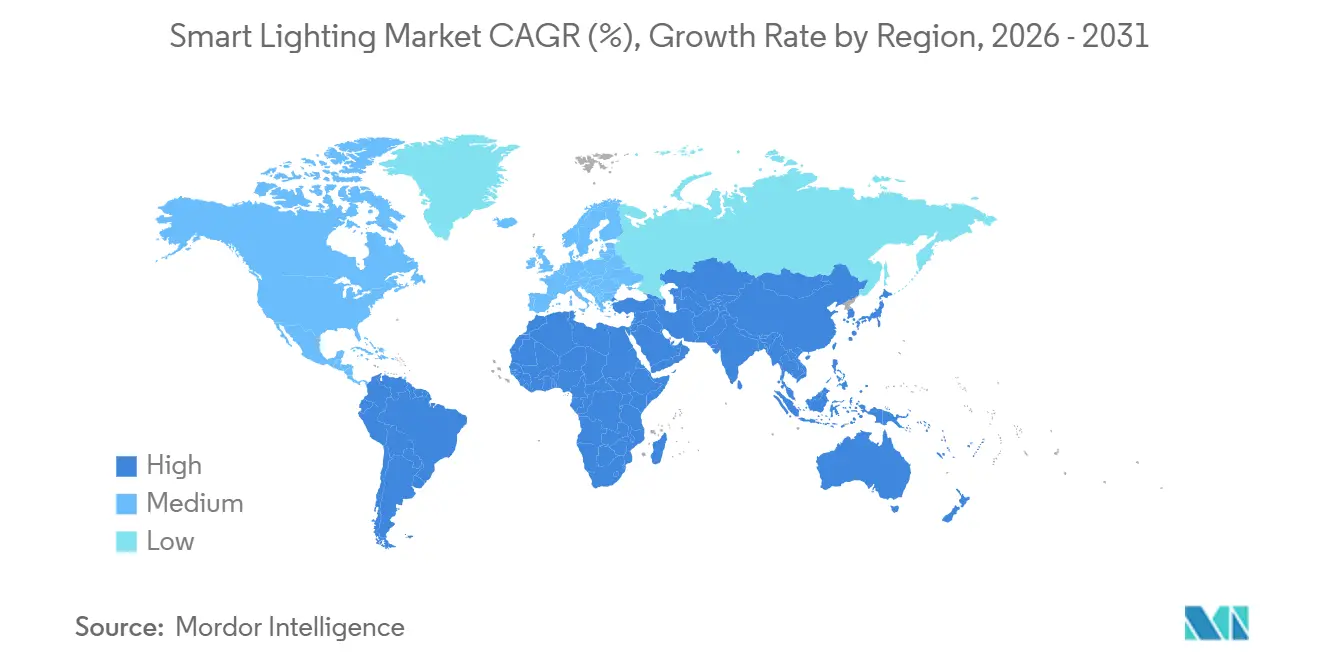
| Fastest Growing Market | Middle East |
| Largest Market | Asia Pacific |
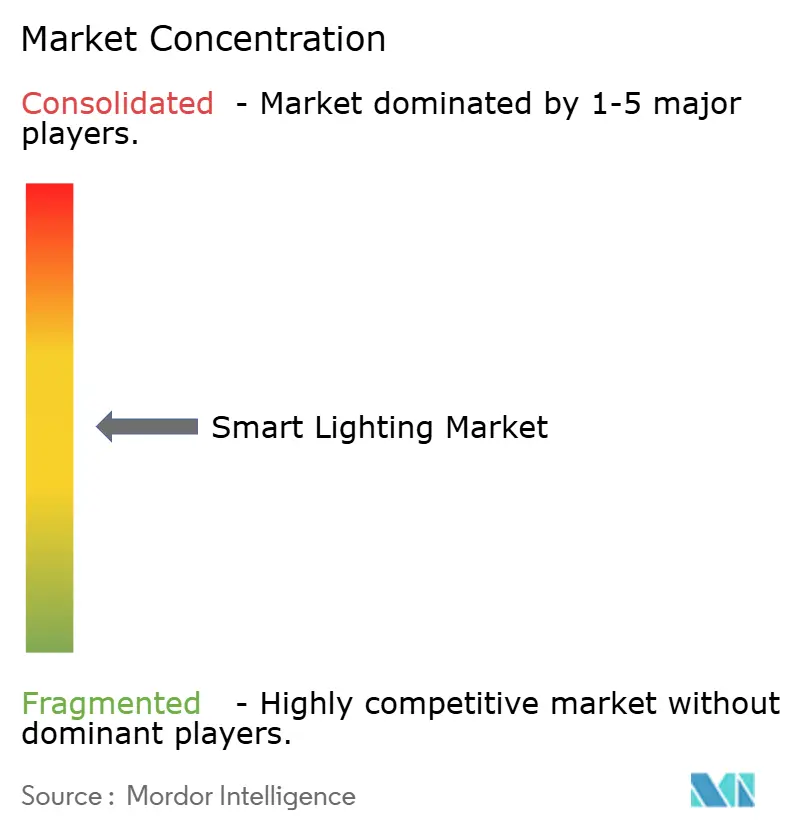
| Market Concentration | Medium |
Major Players *Disclaimer: Major Players sorted in no particular order Image © Mordor Intelligence. Reuse requires attribution under CC BY 4.0. | |
Smart Lighting Market Analysis by Mordor Intelligence
The smart lighting market size reached USD 27.52 billion in 2026 and is projected to climb to USD 67.83 billion by 2031, translating into a 19.77% CAGR across the forecast horizon, a trajectory that underlines the sector’s transition from early-adopter novelty to mainstream building-performance technology. Three structural shifts are shaping this expansion: national net-zero building codes that took effect in 2025, utility programs now covering 30-50% of retrofit capital outlays, and the arrival of Matter 1.4, which finally harmonized fragmented connectivity protocols. Vendors are weaving value-added software edge-AI dimming, Li-Fi data backhaul, and grid-interactive demand-response into hardware, turning luminaires into data nodes and service gateways. Competitive intensity remains elevated because legacy lighting majors, consumer-electronics brands, and specialist start-ups are converging on the same addressable opportunity. Asia-Pacific is the scale leader, but sovereign smart-city mandates in the Middle East give that sub-region the fastest growth runway.
Key Report Takeaways
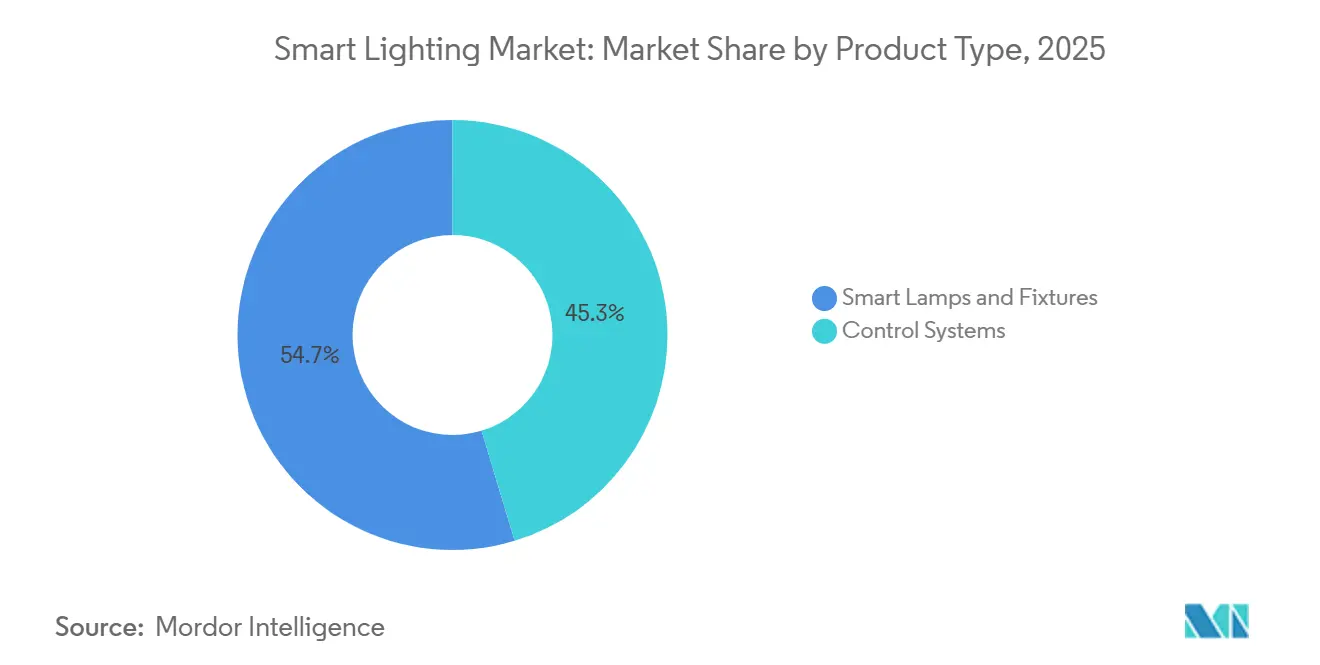
- By product category, smart lamps and fixtures captured 54.67% of the smart lighting market share in 2025, while control systems are set to register the fastest 20.19% CAGR through 2031.
- By installation type, retrofits dominated with 62.91% of the smart lighting market share in 2025; new construction, however, is forecast to expand at a 20.13% CAGR on the back of net-zero building codes.
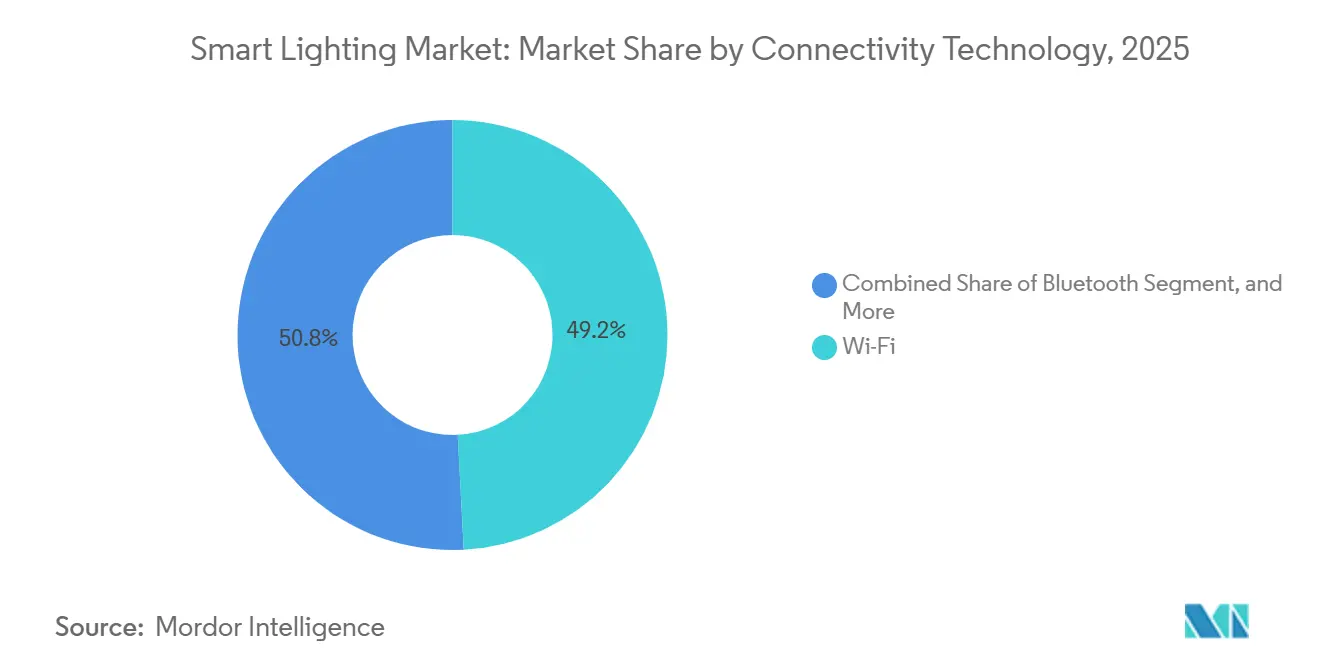
- By connectivity technology, Wi-Fi accounted for 49.17% of 2025 revenue, whereas Bluetooth mesh is poised to advance at a 20.58% CAGR over the forecast period.
- By end user, residential households accounted for 46.73% of the smart lighting market share in 2025, yet industrial facilities are projected to deliver the highest 20.53% CAGR through 2031.
- By geography, Asia-Pacific led with a 37.38% revenue share in 2025, but the Middle East is positioned for the strongest 20.71% CAGR through 2031.
Note: Market size and forecast figures in this report are generated using Mordor Intelligence’s proprietary estimation framework, updated with the latest available data and insights as of January 2026.
Global Smart Lighting Market Trends and Insights
Drivers Impact Analysis*
| Driver | (~) % Impact on CAGR Forecast | Geographic Relevance | Impact Timeline |
|---|---|---|---|
| Expanding Smart-Home Ecosystem Integration | +3.8% | Global, with concentration in North America, Western Europe, and urban Asia-Pacific | Medium term (2-4 years) |
| Rapid LED Cost Reductions Improve ROI | +4.2% | Global, strongest in price-sensitive markets including India, Southeast Asia, Latin America | Short term (≤ 2 years) |
| Utility-Funded Demand-Side-Management Incentives | +3.5% | North America and Europe, emerging in Australia and select Middle East utilities | Medium term (2-4 years) |
| National Net-Zero Building Codes (2025-2030 Roll-outs) | +4.1% | California, European Union, Japan, South Korea, with pilot adoption in China and India | Long term (≥ 4 years) |
| Li-Fi-Enabled Lighting Pilots in Warehouses | +1.2% | Industrial hubs in Germany, United States, China, and United Arab Emirates | Long term (≥ 4 years) |
| Edge-AI-Powered Adaptive Dimming Algorithms | +2.3% | Commercial and industrial segments in developed markets, gradual diffusion to emerging economies | Medium term (2-4 years) |
| Source: Mordor Intelligence | |||
Expanding Smart-Home Ecosystem Integration
Voice-assistant platforms and Matter 1.4 certification have reduced purchase friction by enabling a single firmware image to interoperate with Apple HomeKit, Google Home, Amazon Alexa, and Samsung SmartThings, removing vendor lock-in and lowering support costs.[1]Connectivity Standards Alliance, “Matter 1.4 Specification and Device Certification,” csa-iot.org Thread 1.4’s low-power mesh has raised the device limit to 250 nodes per network, while self-healing routes alleviate reliability complaints that dogged early Zigbee rollouts. Smart-bulb average selling prices fell 22% between 2024 and 2025 as Asian contract manufacturers scaled production, expanding the addressable household base. Retrofit-oriented business models benefit disproportionately because consumers can swap bulbs without rewiring. Commercially, hospitality chains now bundle Matter-certified downlights with occupancy sensors so guestrooms automatically adjust to preferred scenes at check-in, improving the guest experience while shaving energy bills.
Rapid LED Cost Reductions Improve ROI
High-bay fixtures suitable for warehouses now retail at USD 120–180, down from USD 250–350 just three years earlier, while efficacy leapt to 150 lumens per watt, nearly double that of metal-halide incumbents.[2]U.S. Department of Energy, “Lighting Facts Database – High-Bay LED Fixtures,” energy.gov Utility incentives in Massachusetts and Connecticut shave 40–50% off material costs, routinely compressing payback to 12 months. Chinese and South Korean chip foundries are pushing gallium nitride epitaxy yields higher, cutting die costs by a further 10–15% each year. Cities are capitalizing: Dubai retrofitted 900 luminaires on Sheikh Rashid Street in 2024, netting 60% energy savings and a 4-year payback, even without subsidies. The cost curve keeps steepening, reinforcing price elasticity across commercial, industrial, and municipal segments.
Utility-Funded Demand-Side-Management Incentives
Regulated utilities treat lighting upgrades as the least-cost alternative to building peaking plants. Connecticut approved USD 45 million for 2025 lighting rebates, offering USD 30–80 per LED fixture and USD 15 more for networked controls.[3]Connecticut Public Utilities Regulatory Authority, “Energy Efficiency Program Approvals for 2025,” portal.ct.gov/pura Massachusetts disbursed USD 78 million in 2024, reporting an average 62% reduction in lighting energy use across participating sites. Program design is evolving from one-time rebates toward performance-based compensation: facilities that allow remote curtailment during grid stress secure capacity payments worth 10-15% of project value. The U.S. General Services Administration has embedded such grid-interactive requirements in all federally funded retrofits.
National Net-Zero Building Codes
California’s 2025 Title 24 update mandates networked lighting with occupancy sensing, daylight harvesting, and demand-response in non-residential buildings above 10,000 square feet, cutting lighting energy 35% relative to 2022 baselines. The European Union’s Energy Performance of Buildings Directive requires near-zero-energy construction by 2028, with lighting controls contributing 15–20% toward compliance. Japan and South Korea enacted analogous codes in 2025, while China pilots net-zero standards in tier-one cities. For supply chains, the shift means sensors and wireless modules must be standard bill-of-materials items rather than optional add-ons. Design-build firms are responding by embedding smart lighting into initial construction documents rather than value-engineering it out later.
Restraints Impact Analysis*
| Restraint | (~) % Impact on CAGR Forecast | Geographic Relevance | Impact Timeline |
|---|---|---|---|
| Cyber-Security Vulnerabilities in Wireless Protocols | -2.1% | Global, with heightened concern in critical infrastructure and government facilities | Short term (≤ 2 years) |
| Fragmented Inter-Operability Standards | -1.8% | Global, gradually diminishing as Matter adoption scales | Medium term (2-4 years) |
| Supply Chain Volatility in Rare-Earth Phosphors | -1.3% | Global, most acute in high-color-rendering applications for retail and hospitality | Medium term (2-4 years) |
| Smart-Home Privacy Regulation Uncertainty | -0.9% | European Union, California, and emerging frameworks in Asia-Pacific | Long term (≥ 4 years) |
| Source: Mordor Intelligence | |||
Cyber-Security Vulnerabilities in Wireless Protocols
The National Institute of Standards and Technology warned in 2024 that Zigbee and Bluetooth LE lack robust authentication, exposing networks to spoofing when default credentials persist. CVE-2024-41126 demonstrated remote takeover of luminaires via unauthorized pairing, spurring critical-facility operators to air-gap lighting networks or revert to wired DALI-2 buses. Such precautions add USD 8–15 per fixture, lengthening payback and complicating building-automation integration. Matter’s device-attestation aims to neutralize the threat by cryptographically verifying hardware provenance, but full mitigation requires field replacements over several product cycles.
Fragmented Inter-Operability Standards
Before Matter, buyers had to juggle Zigbee, Z-Wave, proprietary Wi-Fi, and Bluetooth mesh, each requiring separate hubs and mobile apps, while commercial sites had to balance DALI, BACnet, and vendor-specific protocols. As of mid-2025, fewer than 30% of smart-lighting SKUs carried Matter certification, and legacy estates still require protocol gateways, which cost USD 200–500 per building and add another point of failure. Although adoption is accelerating, many facility managers defer upgrades until a majority of their installed base is natively compliant.
*Our forecasts treat driver/restraint impacts as directional, not additive. The impact forecasts reflect baseline growth, mix effects, and variable interactions.
Segment Analysis
By Product Type: Control Systems Capture Value Beyond Hardware
Smart lamps and fixtures captured 54.67% of the smart lighting market share in 2025, while control systems are set to register the fastest 20.19% CAGR through 2031. Energy-service companies increasingly position controls as the gateway to demand-response revenue, predictive maintenance, and occupant-centric comfort. In value terms, lamps and fixtures still dominated 2025 sales, but commoditization is squeezing margins below 25%. Helvar’s ActiveAhead deployment at Volvo Trucks’ Swedish plant illustrates the control-centric thesis: edge AI learned work-cell occupancy, pre-dimmed aisles, and harvested daylight to trim an additional 23% of power. Residential buyers, meanwhile, gravitate toward bulbs that require no wiring changes; average retail pricing for a Matter-certified lamp fell to USD 12 in 2025, democratizing access. The shifting stack means firmware, analytics, and cloud dashboards, not raw lumens, determine vendor differentiation.
Smart lamps and fixtures, nonetheless, remain indispensable. Circadian-tuning is gaining traction in offices and hospitality as facility managers quantify productivity gains tied to light spectra, while decorative luminaires support branded ambience in retail. Yet even here, controls are subsuming the narrative: tunable fixtures ship with embedded drivers that listen for Matter or DALI-2 commands out of the box. As the installed base saturates, software upgrades will extract recurring revenue, transforming lamps from capital goods into digital platforms.


By Installation Type: Net-Zero Codes Tip the Scale Toward New Builds
Retrofits accounted for 62.91% of the smart lighting market share in 2025, reflecting the significant inventory of fluorescent and metal-halide luminaires still in use in global building stock. Utility incentives underwrite much of the swap-out cost, translating into 12- to 18-month paybacks that meet even CFO-level hurdle rates. Yet the compliance tide is turning: new construction is accelerating at a 20.13% CAGR because updated energy codes make networked lighting mandatory at the blueprint stage. When lighting is specified early, contractors prewire for sensors and provide low-voltage power for gateways, slashing future labor costs.
Retrofit economics bifurcate. Simple lamp-for-lamp replacements yield 50-60% energy cuts but miss the incremental 20–30% available from occupancy-aware dimming. Building owners now select integrated control packages to unlock utility performance-based incentives. Municipal case studies reinforce the point: Dubai’s 2024 Sheikh Rashid Street project realized 60% savings on a four-year unsubsidized payback and immediately initiated trials on secondary roads for adaptive dimming.
By Connectivity Technology: Bluetooth Mesh Surges on Gateway-Free Economics
Wi-Fi accounted for 49.17% of revenue in 2025, thanks to the ubiquity of routers and consumer familiarity, but its single-point-of-failure profile and upstream bandwidth demands are liabilities. Bluetooth mesh, advancing at a 20.58% CAGR, eliminates the need for dedicated gateways, cutting USD 3–5 from the bill of materials and simplifying commissioning. Networks can scale to 32,000 devices, auto-reconfigure routes, and operate without touching the building’s IT VLAN, an advantage in retail and hospitality. Matter 1.4’s standardized commissioning further accelerates adoption because a single QR code brings devices online regardless of smartphone OS.
Zigbee endures in commercial sites where legacy building-management systems already run Zigbee sensors for HVAC, but security concerns after CVE-2024-41126 have stalled new bids in government and healthcare. Li-Fi remains niche yet strategic: warehouses running autonomous mobile robots now pilot luminaires modulated at 224 Gb/s to sidestep RF interference. As chipsets mature, Li-Fi may carve a defensible beachhead in industrial automation long before it permeates offices.

By End-User: Industrial Facilities Embrace Data-Centric Lighting
Residential users accounted for 46.73% of 2025 revenue, driven by sub-USD 15 smart bulb pricing and voice assistant convenience. Yet warehouses, factories, and logistics hubs will deliver the steepest CAGR of 20.53% through 2031. High-bay LEDs at 150 lumens per watt, coupled with 18- to 24-month simple paybacks, put lighting top of the industrial energy-efficiency stack. Edge-AI controls go further, adjusting luminance per zone, per shift, and per daylight condition. Li-Fi pilots add a data-comms layer, enabling robots to localize and communicate without congesting the 2.4 GHz Wi-Fi band.
Commercial real estate pursues human-centric metrics such as circadian lighting and color-tunable luminaires for retail visual merchandising. These applications require high color-rendering LEDs that depend on rare-earth phosphors, a supply chain vulnerable to geopolitical shocks. Meanwhile, municipalities in emerging economies allocate constrained budgets to smart street lighting, drawn by lower maintenance costs and 40-60% energy savings.
Geography Analysis
L37: Asia-Pacific commanded 37.38% of the smart lighting market share in 2025, anchored by China’s manufacturing scale, India’s urbanization, and Japan’s tech-savvy construction sector. The region’s growth is steady but moderating as early adopters transition from fixture swaps to incremental control-system upgrades. Middle East and Africa, conversely, will post the quickest 20.71% CAGR because sovereign smart-city mandates hard-code LED conversion deadlines as early as 2027. Qatar’s Public Works Authority committed to nationwide smart LED streetlighting in October 2025, aiming for 40–50% energy savings.
North America and Europe remain crucibles of innovation. California’s 2025 Title 24 revision and Massachusetts’ generous DSM rebates shorten payback cycles, embedding lighting controls during schematic design. The European Union’s near-zero-energy directive requires member states to incorporate networked lighting in all new buildings by 2028. These policies keep the regions’ aggregate revenue base resilient despite lower headline growth.
South America and Africa still lag in penetration due to budget constraints and electricity tariff subsidies that dilute ROI. Brazil and South Africa are piloting municipal conversions, but fiscal austerity limits scale. As LED module pricing falls below USD 1 per kilolumen in 2026, these markets will gradually migrate from pilot to portfolio execution.

Competitive Landscape
Industry structure is moderately fragmented. The top five incumbents, Signify, Acuity Brands, Hubbell, Samsung, and Xiaomi control a combined 42–47% of 2025 revenue, with the remaining share scattered among regional specialists, IoT start-ups, and DIY-focused brands. Incumbents defend their share by bundling hardware, controls, and cloud analytics into subscription packages. Signify’s Interact suite monetizes remote condition monitoring and utility DR participation, converting once-off fixture sales into annuity revenue. Acuity’s 2024 nLight AIR release brought BACnet integration without gateways, easing commercial retrofits.
Consumer-electronics challengers leverage existing smart-home channels. Snap One’s Lux by Control4, shipping since Q2 2025, supports 600-watt loads and 19 tunable colors, aiming at upscale residential projects. Matter certification is leveling the field: Nanoleaf and Sengled rushed to certify in early 2025, undermining incumbents’ proprietary ecosystem moat.
White-space opportunities align with three vectors. Edge-AI platforms such as Helvar ActiveAhead distill occupancy data to enable real-time dimming, adding 15–25% additional savings over static scheduling. Li-Fi-enabled fixtures solve RF-challenged warehouse automation. Finally, grid-interactive controls unlock DSM revenue streams, improving payback by up to 18 months. Vendors that package these capabilities into turnkey offerings stand to outpace commodity hardware rivals.
Smart Lighting Industry Leaders
Signify N.V.
Acuity Brands Inc.
Hubbell Inc.
Eaton Corp.
Lutron Electronics Co. Inc.
- *Disclaimer: Major Players sorted in no particular order

Recent Industry Developments
- October 2025: Qatar’s Public Works Authority launched a nation-wide conversion of all streetlights to smart LED by 2027, targeting 40–50% energy savings.
- September 2025: Snap One unveiled Control4 X4 and Lux at CEDIA Expo, combining 600-watt dimming with Matter interoperability for custom-install channels.
- June 2025: Snap One initiated commercial shipments of the Control4 X4 controller, embedding edge-AI for proactive lighting scenes.
- May 2025: Riyadh Municipality expanded its smart-pole program, integrating traffic sensors and Wi-Fi into LED street-lighting infrastructure.


Research Methodology Framework and Report Scope
Market Definitions and Key Coverage
Our study defines the smart lighting market as revenue generated from connected lamps, luminaires, sensors, gateways, and lighting-management software that enable remote, automated, or data-driven control across residential, commercial, industrial, and outdoor settings. Products must employ addressable wired or wireless protocols and ship as finished goods, not discrete LEDs or generic drivers.
Scope exclusion: stand-alone, non-networked LED fixtures and legacy incandescent or fluorescent lamps are kept outside the model.
Segmentation Overview
- By Product Type
- Control Systems
- Smart Lamps and Fixtures
- By Installation Type
- New Construction
- Retrofit
- By Connectivity Technology
- Wi-Fi
- Bluetooth
- Zigbee
- Other Connectivity Technologies
- By End-User
- Residential
- Commercial
- Industrial
- Other End-Users
- By Geography
- North America
- United States
- Canada
- Mexico
- Europe
- Germany
- United Kingdom
- France
- Russia
- Rest of Europe
- Asia-Pacific
- China
- Japan
- India
- South Korea
- Australia
- Rest of Asia-Pacific
- Middle East and Africa
- Middle East
- Saudi Arabia
- United Arab Emirates
- Rest of Middle East
- Africa
- South Africa
- Egypt
- Rest of Africa
- Middle East
- South America
- Brazil
- Argentina
- Rest of South America
- North America
Detailed Research Methodology and Data Validation
Primary Research
Mordor analysts interviewed fixture makers, control-system suppliers, city facility managers, and major electrical wholesalers across North America, Europe, Asia-Pacific, and the Middle East. These discussions validated penetration assumptions, average selling prices, retrofit pace, and expected smart-control attach rates, which sharpened the desk-research baselines.
Desk Research
We began with public datasets from agencies such as the International Energy Agency, Eurostat, and the US Energy Information Administration to size installed lighting stock and energy-efficiency policies. Trade bodies like LightingEurope, the Connected Lighting Alliance, and regional smart-city programs supplied adoption rates, while company 10-Ks, investor decks, and patent libraries added pricing and technology cadence. Subscription tools, D&B Hoovers for corporate revenues and Dow Jones Factiva for global deal flow, helped triangulate channel values. The sources listed illustrate our approach and are not exhaustive; many additional references informed the analysis.
Market-Sizing & Forecasting
A top-down reconstruction started with national building floor area and street pole counts, moved through LED penetration and smart-control attachment, and landed on shipments valued at prevailing ASPs. Supplier roll-ups and sampled project invoices offered bottom-up checkpoints, allowing our team to adjust outliers. Key variables include retrofit ratio, sensor attach price premium, utility rebate intensity, Matter protocol uptake, and smart-city budget trends. Forecasts employ multivariate regression blended with scenario analysis, using GDP growth and electricity tariff outlooks as leading indicators. Gaps in regional channel data are bridged by expert-validated ratios drawn from comparable markets.
Data Validation & Update Cycle
Outputs pass variance checks against historical import data and vendor earnings, then undergo peer review. Reports refresh annually; material events, policy shifts, landmark procurements, and disruptive M&A trigger interim revisions, and a final analyst sweep ensures clients receive the latest view.
Why Mordor's Smart Lighting Baseline Commands Reliability
Published figures vary because firms choose differing product baskets, price bases, and refresh cadences. Our disciplined scope, multi-source variables, and yearly update rhythm temper volatility and keep numbers actionable for planners.
Key gap drivers include whether controls and software are counted, how retrofit activity is captured, and the rigor of primary validation. Others may rely on linear extrapolation or bundle wider IoT devices, which pulls totals apart from real smart lighting spend.
Benchmark comparison
| Market Size | Anonymized source | Primary gap driver |
|---|---|---|
| USD 22.98 B (2025) | Mordor Intelligence | |
| USD 9.86 B (2025) | Global Consultancy A | Focuses on connected bulbs only, omitting fixtures and controls |
| USD 18.00 B (2025) | Industry Research B | Applies uniform growth from a pandemic low with limited field checks |
| USD 34.43 B (2025) | Trade Journal C | Bundles smart home hubs and IoT services, inflating lighting revenue |
The comparison shows that, by selecting a clear scope and balancing top-down modeling with ground feedback, Mordor delivers a transparent, dependable baseline that decision-makers can trace back to tangible market drivers.


Key Questions Answered in the Report
What is the projected value of the smart lighting market in 2031?
The sector is forecast to reach USD 67.83 billion by 2031, growing at a 19.77% CAGR.
Which region will post the fastest revenue growth through 2031?
The Middle East is set to expand at a 20.71% CAGR, propelled by sovereign smart-city mandates.
How are utility incentives shaping commercial retrofits?
Rebates covering up to 50% of fixture costs shorten paybacks to as little as 12 months, accelerating adoption.
Why is Bluetooth mesh gaining popularity over Wi-Fi in residential lighting?
Bluetooth mesh removes the need for dedicated gateways, lowers hardware cost, and operates without relying on congested home-router bandwidth.
How do net-zero building codes influence new-construction demand?
Codes enacted since 2025 require networked lighting controls at the design stage, driving a 20.13% CAGR in new-build installations.
What security measures address wireless-protocol vulnerabilities?
Matter’s cryptographic device-attestation and, in critical sites, wired DALI-2 buses mitigate risks uncovered in Zigbee and Bluetooth LE.
Page last updated on:


