Smart City Platform Market Size and Share
Market Overview
| Study Period | 2020 - 2031 |
|---|---|
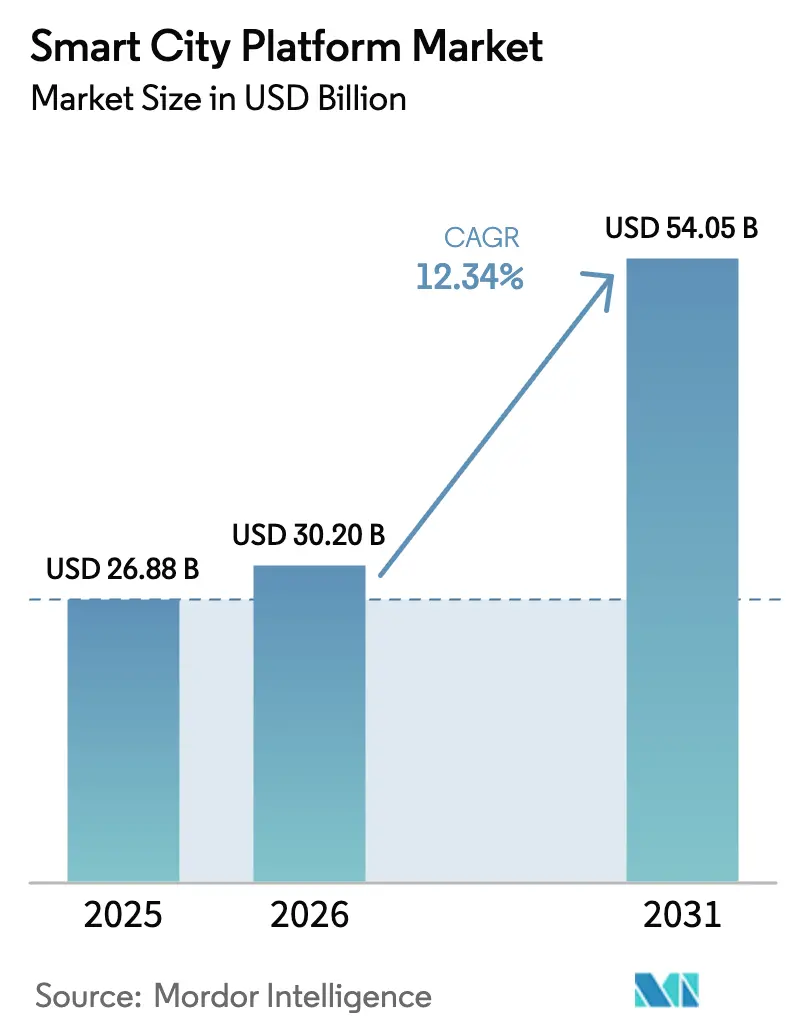
| Market Size (2026) | USD 30.20 Billion |
| Market Size (2031) | USD 54.05 Billion |
| Growth Rate (2026 - 2031) | 12.34% CAGR |
| Fastest Growing Market | Asia Pacific |
| Largest Market | North America |
| Market Concentration | Medium |
Major Players *Disclaimer: Major Players sorted in no particular order Image © Mordor Intelligence. Reuse requires attribution under CC BY 4.0. | |
Smart City Platform Market Analysis by Mordor Intelligence
The smart city platform market size reached USD 30.20 billion in 2026 and is projected to climb to USD 54.05 billion by 2031, delivering a compelling 12.34% CAGR across the forecast horizon. Interoperability mandates, sovereign data rules, and the declining cost of edge inference are reshaping procurement, prompting cities to favor open architectures and hybrid deployment models for latency-sensitive analytics. Cyber-resilience has become a budget equalizer, complemented by network orchestration, while data monetization pilots in Europe and North America validate new revenue streams for municipalities. Funding momentum is strong, with public outlays surpassing USD 38.4 billion in 2025. China, India, and South Korea are utilizing national programs to accelerate the adoption of second-tier cities. At the same time, 5G densification and 420 million LPWAN connections have created a tiered connectivity fabric that lowers per-endpoint costs and broadens the addressable device base.
Key Report Takeaways
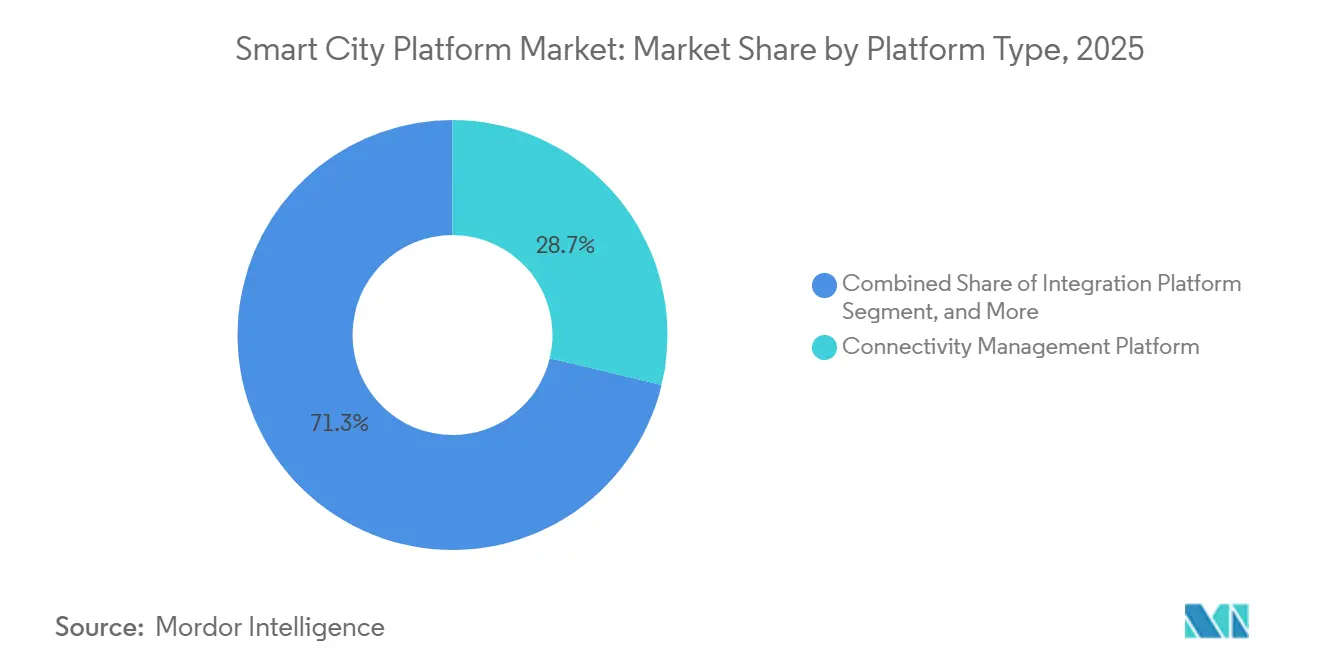
- By platform type, connectivity management platforms led with 28.73% share in 2025, while security platforms are set to post a 13.02% CAGR through 2031.
- By application, smart infrastructure commanded 31.84% of the smart city platform market share in 2025, and smart healthcare is forecast to expand at a 13.55% CAGR through 2031.
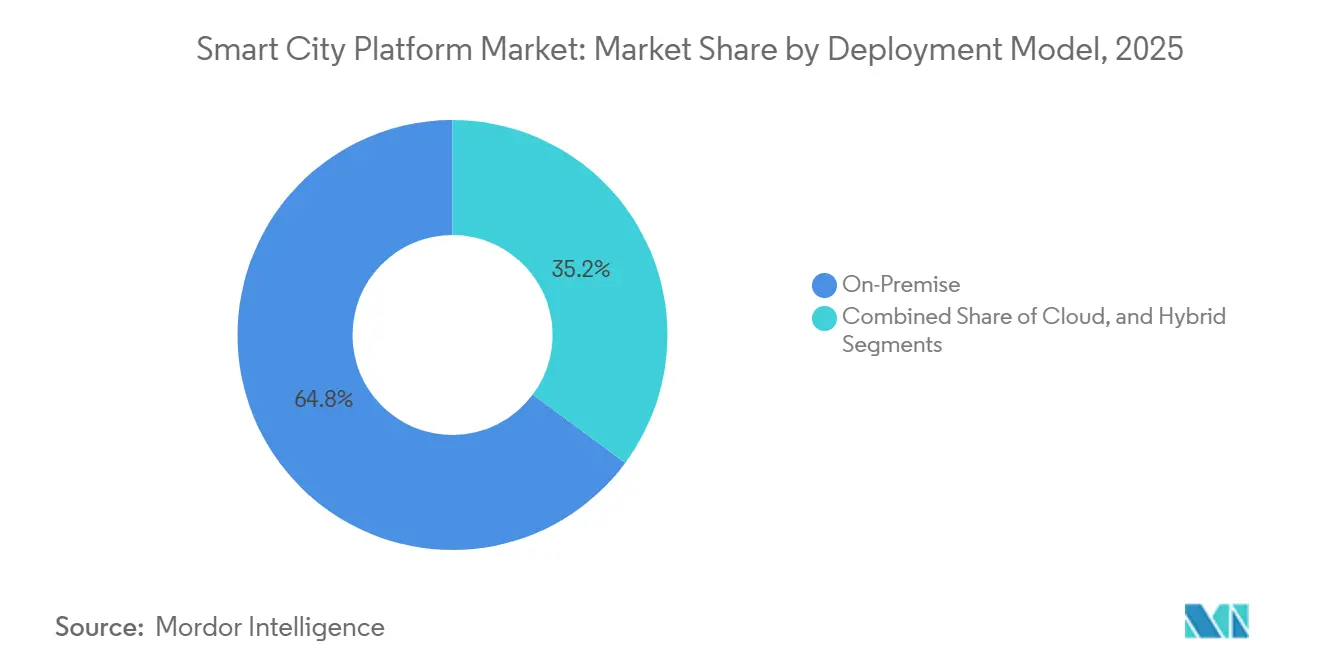
- By deployment model, on-premise installations accounted for 64.84% of the smart city platform market size in 2025, whereas cloud deployments are projected to advance at a 14.05% CAGR to 2031.
- By end user, government and municipalities held 53.84% spending share in 2025, and healthcare providers show the fastest trajectory with a 13.89% CAGR to 2031.
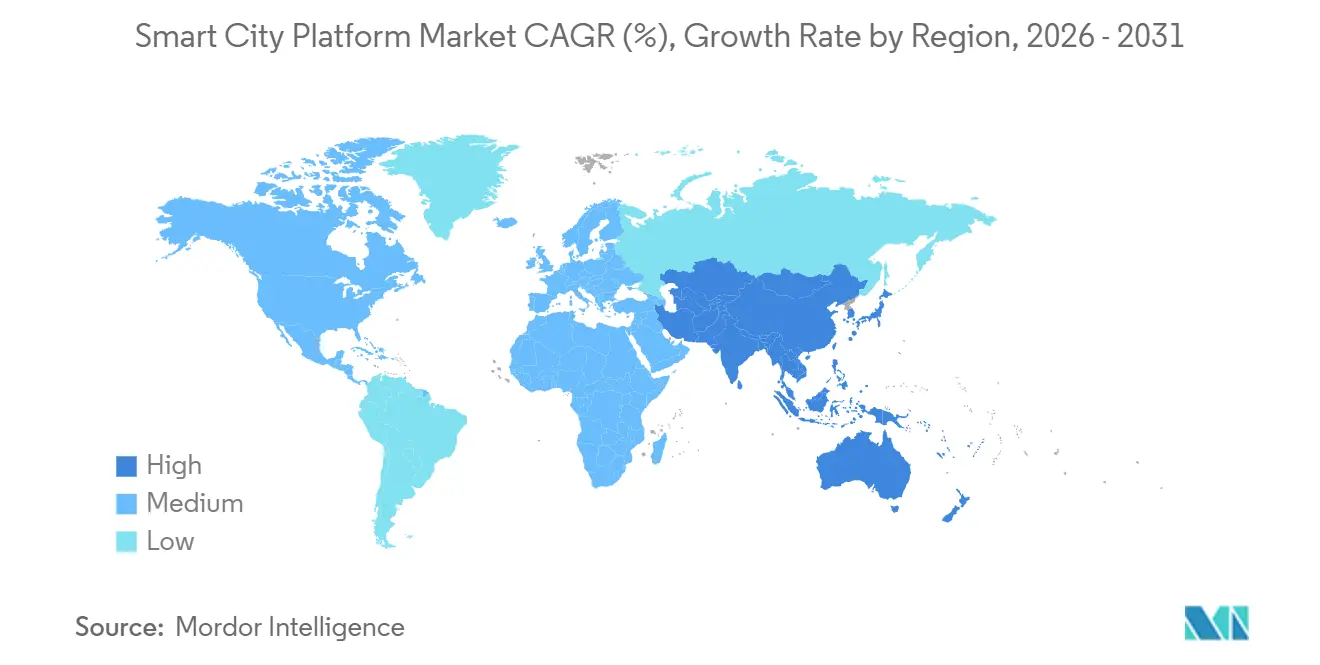
- By geography, North America captured a 38.74% share in 2025, while Asia-Pacific is predicted to grow at a 13.78% CAGR during the forecast window.
Note: Market size and forecast figures in this report are generated using Mordor Intelligence’s proprietary estimation framework, updated with the latest available data and insights as of January 2026.
Global Smart City Platform Market Trends and Insights
Drivers Impact Analysis*
| Driver | (~) % Impact on CAGR Forecast | Geographic Relevance | Impact Timeline |
|---|---|---|---|
| IoT-Device Proliferation Across Urban Infrastructure | +2.8% | Global, with early density in North America and Asia-Pacific core cities | Medium term (2-4 years) |
| Expanding Government Smart-City Funding Programs | +2.5% | North America, Europe, Asia-Pacific (China, India, South Korea) | Short term (≤ 2 years) |
| AI- and Cloud-Enabled Real-Time Analytics Adoption | +2.3% | Global, led by North America and Europe | Medium term (2-4 years) |
| Rapid Roll-Out of 5G and LPWAN Connectivity | +1.9% | Asia-Pacific, North America, Middle East (UAE, Saudi Arabia) | Long term (≥ 4 years) |
| Interoperability Mandates (NGSI-LD, OASC MIMs) | +1.4% | Europe (EU-wide), spillover to South America (Brazil, Argentina) | Long term (≥ 4 years) |
| Monetisation of Municipal Data Marketplaces | +0.9% | Europe, North America (pilot cities), emerging in Asia-Pacific | Long term (≥ 4 years) |
| Source: Mordor Intelligence | |||


IoT-Device Proliferation Across Urban Infrastructure
Global municipal IoT endpoints reached 1.2 billion in 2025, a 41% increase from 2024, as utilities, environmental agencies, and public works departments scaled up connected devices.[1]Cisco Systems, “Cisco Annual Internet Report, 2025,” CISCO.COM Density remains uneven, with tier-one cities averaging 18 devices per capita, while tier-two municipalities average six, obliging platform vendors to support both high-volume, low-latency workloads and battery-constrained networks. Edge inference is now a design prerequisite, for instance, Intel’s OpenVINO toolkit trimmed video-analytics latency by 62% in 47 deployments, freeing bandwidth budgets for additional sensors.[2]Intel Corporation, “OpenVINO Toolkit Deployment Report,” INTEL.COM This distributed pattern reduces backhaul costs, which still exceed USD 0.08 per gigabyte in fiber-poor markets. Vendor strategies, therefore, emphasize auto-scaling data pipelines and plug-and-play device onboarding to address the bifurcated demand profile.
Expanding Government Smart-City Funding Programs
Public investment increased 29% year-over-year to USD 38.4 billion in 2025, creating a vital flywheel for the smart city platform market.[3]National Development and Reform Commission, “New Infrastructure Initiative 2024-2025,” NDRC.GOV.CN The Infrastructure Investment and Jobs Act allocated USD 1.2 billion for U.S. digital infrastructure, while the European Union’s Digital Europe Programme committed EUR 1.8 billion (USD 2.0 billion) through 2027. China, India, and South Korea are channeling funds toward tier-two cities to bridge urban-rural gaps, often stipulating NGSI-LD compliance that benefits vendors with open APIs. Grants speed adoption but simultaneously heighten scrutiny of cybersecurity posture and data governance, prompting cities to incorporate interoperability and zero-trust provisions into RFPs from the outset.
AI and Cloud-Enabled Real-Time Analytics Adoption
Streaming analytics platforms processed 4.7 exabytes of city data monthly in 2025, 53% above 2024 volumes. Microsoft Azure IoT Hub deployments in 312 municipalities demonstrate the demand for event-driven automation that circumvents human latency in areas such as dynamic traffic rerouting. Amazon introduced IoT TwinMaker, allowing planners to stress-test infrastructure virtually;, for instance, Singapore’s transport authority used it to reduce bus commute times by 14%. Data-residency laws in Russia, China, and Gulf states necessitate a coexistence of cloud ramp-up with sovereign-cloud zones, prompting a multi-cloud stance that mitigates vendor lock-in and encourages platform providers to adopt container-based portability.
Rapid Roll-Out of 5G and LPWAN Connectivity
5G sites reached 8.2 million in 2025, while LPWAN connections hit 420 million, enabling a tiered architecture in which latency-critical tasks use 5G and low-data-rate sensors rely on LoRaWAN or NB-IoT. Verizon’s ThingSpace managed 34 million endpoints, generating USD 620 million in recurring revenue, a 41% increase over 2024. The United Arab Emirates now mandates 5G-ready IoT modules in all public projects, a directive echoed across the Gulf. For vendors, the connectivity upshift means platform scalability must accommodate millions of low-cost devices while guaranteeing millisecond-level performance for autonomous mobility and public-safety use cases.
Restraints Impact Analysis*
| Restraint | (~) % Impact on CAGR Forecast | Geographic Relevance | Impact Timeline |
|---|---|---|---|
| Data-Privacy and Cyber-security Concerns | -1.2% | Global, acute in Europe (GDPR), North America (state-level laws) | Short term (≤ 2 years) |
| High Up-Front Capital Expenditure | -1.0% | South America, Africa, Southeast Asia (budget-constrained municipalities) | Medium term (2-4 years) |
| Legacy-System Vendor Lock-In | -0.9% | North America, Europe (cities with 10+ year contracts) | Long term (≥ 4 years) |
| Shortage of City-Level Data-Governance Talent | -0.6% | Global, most severe in tier-two and tier-three cities | Medium term (2-4 years) |
| Source: Mordor Intelligence | |||
Data-Privacy and Cyber-Security Concerns
Municipal ransomware incidents rose 34% in 2025, pushing average remediation costs to USD 4.2 million. Europe’s Network and Information Security Directive 2 now requires 24-hour breach disclosure and penalties of up to 2% of annual revenue for non-compliance. Stricter rules strain vendor economics by increasing compliance overhead by 18% and compel cities to anonymize data, a step that can erode AI accuracy by as much as 19%, according to IEEE researchers. Zero-trust architectures mitigate exposure but necessitate network segmentation and continuous authentication, often delaying deployments by nine months. The policy headwind is particularly acute in privacy-sensitive applications such as healthcare and public-safety video, where citizen opposition can stall project approvals.
High Up-Front Capital Expenditure
A mid-size city needs USD 25-45 million to launch an integrated platform, a hurdle magnified in regions where per-capita IT spend averages only USD 12. Public-private partnerships help shift CapEx to vendors, such as São Paulo’s 2025 concession awarded Telefónica Brasil a 40% data monetization revenue share in exchange for a citywide IoT rollout. Blended finance could unlock USD 18 billion for emerging markets by 2028, yet complex risk-sharing terms lengthen contract cycles. Modular deployments that start with high-ROI use cases such as smart parking, which can fetch USD 1.8 million in annual revenue in a 200,000-population city, are gaining favor. Even so, lingering fears of vendor lock-in and unpredictable maintenance costs remain a brake on rapid scaling outside capital-rich regions.
*Our forecasts treat driver/restraint impacts as directional, not additive. The impact forecasts reflect baseline growth, mix effects, and variable interactions.
Segment Analysis
By Platform Type: Security Platforms Accelerate Amid Rising Threats
Security management platforms are on track for a 13.02% CAGR from 2026 to 2031, reflecting municipal urgency to contain escalating cyber incidents. The segment’s surge contrasts with connectivity management’s 28.73% market-leading share in 2025, where revenue growth is moderating under pricing pressure. Integration platforms, which hold a 22% share in 2025, benefit from cities migrating to microservices that enable them to integrate legacy SCADA systems with contemporary analytics. Device-management products, at roughly 18% share, ride the wave of edge-AI node growth that requires continuous firmware updates. Data-management layers round out the landscape by leveraging NGSI-LD context models to ensure semantic portability across city silos, cementing their role in the smart city platform market.
Competition is intensifying. Cisco’s USD 28 billion acquisition of Splunk illustrated how network observability is converging with security analytics in an integrated stack. NGSI-LD-driven procurement favors open-source solutions with a pedigree, such as FIWARE, which is now active in 89 European municipalities. Vendors embed zero-trust modules, including Palo Alto Networks’ Prisma SASE features, in 23 city deployments to limit IoT attack surfaces. RFP language mirrors the shift as 68% of 2025 tenders mandate built-in threat response integration. As cities ask suppliers to assume cyber-risk, recurring service revenue from managed detection and response is emerging as a future profit pool within the smart city platform industry.


By Application: Healthcare Emerges as the Growth Leader
Smart healthcare is projected to register a 13.55% CAGR to 2031, outpacing every other use case as telemedicine, ambulance routing, and air-quality-linked care become staples of post-pandemic municipal health strategies. Smart infrastructure retained 31.84% of the smart city platform market share in 2025, reflecting the legacy outcome of early LED retrofits that have now been retrofitted with occupancy and daylight sensors. Mobility and transportation applications held roughly 24% share, aided by connected-vehicle pilots, while public-safety analytics contributed about 19%. Utilities and energy management captured 16%, mainly from advanced metering, and citizen-service portals comprise the remainder, with multilingual chatbots gaining traction.
Healthcare synergies illustrate cross-domain value, such as Seoul’s U-Healthcare initiative, which combines wearable and air-quality datasets to alert asthma patients in real-time. Singapore’s IoT fitness stations raised park usage 22% in 2025. Lighting vendors, such as Signify, embed acoustic sensors in luminaires for anomaly detection, resulting in an 18% reduction in police response times in pilot studies. Cybersecurity controls added to IEC 62386 lighting interfaces increase fixture costs by USD 8-12 per unit, but de-risk citywide rollouts, further proving that resilience premiums are now accepted as an overhead in the smart city platform market.
By Deployment Model: Cloud Momentum Outruns Sovereignty Hurdles
Cloud deployments are on pace for a 14.05% CAGR, even as sovereign-cloud rules keep on-premise share high at 64.84% in 2025. Hybrid architectures partition sensitive workloads locally while tapping the cloud for compute-intensive analytics, aided by offerings such as Microsoft Azure Stack in 29 municipalities and AWS Outposts in 18. Oracle’s Cloud@Customer addresses residency hurdles by installing a full region inside client data centers, an approach Dubai adopted for its Smart Dubai initiative. Kubernetes orchestration is mainstream, with 54% of platforms utilizing it for workload portability. Cities weigh the total cost of ownership carefully, as the GAO analysis shows that five-year spending can fall by 23% for compute-heavy tasks but rise by 14% in storage-intensive workloads.
Data governance may slow the ascent of the cloud. The European Data Governance Act imposes constraints on cross-border data transfers, which complicate multi-region architectures. Nevertheless, elasticity and pay-as-you-go economics resonate with mid-size cities that lack capital budgets yet need rapid deployment. Vendors that supply policy-compliant sovereign instances while maintaining API parity with the public cloud will likely secure an outsized share of the growth in the smart city platform market in heavily regulated geographies.
By End User: Healthcare Providers Drive the Fastest Uptake
Healthcare providers are forecast to expand platform spending at 13.89% CAGR to 2031, eclipsing even utilities. The government and municipalities bankroll most projects, accounting for 53.84% of the 2025 expenditure, but their dominance will taper as hospitals, transport agencies, and energy utilities establish independent platforms. Utilities accounted for 21% in 2025, while transit operators accounted for 14%, driven by predictive maintenance that reduced downtime by 28%. Commercial entities, such as property developers, round out the remainder by tapping into foot-traffic analytics to refine site selection.
Joint city-hospital projects underscore convergence. The Cleveland Clinic embedded air-quality sensors throughout its campus, resulting in an 11% reduction in hospital-acquired infection rates. Kaiser Permanente joined Oakland’s smart grid to earn USD 340,000 in annual demand-response incentives. Outcome-based contracts, exemplified by Barcelona’s smart-lighting tender, which ties vendor payments to energy-saving targets, signal a shift toward service-level guarantees expected to spread across every vertical participating in the smart city platform market.
Geography Analysis
North America accounted for 38.74% of the revenue in 2025, driven by federal and provincial grant programs and a growing utility modernization market. Chicago’s Azure Digital Twins rollout across 2,400 buildings exemplifies the region’s tilt toward energy-efficiency use cases, with projected annual savings of USD 14 million. Yet procurement fragmentation persists because the United States lacks a national smart-city mandate, forcing vendors to navigate disparate state rules. Canada’s CAD 75 million (USD 55 million) Smart Cities Challenge funds illustrate how smaller economies catalyze projects through competitive grants. Mexico’s MXN 8.5 billion (USD 500 million) mobility effort demonstrates rising Latin American interest, although budget reallocations after a 2025 cyber breach slowed implementation.
Asia-Pacific is the fastest-growing region, forecast at a 13.78% CAGR as China’s CNY 120 billion (USD 16.8 billion) New Infrastructure Initiative and India’s INR 48,000 crore (USD 5.8 billion) Smart Cities Mission phase two pull tier-two cities into the digital fold. Domestic champions such as Huawei and Alibaba Cloud leverage data-localization policies to capture share, while Japan’s JPY 120 billion (USD 820 million) digital-twin program signals renewed momentum in mature economies. South Korea’s KRW 2.1 trillion (USD 1.6 billion) fund positions the nation as a testing ground for autonomous mobility platforms. Australia’s open-data exchanges appear small in budget terms but generate outsized developer engagement that broadens ecosystem depth.
Europe’s trajectory pivots on interoperability mandates. The EU directive to adopt NGSI-LD by 2026 forces vendors to open proprietary schemas or forfeit access to one of the world’s largest smart city platform markets. National programs in the United Kingdom, Germany, France, Italy, and Spain collectively exceed USD 1.9 billion for 2025 alone. Germany’s EUR 500 million (USD 565 million) connected-vehicle retrofit illustrates how transport applications integrate with broader city platforms. Southern Europe receives targeted allocations to narrow digital divides, evidenced by Italy’s EUR 410 million (USD 464 million) resiliency budget. Spain’s Red.es backs municipal IoT frameworks with EUR 290 million (USD 328 million), employing Barcelona’s Sentilo architecture as a blueprint.
South America, the Middle East, and Africa remain in early adoption mode yet supply landmark projects. Brazil earmarked BRL 1.8 billion (USD 360 million) for mobility upgrades in major cities, although federal negotiations have delayed disbursement. Saudi Arabia’s USD 500 billion NEOM integrates Siemens MindSphere for greenfield infrastructure. South Africa secured African Development Bank financing for a ZAR 480 million (USD 26 million) smart-water platform that slashes non-revenue water by 18%. Nigeria’s NGN 15 billion (USD 10 million) pilot in Lagos and Abuja test-beds traffic management and waste-collection platforms. Limited fiber backbones and power instability still curtail rapid expansion, yet blended finance and modular deployments create footholds for future scaling of the smart city platform market.

Competitive Landscape
The smart city platform market exhibits moderate concentration, with no single supplier controlling more share. However, the top five suppliers hold most of share, leaving space for agile entrants. Infrastructure incumbents, such as Siemens and Schneider Electric, leverage decades-old relationships in utilities and transportation to upsell software. Hyperscalers like Microsoft and Amazon compete on pay-as-you-go economics, easing budget strain for mid-sized cities. Regional specialists, including Quantela and Alibaba Cloud, win business by tailoring solutions to local regulations and payment frameworks.
Patent activity confirms strategic focus on edge intelligence. The USPTO granted 1,240 smart-city-related patents in 2025, with 38% centered on edge-AI inference and 22% on energy-harvesting modules. Standards evolution is also a competitive lever as 127 cities endorse OASC Minimal Interoperability Mechanisms, and 54% of European RFPs now require NGSI-LD compliance. Vendors slow to open APIs risk exclusion from EU-funded projects and fast-growing South American tenders modeled on European rules.
Strategic moves underscore consolidation and capability gaps. Siemens earmarked EUR 450 million (USD 495 million) for edge-node expansion to meet EU data-residency mandates. Schneider Electric purchased Planon for EUR 680 million (USD 748 million) to merge energy and space optimization. Huawei’s CNY 3.2 billion (USD 448 million) Shenzhen contract will connect 8 million endpoints, cementing its domestic lead amid export restrictions. Amazon’s FleetWise for Smart Cities piloted in Seattle and Austin, slicing commute times 11% and proving hyperscaler credibility in traffic management. Start-ups differentiate through modular Kubernetes-native stacks such as QuantelaOS enables incremental rollouts in India, winning 12 city deals without full-platform lock-in.
Market dynamics suggest a continuing tug-of-war between open and proprietary ecosystems. Cities prioritize cyber-resilience and data sovereignty, nudging vendors toward zero-trust frameworks and sovereign-cloud configurations. Consumption-based pricing and outcome-linked contracts will likely intensify as municipalities seek to shift risk to suppliers while ensuring measurable service levels, pushing the smart city platform market toward deeper specialization and service-driven revenue models.
Smart City Platform Industry Leaders
Nokia Corporation
Microsoft Corporation
Hitachi Ltd.
Huawei Technologies Co., Ltd.
Schneider Electric SE
- *Disclaimer: Major Players sorted in no particular order

Recent Industry Developments
- December 2025: Siemens announced a EUR 450 million (USD 495 million) MindSphere capacity expansion in Germany, France, and Spain to satisfy low-latency analytics needs across energy and mobility projects.
- November 2025: Microsoft partnered with Chicago to deploy Azure Digital Twins across 2,400 municipal buildings, targeting an 18% electricity cut and USD 14 million in annual savings.
- October 2025: Huawei won a CNY 3.2 billion (USD 448 million) contract with Shenzhen for a 5G-enabled IoT network covering 8 million endpoints, slated for 2027 completion.
- September 2025: Schneider Electric bought Planon for EUR 680 million (USD 748 million) to strengthen space-optimization within its EcoStruxure platform.


Global Smart City Platform Market Report Scope
The Smart City Platform Market Report is Segmented by Platform Type (Connectivity Management, Integration, Device Management, Data Management, Security Management), Application (Smart Mobility/Transportation, Smart Security and Public Safety, Smart Utilities, Smart Governance and Citizen Services, Smart Infrastructure, Smart Healthcare), Deployment Model (On-Premise, Cloud, Hybrid), End-User (Government and Municipalities, Utilities and Energy Providers, Transportation and Logistics Operators, Healthcare Providers, Other Commercial Enterprises), and Geography (North America, South America, Europe, Asia-Pacific, Middle East and Africa). The Market Forecasts are Provided in Terms of Value (USD).
| Connectivity Management Platform |
| Integration Platform |
| Device Management Platform |
| Data Management Platform |
| Security Management Platform |
| Smart Mobility / Transportation |
| Smart Security and Public Safety |
| Smart Utilities (Energy / Water) |
| Smart Governance and Citizen Services |
| Smart Infrastructure (Buildings / Street Lighting) |
| Smart Healthcare |
| On-Premise |
| Cloud |
| Hybrid |
| Government and Municipalities |
| Utilities and Energy Providers |
| Transportation and Logistics Operators |
| Healthcare Providers |
| Other Commercial Enterprises |
| North America | United States | |
| Canada | ||
| Mexico | ||
| South America | Brazil | |
| Argentina | ||
| Rest of South America | ||
| Europe | United Kingdom | |
| Germany | ||
| France | ||
| Italy | ||
| Spain | ||
| Rest of Europe | ||
| Asia-Pacific | China | |
| Japan | ||
| India | ||
| South Korea | ||
| Australia and New Zealand | ||
| Rest of Asia Pacific | ||
| Middle East and Africa | Middle East | Saudi Arabia |
| United Arab Emirates | ||
| Turkey | ||
| Rest of Middle East | ||
| Africa | South Africa | |
| Nigeria | ||
| Rest of Africa | ||
| By Platform Type | Connectivity Management Platform | ||
| Integration Platform | |||
| Device Management Platform | |||
| Data Management Platform | |||
| Security Management Platform | |||
| By Application | Smart Mobility / Transportation | ||
| Smart Security and Public Safety | |||
| Smart Utilities (Energy / Water) | |||
| Smart Governance and Citizen Services | |||
| Smart Infrastructure (Buildings / Street Lighting) | |||
| Smart Healthcare | |||
| By Deployment Model | On-Premise | ||
| Cloud | |||
| Hybrid | |||
| By End-User | Government and Municipalities | ||
| Utilities and Energy Providers | |||
| Transportation and Logistics Operators | |||
| Healthcare Providers | |||
| Other Commercial Enterprises | |||
| By Geography | North America | United States | |
| Canada | |||
| Mexico | |||
| South America | Brazil | ||
| Argentina | |||
| Rest of South America | |||
| Europe | United Kingdom | ||
| Germany | |||
| France | |||
| Italy | |||
| Spain | |||
| Rest of Europe | |||
| Asia-Pacific | China | ||
| Japan | |||
| India | |||
| South Korea | |||
| Australia and New Zealand | |||
| Rest of Asia Pacific | |||
| Middle East and Africa | Middle East | Saudi Arabia | |
| United Arab Emirates | |||
| Turkey | |||
| Rest of Middle East | |||
| Africa | South Africa | ||
| Nigeria | |||
| Rest of Africa | |||


Key Questions Answered in the Report
What is the current value of the smart city platform market?
The smart city platform market size reached USD 30.20 billion in 2026 and is projected to reach USD 54.05 billion by 2031.
Which application is growing the fastest within city platforms?
Smart healthcare is the fastest-growing application, forecast to post a 13.55% CAGR through 2031 on the back of telemedicine and integrated patient-monitoring rollouts.
How significant is cybersecurity spending in new municipal projects?
Security platforms are expected to rise at a 13.02% CAGR as cities allocate up to 22% of their platform budgets to cyber-resilience measures.
Which region will add the most incremental revenue by 2031?
Asia-Pacific is poised for the largest absolute gain, fueled by substantial national programs in China, India, Japan, and South Korea and a forecast regional CAGR of 13.78%.
Do sovereign-cloud rules hinder cloud platform growth?
Despite strict data-localization mandates in multiple jurisdictions, cloud deployments are still set to grow at 14.05% CAGR as hybrid and sovereign variants satisfy compliance requirements.
Page last updated on:


