Smart Government Market Size and Share
Market Overview
| Study Period | 2020 - 2031 |
|---|---|
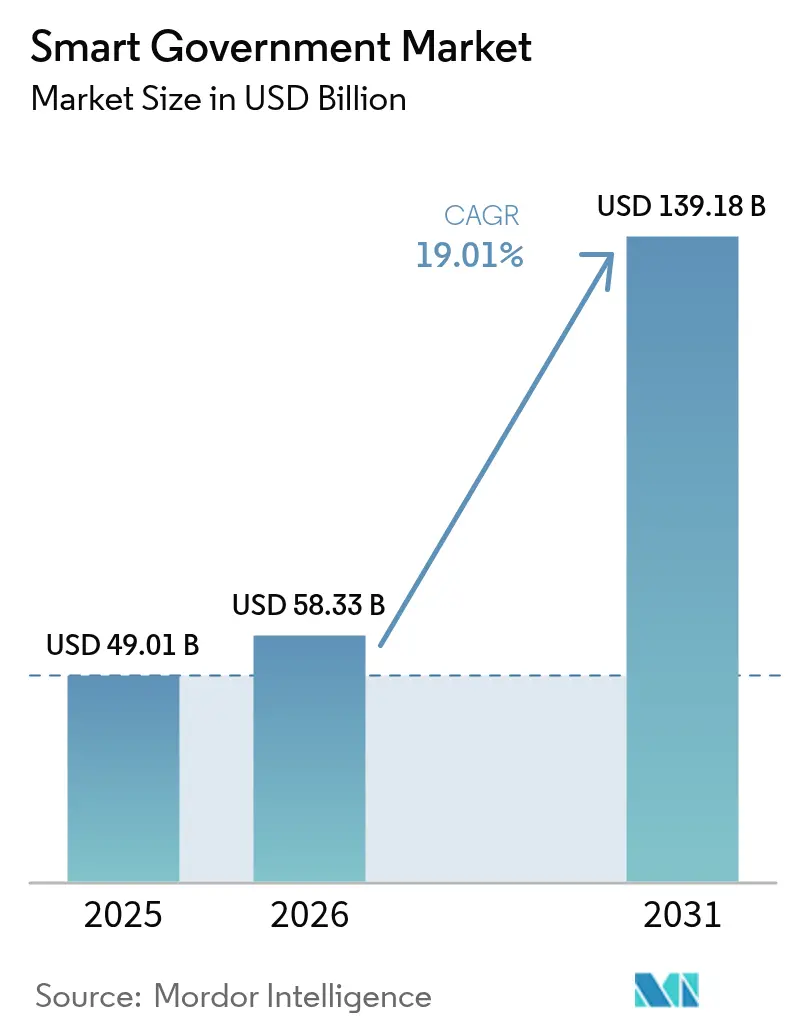
| Market Size (2026) | USD 58.33 Billion |
| Market Size (2031) | USD 139.18 Billion |
| Growth Rate (2026 - 2031) | 19.01% CAGR |
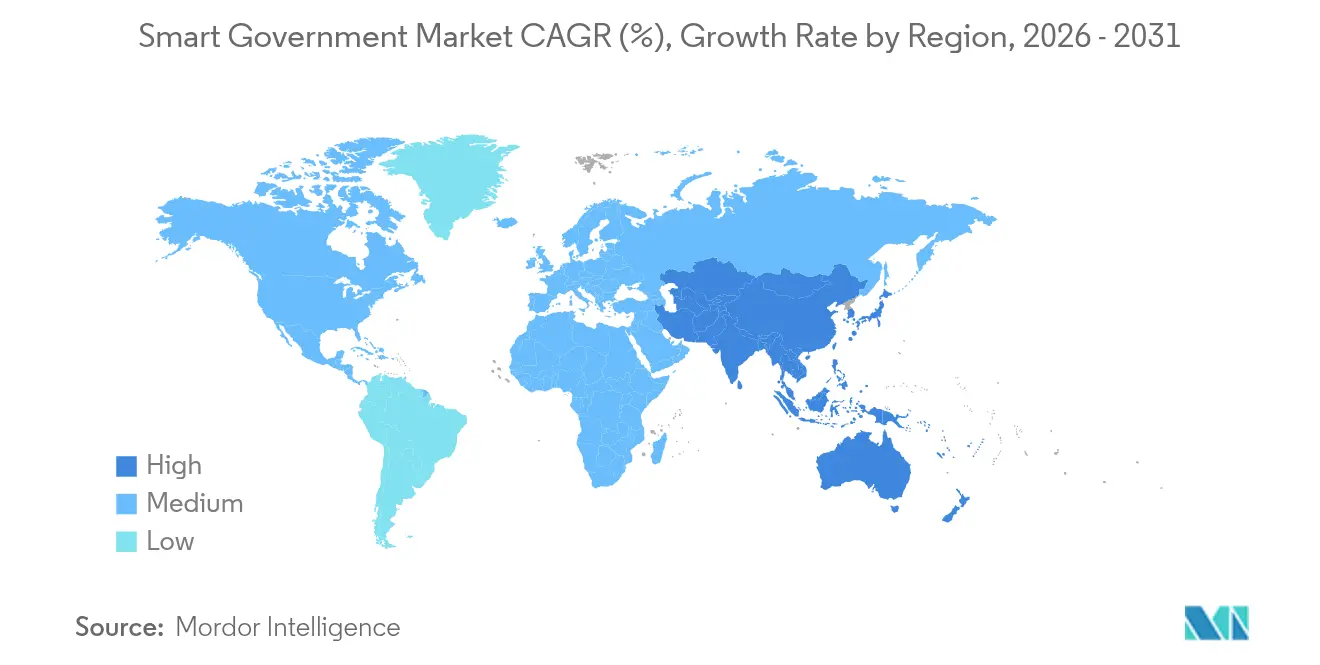
| Fastest Growing Market | Asia Pacific |
| Largest Market | North America |
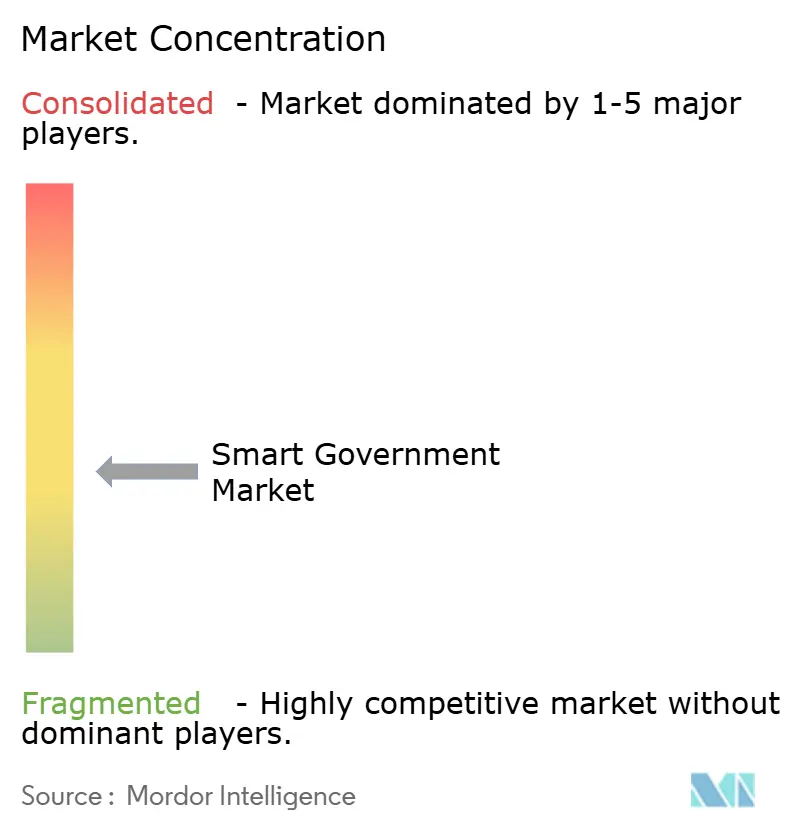
| Market Concentration | Medium |
Major Players *Disclaimer: Major Players sorted in no particular order Image © Mordor Intelligence. Reuse requires attribution under CC BY 4.0. | |
Smart Government Market Analysis by Mordor Intelligence
The Smart Government market size was valued at USD 49.01 billion in 2025 and estimated to grow from USD 58.33 billion in 2026 to reach USD 139.18 billion by 2031, at a CAGR of 19.01% during the forecast period (2026-2031). Governments are embracing digital-first operating models to align with citizen expectations shaped by consumer technology and to safeguard service continuity during disruptions. Mandates ranging from Abu Dhabi’s AED 13 billion AI-native program to India’s expanding digital public infrastructure are catalyzing large-scale platform rollouts. Cloud migration, AI-infused analytics, and integrated identity systems are displacing siloed solutions, while climate-resilience responsibilities expand the technology remit into environmental monitoring. Competitive intensity is rising as incumbent software majors, systems integrators, and specialist GovTech providers battle for multi-year contracts that hinge on implementation expertise rather than point-product features.
Key Report Takeaways
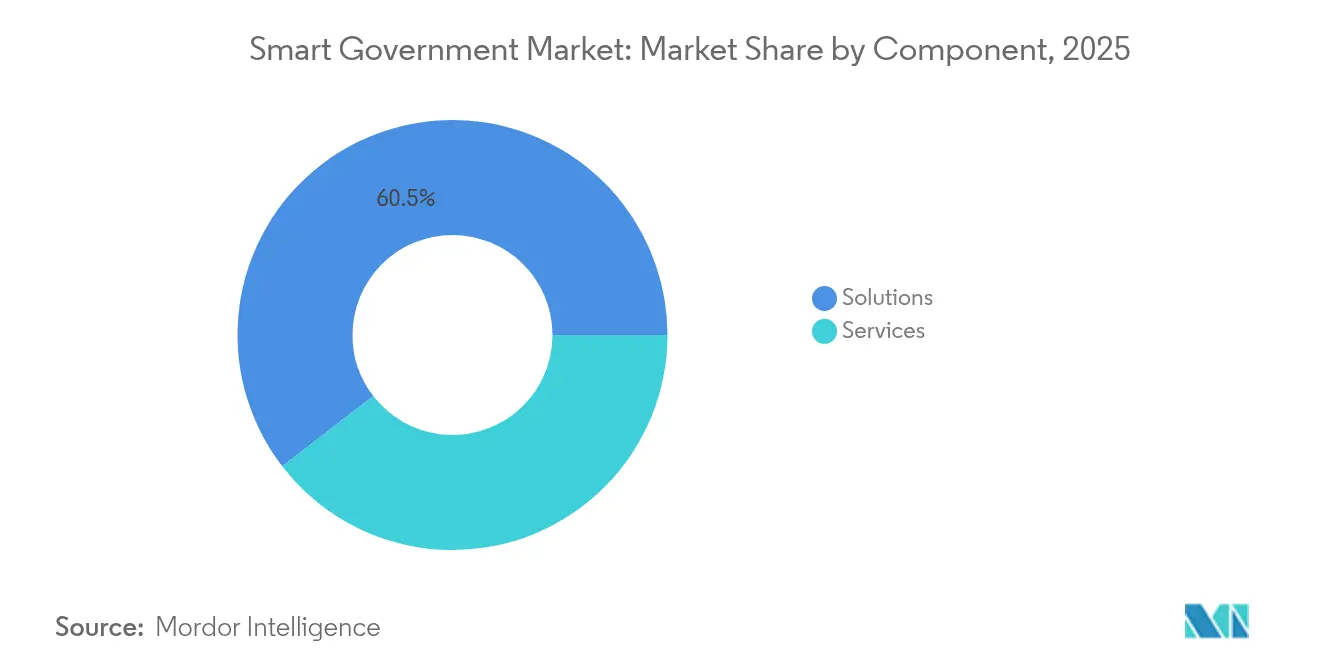
- By component, Solutions led with 60.45% revenue share in 2025; Services are forecast to expand at a 20.03% CAGR to 2031.
- By deployment model, Cloud deployments held 66.30% of the Smart Government market share in 2025, while hybrid and edge configurations push Cloud to a 20.65% CAGR through 2031.
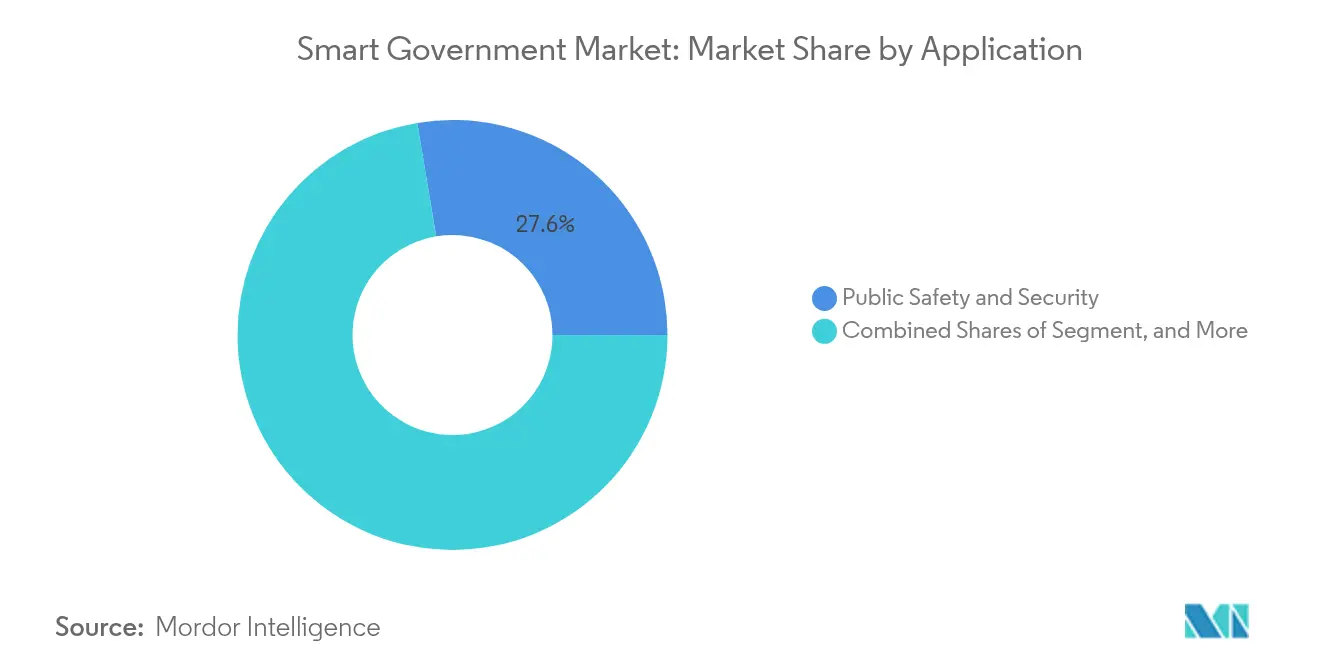
- By application, Public Safety and Security accounted for a 27.62% share of the Smart Government market size in 2025 and Environmental and Infrastructure Monitoring is advancing at a 20.12% CAGR through 2031.
- By end-user level, National/Federal agencies captured 44.40% of spending in 2025; State/Provincial governments record the highest projected CAGR at 20.31% to 2031.
- By geography, North America commanded 37.70% share in 2025, whereas Asia Pacific is the fastest-growing region with a 21.05% CAGR through 2031.
Note: Market size and forecast figures in this report are generated using Mordor Intelligence’s proprietary estimation framework, updated with the latest available data and insights as of 2026.
Global Smart Government Market Trends and Insights
Drivers Impact Analysis*
| Driver | (~) % Impact on CAGR Forecast | Geographic Relevance | Impact Timeline |
|---|---|---|---|
| Government initiatives for digital transformation | +4.2% | Global with strong momentum in UAE, Singapore, Estonia | Medium term (2-4 years) |
| Growing adoption of cloud-based government IT | +3.8% | North America and EU core, spill-over to APAC | Short term (≤ 2 years) |
| AI-driven citizen-centric analytics | +3.1% | APAC core, North America, selective EU uptake | Medium term (2-4 years) |
| Government-as-a-Platform procurement model | +2.3% | North America and EU, emerging in APAC | Long term (≥ 4 years) |
| Contact-free biometric identity programs | +2.0% | Global, rapid acceleration in MEA and APAC | Short term (≤ 2 years) |
| Climate-resilience monitoring mandates | +1.8% | EU core, expanding to North America and APAC | Long term (≥ 4 years) |
| Source: Mordor Intelligence | |||
Government initiatives for digital transformation
Executive mandates now impose strict performance targets that override lengthy procurement cycles, turning transformation projects into time-boxed, compliance-driven programs. President Biden’s Executive Order 14144 prescribes AI security requirements across all federal agencies, locking in multi-year software investments.[1]Federal Register, “Executive Order 14144,” federalregister.gov The UAE’s Digital Government Strategy aims for 100% service digitization and 90% satisfaction by 2025, setting a global benchmark for holistic stack modernization.[2]UAE Government, “Digital Government Strategy 2025,” u.ae Sub-national bodies replicate these frameworks to preserve interoperability and satisfy rising user-experience benchmarks, amplifying addressable demand well beyond the original sovereign mandates.
Growing adoption of cloud-based government IT
Cloud migration converts capital outlay into predictable operating expense, letting agencies unlock enterprise-grade capabilities and achieve 50%-60% cost savings on operations. U.S. federal cloud budgets have quintupled since 2016, while Singapore’s Land Transport Authority trimmed compute costs by 60% post-migration.[3]Asian Development Bank, “Singapore LTA Cloud Case Study,” adb.org Although legacy lock-in remains a concern—highlighted by UK renegotiation challenges with entrenched vendors—platforms that guarantee portability win favor, pushing cloud penetration across every service tier.
AI-driven citizen-centric analytics
Artificial intelligence shifts government from reactive service roles to predictive engagement. Over 70% of agencies expect to embed AI in decision workflows by 2026, with prototypes already showing 35% budget savings over 10 years. Finland’s AI-powered social services identify at-risk citizens before crises emerge, while California applies generative AI to parse complex bills at legislative speed. AI convergence with verified digital IDs tailors interactions at scale and accelerates vendor evaluations toward integrated AI platforms.
Government-as-a-Platform procurement model
Shared infrastructure unified via standard APIs reduces contract sprawl and speeds multi-agency rollout. The Government Finance Officers Association advocates platform strategies to ensure cohesion among diverse suppliers. Estonia transacts 99% of services online through an interoperable backbone that trims operational overhead. This blueprint curbs lock-in, encourages outcome-based contracting, and positions vendors with open architectures for long-term wins.
Restraints Impact Analysis*
| Restraint | (~) % Impact on CAGR Forecast | Geographic Relevance | Impact Timeline |
|---|---|---|---|
| Lack of uniform data-sharing laws | -2.1% | Global, acute in EU and emerging markets | Long term (≥ 4 years) |
| Data-privacy and cyber-theft concerns | -1.8% | Global, heightened in EU and North America | Medium term (2-4 years) |
| Public-sector digital-skills gap | -1.5% | Global, severe in emerging markets and rural areas | Long term (≥ 4 years) |
| SaaS vendor lock-in risk | -1.2% | North America and EU core, rising in APAC | Medium term (2-4 years) |
| Source: Mordor Intelligence | |||
Lack of uniform data-sharing laws
Fragmented regulations force vendors into jurisdiction-specific builds, undermining economies of scale and delaying rollouts. New EU rules, such as DORA and NIS2, raise compliance overhead that many agencies are unprepared to absorb. Data-sovereignty statutes in China and Russia compel local hosting, fracturing global solution footprints, and inflating costs.
Data-privacy and cyber-theft concerns
As cyberattacks intensify, agencies pivot to risk-averse strategies that lengthen procurement cycles and favor incumbents. The U.S. Department of Justice introduced national-security review programs to scrutinize foreign technology suppliers. Ninety percent of agencies admit cybersecurity upskilling remains unfinished, hindering rapid adoption of next-gen solutions.
*Our forecasts treat driver/restraint impacts as directional, not additive. The impact forecasts reflect baseline growth, mix effects, and variable interactions.
Segment Analysis
By Component: Services Accelerate Implementation Success
Services revenue expands at a 20.03% CAGR to 2031, eclipsing solution growth and underscoring that execution quality dictates Smart Government outcomes. Systems integration and managed services packages now accompany most bids because agencies lack the staff depth to orchestrate complex multi-vendor ecosystems. The Services rise parallels procurement language that values outcome-based milestones over discrete product features. Consequently, strategic consultancies increase M&A activity to secure niche GovTech expertise, while platform vendors embed professional services to lock in recurring revenue.
Solutions retain 60.45% of the Smart Government market in 2025 as governments still equate tangible software with project progress. However, contracts are shifting toward bundled offerings where services underpin time-to-value assurances. Providers with continuous-delivery frameworks and public-sector certifications gain an edge because they mitigate schedule slippage, a chronic pain point in multi-year programs. The change favors end-to-end partners capable of aligning transformation roadmaps with policy mandates, positioning consultative engagement as a critical differentiator.


By Deployment Model: Cloud Dominance Reshapes Infrastructure
Cloud models hold 66.30% share of the Smart Government market size in 2025 on the strength of elastic cost structures, pay-as-you-go pricing, and built-in compliance tooling. Adoption accelerates at a 20.65% CAGR because public cloud now meets or surpasses agency security baselines. Hybrid strategies persist as stepping-stones, giving IT leaders breathing space to rationalize legacy mainframes while steering new workloads into federally certified regions.
Success metrics reveal a convergence with private-sector norms: 63% of government cloud projects achieve stated objectives, narrowing the gap with enterprise benchmarks. Remaining shortfalls stem from project-management complexity rather than platform limitations, suggesting that common playbooks and skilled integrators are closing maturity gaps. Edge compute use cases, especially in remote border security and disaster response, illustrate that cloud is evolving into a distributed continuum, not a single destination.
By Application: Environmental Monitoring Surges on Climate Mandates
Environmental and Infrastructure Monitoring grows at a 20.12% CAGR, surpassing even high-priority Public Safety investments. Agencies allocate new sustainability budgets toward sensor grids, AI-driven predictive analytics, and early-warning dashboards that cut disaster-recovery costs. Municipal leaders highlight flood-prediction pilots that saved USD 120 million in avoided damage during 2024 typhoons, nurturing wider acceptance of data-driven resilience planning.
Public Safety and Security, while still the largest slice at 27.62%, exhibits steady funding due to statutory obligations rather than fresh innovation. Investment tilts toward smarter surveillance, 911 modernizations, and AI-supported incident response. Meanwhile, Citizen Engagement Platforms benefit from digital-first policies that target 90% satisfaction scores, demonstrating that resident-facing services command a growing budget share when tied to measurable experience improvements.
By End-user Level: State/Provincial Acceleration Drives Decentralization
State and provincial entities post the fastest 20.31% CAGR as frontline service delivery demands nimble, citizen-centric technology. Smaller jurisdictions exploit cloud templates and low-code tooling to deploy portals within months, bypassing the heavier bureaucracy that slows federal peers. Demonstrated wins—such as a Midwest U.S. state shrinking benefit-application times from 45 days to 5—showcase rapid ROI and spur peer adoption.
National agencies still concentrate 44.40% of total outlays because large-scale backbone projects like census modernization and defense logistics require deep pockets. Yet their slower 15%-range growth signals a pivot toward cross-government platforms seeded by earlier provincial proofs-of-concept. Vendors thus court regional projects as beachheads that later scale into ministerial or federal expansions, leveraging interoperable architectures to de-risk enterprise-wide rollouts.
Geography Analysis
North America starts with a dominant 37.70% stake and continues to funnel sizeable federal and state resources into artificial intelligence, zero-trust security, and citizen experience redesigns. The USD 150 billion AI investment pledge underpins a national shift toward algorithmic policy execution, while states such as California validate generative AI for legislative due-diligence tasks. Canada’s Digital Ambition reinforces bilingual service parity and omnichannel accessibility, showing how federalism and diversity shape program scoping. Although spending capacity is unrivaled, entrenched legacy systems still elongate procurement cycles, nudging agencies toward phased modernization anchored by cloud service contracts that bake in cybersecurity and continuous-delivery upgrades.
Asia Pacific outpaces every other region with its 21.05% CAGR and expansive national transformation roadmaps. Singapore finances AI Centers of Excellence, India expands Aadhaar-linked public services, and Vietnam funnels public-private grants into broadband corridors. Rapid urbanization forces city governments to digitize planning, transport, and environmental monitoring almost in lockstep, making the Smart Government market ripe for modular, replicable platforms. Vendors with agile delivery frameworks meet these compressed timelines, whereas rigid perpetual-license models find fewer takers.
Europe enjoys steady momentum undergirded by Brussels-level coordination that drives uniform standards for data portability and security. Projects tap EUR 200 billion in InvestAI funds, prompting member states to synchronize procurement calendars and tech stacks. The UK’s independent GOV.UK Wallet trials showcase how sovereign strategies can coexist with broader continental norms, ultimately setting references that echo well beyond the bloc. High compliance thresholds elevate the role of local vendors versed in EU digital sovereignty, though non-EU suppliers that certify against GDPR and DORA remain competitive.

Competitive Landscape
The Smart Government market remains moderately fragmented, with no single provider controlling more than a tenth of total revenues. Enterprise giants—IBM, Microsoft, Oracle, and SAP—continue to leverage scale, but their edge erodes when projects demand flexible, citizen-facing innovations. Systems integrators such as Accenture and Deloitte fill skills gaps and acquire niche GovTech startups to bundle advisory, build, and run services under one contract. Purpose-built players like Tyler Technologies and CentralSquare carve durable niches in permitting, public safety, and financial systems, often securing decade-long renewals due to domain depth and municipality familiarity.
Strategic alliances are multiplying. IBM’s acquisition of AST strengthens Oracle ERP migration muscle, while its Connect360 tie-up with Microsoft merges legacy domain expertise with hyperscale cloud reach. Private equity fuels roll-ups that assemble complementary portfolios and expand geographic reach; CentralSquare’s buyout of Tellus stands as a recent example. Emerging challengers such as GovSignals exploit AI to streamline procurement workflows and promise outcome-based billing that resonates with budget-constrained agencies.
Interoperability and data-sovereignty demands create white-space for platform providers that decouple application logic from proprietary stacks. Open-standards champions pitch their architectures as hedge-free, easing long-term exit strategies and attracting buyers wary of past lock-in. Meanwhile, cybersecurity certifications have become table stakes: FedRAMP High, ISO 27001, and country-specific “protected-data” clearances now rank alongside price and functionality in evaluations. Vendors lacking these attestations concede territory to certified competitors even when feature sets align.
Smart Government Industry Leaders
Amazon Web Services, Inc.
Cisco Systems, Inc.
ABB
Capgemini
IBM
- *Disclaimer: Major Players sorted in no particular order

Recent Industry Developments
- June 2025: EasyPark closed its acquisition of Flowbird, creating an end-to-end urban mobility suite spanning parking, ticketing, and public transit.
- May 2025: IBM committed USD 150 billion over five years to American AI and quantum research aimed at government workloads.
- April 2025: California deployed generative AI to cut building-permit approval times and bolster wildfire recovery analytics.
- January 2025: Abu Dhabi unveiled a AED 13 billion (USD 3.5 billion) blueprint to operate the world’s first fully AI-native government by 2027, unlocking 5,000 jobs.


Global Smart Government Market Report Scope
Smart Government is an extension of e-government, which applies information, communication, and operational technologies to all operational areas across multiple domains, process areas, and jurisdictions to generate sustainable public value.
The scope of the study is currently focused on key regions such as North America, Europe, Asia-Pacific, Latin America, and Middle East & Africa. The study also tracks the key market parameters, underlying growth influencers, and major vendors operating in the industry, which supports the market estimations and growth rates over the forecast period.
The market sizes and forecasts are provided in terms of value (USD million) for all the above segments.
| Solutions |
| Services |
| On-premise |
| Cloud |
| Hybrid |
| Resource Planning (GRP/ERP) |
| Public Safety and Security |
| Citizen Engagement Platforms |
| Environmental and Infrastructure Monitoring |
| Smart Mobility and Transport |
| National/Federal |
| State/Provincial |
| Local/Municipal |
| North America | United States |
| Canada | |
| Mexico | |
| South America | Brazil |
| Argentina | |
| Rest of South America | |
| Europe | Germany |
| United Kingdom | |
| France | |
| Italy | |
| Spain | |
| Russia | |
| Rest of Europe | |
| Asia Pacific | China |
| Japan | |
| India | |
| South Korea | |
| Rest of Asia Pacific | |
| Middle East | Saudi Arabia |
| United Arab Emirates | |
| Turkey | |
| Rest of Middle East | |
| Africa | South Africa |
| Nigeria | |
| Egypt | |
| Rest of Africa |
| By Component | Solutions | |
| Services | ||
| By Deployment Model | On-premise | |
| Cloud | ||
| Hybrid | ||
| By Application | Resource Planning (GRP/ERP) | |
| Public Safety and Security | ||
| Citizen Engagement Platforms | ||
| Environmental and Infrastructure Monitoring | ||
| Smart Mobility and Transport | ||
| By End-user Level | National/Federal | |
| State/Provincial | ||
| Local/Municipal | ||
| By Geography | North America | United States |
| Canada | ||
| Mexico | ||
| South America | Brazil | |
| Argentina | ||
| Rest of South America | ||
| Europe | Germany | |
| United Kingdom | ||
| France | ||
| Italy | ||
| Spain | ||
| Russia | ||
| Rest of Europe | ||
| Asia Pacific | China | |
| Japan | ||
| India | ||
| South Korea | ||
| Rest of Asia Pacific | ||
| Middle East | Saudi Arabia | |
| United Arab Emirates | ||
| Turkey | ||
| Rest of Middle East | ||
| Africa | South Africa | |
| Nigeria | ||
| Egypt | ||
| Rest of Africa | ||


Key Questions Answered in the Report
What is the current size of the Smart Government market and where is it heading by 2031?
The market stands at USD 58.33 billion in 2026 and is projected to reach USD 139.18 billion by 2031 on a 19.01% CAGR trajectory during 2026-2031.
Which geographic region offers the fastest growth opportunity for Smart Government vendors?
Asia Pacific is the fastest-growing area, expanding at a 21.05% CAGR through 2031 as programs in Singapore, India, and China drive large-scale deployments.
Which deployment model dominates public-sector digital transformation projects?
Cloud deployments already command 66.30% of Smart Government market share in 2025 and are advancing at a 20.65% CAGR as agencies prioritize scalable, compliant infrastructure through 2031.
Which application segment is seeing the strongest investment momentum?
Environmental and Infrastructure Monitoring leads growth with a 20.12% CAGR, propelled by climate-resilience mandates that require IoT sensors and predictive analytics through 2031.
How are government buyers balancing solutions versus services spending?
Solutions keep a 60.45% revenue share, but Services are growing faster at 20.03% CAGR because agencies value implementation expertise to de-risk complex rollouts through 2031.
What key challenges could slow Smart Government adoption?
Non-uniform data-sharing laws, escalating cybersecurity concerns, and a public-sector digital-skills gap together reduce the overall growth outlook by about 5.4 percentage points.
Page last updated on:


