AI Platform Market Size and Share
Market Overview
| Study Period | 2020 - 2031 |
|---|---|
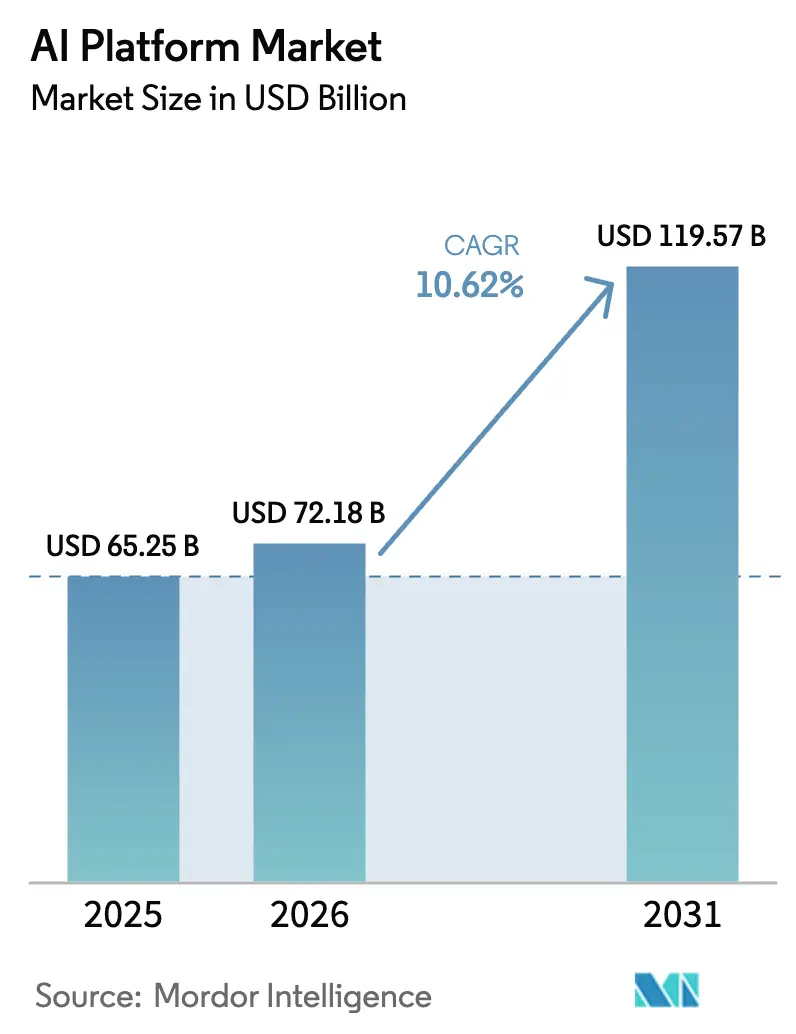
| Market Size (2026) | USD 72.18 Billion |
| Market Size (2031) | USD 119.57 Billion |
| Growth Rate (2026 - 2031) | 10.62% CAGR |
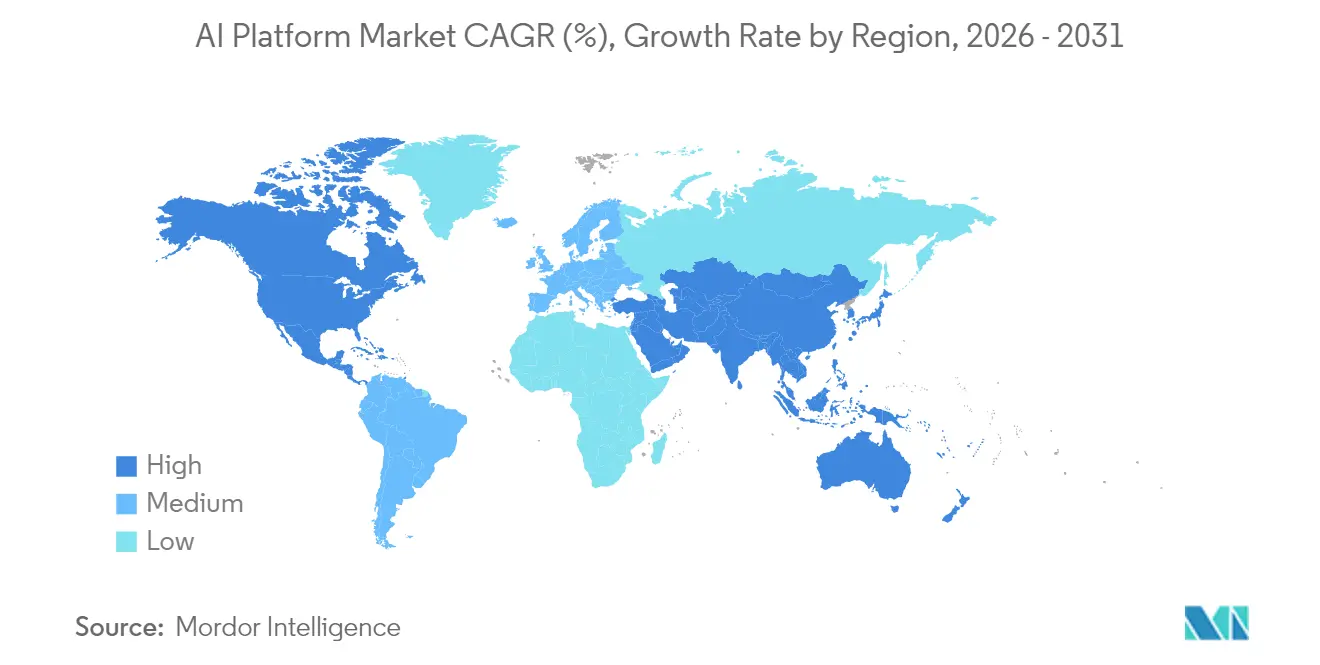
| Fastest Growing Market | Asia Pacific |
| Largest Market | North America |
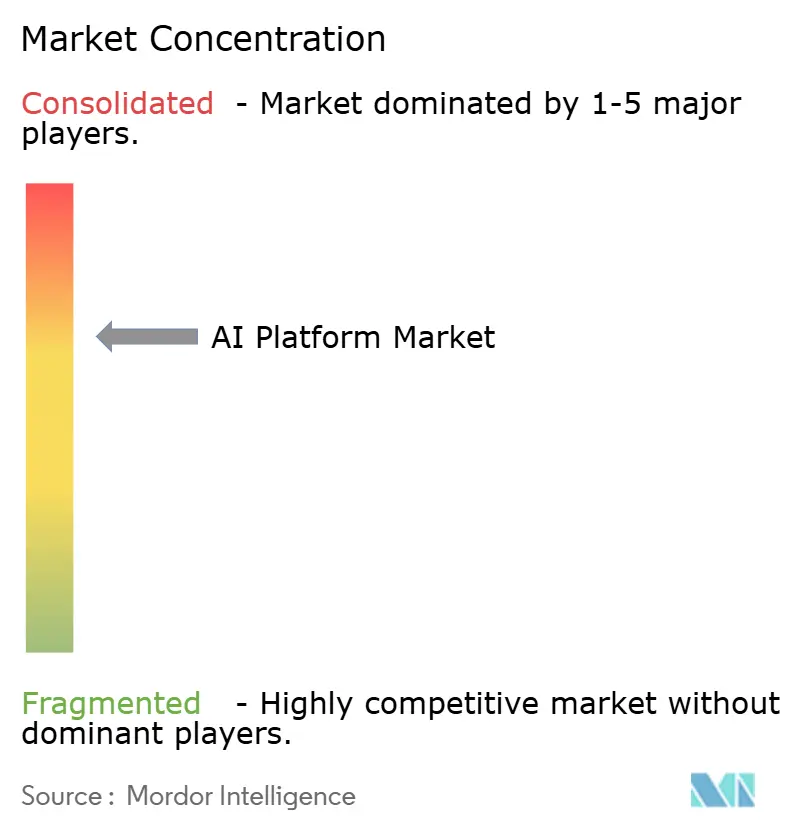
| Market Concentration | Medium |
Major Players *Disclaimer: Major Players sorted in no particular order Image © Mordor Intelligence. Reuse requires attribution under CC BY 4.0. | |
AI Platform Market Analysis by Mordor Intelligence
AI platform market size in 2026 is estimated at USD 72.18 billion, growing from 2025 value of USD 65.25 billion with 2031 projections showing USD 119.57 billion, growing at 10.62% CAGR over 2026-2031. Steady migration from proof-of-concept pilots to enterprise-wide production workloads is accelerating revenue momentum for cloud-native AI services. Capital-expenditure commitments disclosed by leading hyperscalers are keeping compute capacity ahead of near-term demand, while regulatory guidelines that mandate model transparency are pushing late adopters to formalize AI governance. Platform revenues reported by Microsoft and Amazon confirm that hyperscaler AI units have become self-funded profit engines. Horizontal integration is intensifying as vendors pursue end-to-end toolchains that combine model development, orchestration, and domain-specific accelerators, creating fresh cross-sell opportunities across industries.
Key Report Takeaways
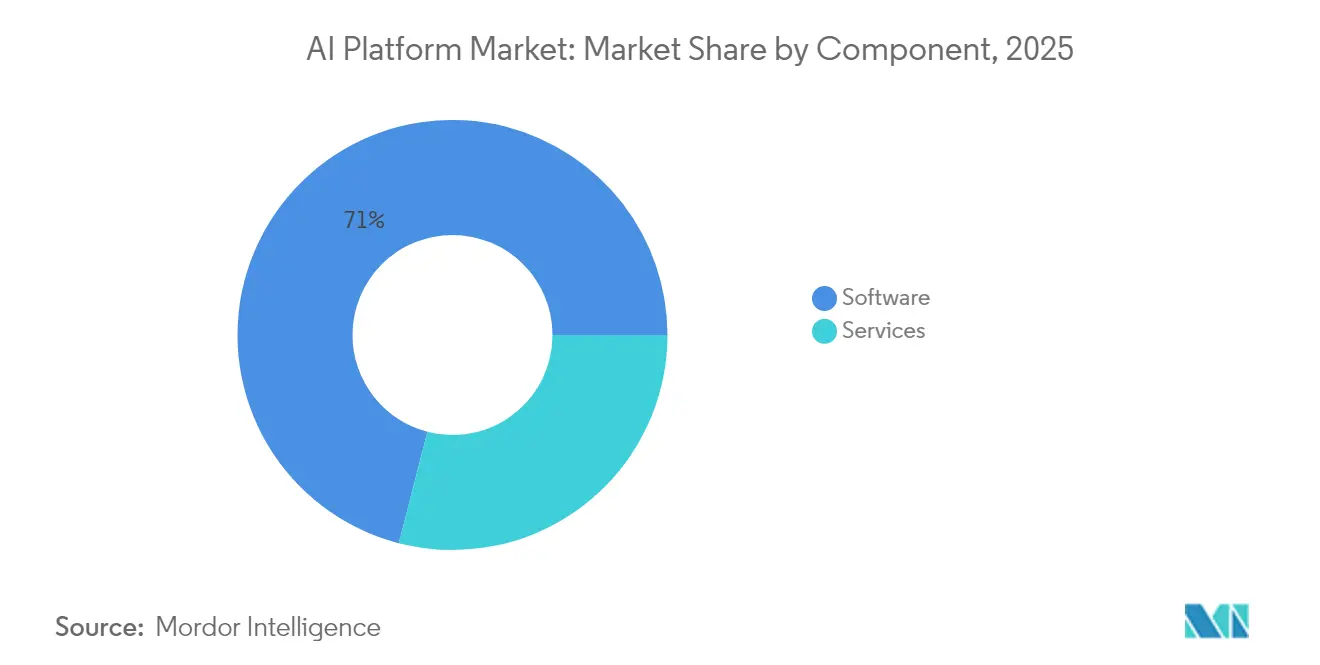
- By component, Software captured 70.98% revenue share of the AI platform market in 2025; Services is projected to record a 14.74% CAGR through 2031.
- By deployment, Cloud deployment held 64.05% of the AI platform market share in 2025, and the same segment is advancing at a 14.88% CAGR to 2031.
- By enterprise size, Large Enterprises accounted for 58.92% of the AI platform market in 2025, while Small and Medium Enterprises are poised for an 17.62% CAGR to 2031.
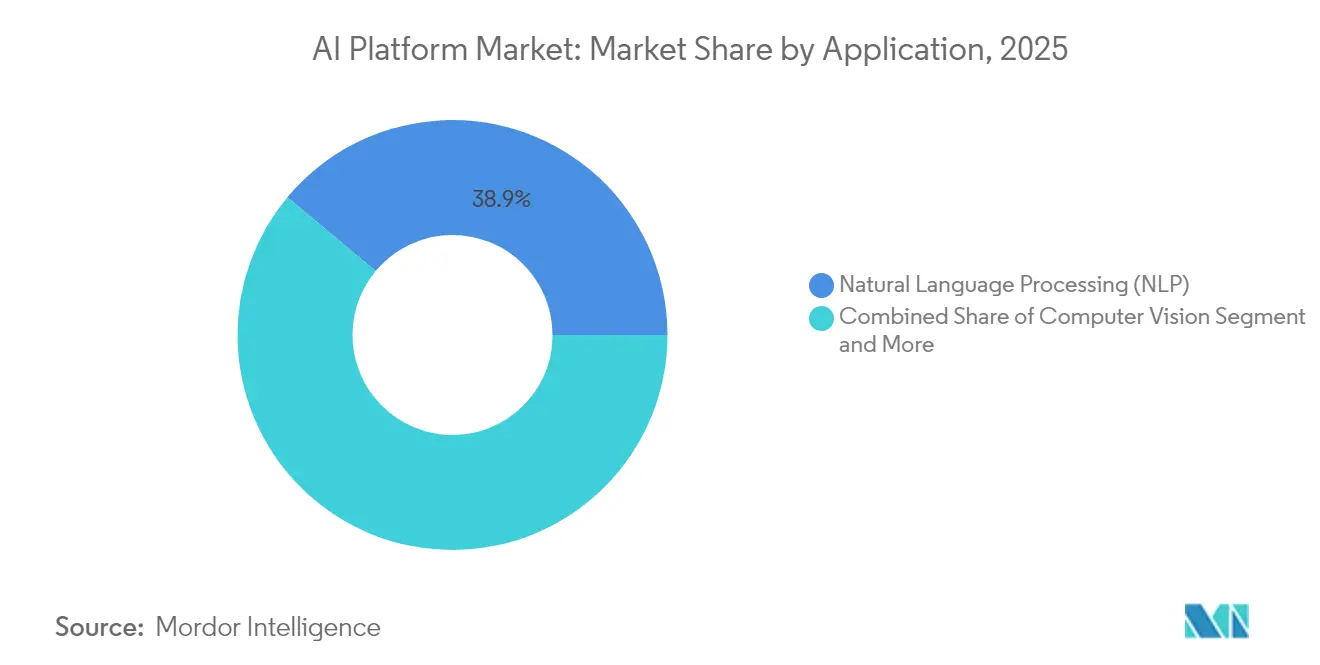
- By application, Natural Language Processing led with 38.94% of the AI platform market size in 2025; Generative AI is projected to grow at a 20.43% CAGR through 2031.
- By end-use industry, IT and Telecom commanded 31.78% of the AI platform market size in 2025, yet Healthcare is forecast to expand at a 16.22% CAGR between 2026-2031.
- By geography, North America retained 39.03% market share in 2025, whereas Asia-Pacific is set to climb at an 17.95% CAGR to 2031.
Note: Market size and forecast figures in this report are generated using Mordor Intelligence’s proprietary estimation framework, updated with the latest available data and insights as of 2026.
Market Trends and Insights
Drivers Impact Analysis of AI Platform Market*
| Driver | (~) % Impact on CAGR Forecast | Geographic Relevance | Impact Timeline |
|---|---|---|---|
| Surging enterprise-wide automation demand | +2.8% | Global, with concentration in North America and EU | Medium term (2-4 years) |
| Cloud hyperscaler incentives and free-tier lock-ins | +2.1% | Global, led by North America, expanding to Asia-Pacific | Short term (≤ 2 years) |
| Shift to private/edge AI for data-sovereignty | +1.7% | EU-driven, spreading to Asia-Pacific and regulated US sectors | Long term (≥ 4 years) |
| OTT battle for Gen-AI developer mindshare | +1.4% | Global, with Silicon Valley and London hubs leading | Medium term (2-4 years) |
| Regulatory push for model auditability | +1.2% | EU-led, with US federal adoption pending | Long term (≥ 4 years) |
| Vertical-specific AI accelerators (health, retail) | +0.9% | North America and EU for healthcare, Global for retail | Medium term (2-4 years) |
| Surging enterprise-wide automation demand | +2.8% | Global, with concentration in North America and EU | Medium term (2-4 years) |
| Source: Mordor Intelligence | |||
Surging Enterprise-Wide Automation Demand
Enterprises are shifting from departmental pilots to organization-wide roll-outs as automation proves its ability to shorten cycle times and improve decision accuracy. Salesforce reported that 91% of small and mid-sized businesses using AI experienced a revenue lift, illustrating how mature toolchains are lowering entry barriers.[1]Salesforce Research, “2025 Small Business Trends,” Salesforce.com Inc., salesforce.com Internal productivity metrics show content creation time falling by more than half when generative agents handle first-draft generation and workflow routing. These use cases confirm that AI platforms are now core digital transformation enablers rather than isolated analytic add-ons. Vendors able to package reusable agents and integration templates are well positioned to monetize cross-functional expansion.
Cloud Hyperscaler Incentives and Free-Tier Lock-ins
Microsoft’s AI revenue run rate exceeded USD 13 billion, while Amazon Web Services booked USD 29.3 billion in Q1 2025 sales, underscoring the advantage of bundling AI services with existing cloud contracts. Generous compute credits and model-hosting allowances entice developers to migrate workloads early; data gravity and proprietary APIs subsequently raise switching costs. This incentive structure both accelerates initial adoption and consolidates long-term tenant stickiness, allowing hyperscalers to recoup subsidies through expanding consumption tiers.
Shift to Private/Edge AI for Data Sovereignty
Roughly 47% of IT decision-makers are now training models inside corporate firewalls to satisfy data-residency mandates.[2]TechTarget Editorial, “Generative AI Adoption Survey,” techtarget.com European institutions reference the EU AI Act as a catalyst for moving sensitive workloads from public clouds to local clusters where access auditing can be tightly controlled. Edge-optimized chips and federated-learning frameworks are enabling manufacturers and healthcare providers to keep raw data onsite while still benefiting from global model updates. Vendors offering orchestrators that can span cloud and edge seamlessly stand to gain as compliance requirements tighten.
OTT Battle for Generative-AI Developer Mindshare
OpenAI’s rapid ascent to a USD 10 billion annualized revenue run rate highlights how a vibrant developer community can propel a single foundation-model provider to hyperscaler-like scale.[3]Cognizant, “Cognizant and Google Cloud Launch Healthcare LLM Solutions,” cognizant.com Competing ecosystems from Anthropic and Databricks are courting coders with framework-agnostic tooling, turnkey retrieval-augmented-generation pipelines, and revenue-sharing storefronts. Early-stage lock-in matters because models fine-tuned on one platform seldom relocate without costly retraining. The contest is intensifying through equity partnerships that bundle compute discounts with SDK exclusivity, amplifying network effects around the largest hubs.
Restraints Impact Analysis of AI Platform Market*
| Restraint | (~) % Impact on CAGR Forecast | Geographic Relevance | Impact Timeline |
|---|---|---|---|
| GPU supply-chain choke | -1.0% | Global, acute in dense data-center corridors | Short term (≤ 2 years) |
| Power-grid bottlenecks | -0.9% | North America and Western Europe | Short term (≤ 2 years) |
| Fragmented open-source licensing and IP risk | -1.1% | Global, with uneven regulatory enforcement | Medium term (2-4 years) |
| Regulatory compliance burden under EU AI Act | -0.8% | EU, spilling into multinational deployments | Medium term (2-4 years) |
| Source: Mordor Intelligence | |||
GPU Supply-Chain Choke and Power-Grid Bottlenecks
NVIDIA controls upward of 70% of the global AI-accelerator market, and recurring chip shortages have lengthened lead times for new clusters. Simultaneously, US data-center electricity demand is projected to reach 9% of the national total by 2030, prompting utilities to ration new connections. These intertwined constraints favor incumbents that secured multiyear volume contracts and renewable-energy offsets, raising the cost of entry for latecomers.
Fragmented Open-Source Licensing and IP Risk
Open-source model proliferation has brought license incompatibilities that complicate commercial deployment. Legal counsel now review lineage documentation to ensure training data and derivative weights conform to corporate usage policies. The EU AI Act’s transparency clause may force vendors to disclose pre-training datasets, intensifying discoverability of potential infringements. Enterprises lacking clear governance frameworks could see projects paused until due-diligence audits are complete, slowing implementation timetables.
*Our forecasts treat driver/restraint impacts as directional, not additive. The impact forecasts reflect baseline growth, mix effects, and variable interactions.
AI Platform Market Segment Analysis
By Component:
Software Consolidation Deepens Platform StickinessSoftware commanded 70.98% of the AI platform market share in 2025, reflecting strong demand for integrated model-development environments that unify data ingestion, orchestration, and monitoring. Services, while smaller, are expected to expand at a 14.74% CAGR as enterprises seek design-and-operate support to shorten ROI cycles. Implementation partners now package vertical templates that can be deployed in weeks, accelerating time-to-value for late adopters.
Service-led growth also signals a maturing ecosystem in which vendors monetize recurring optimization work long after licenses are sold. Providers that combine low-code tooling with certified advisory practices reduce dependence on scarce data-science talent. The AI platform market continues to reward suppliers that couple robust software with outcome-based service bundles, creating blended revenue streams resistant to price erosion.


By Deployment:
Cloud-Native Dominance With Hybrid NuancesCloud configurations accounted for 64.05% of the AI platform market size in 2025 and are forecast to grow the fastest at 14.88% CAGR as hyperscalers deploy purpose-built accelerators and managed retrieval layers. Consumption-based pricing aligns opex with usage volatility, encouraging line-of-business managers to prototype freely before scaling.
On-premise and edge nodes remain essential in healthcare, finance, and public-sector workloads where data-sovereignty rules apply. Hybrid orchestrators that abstract locality allow enterprises to train centrally while inferring at the edge, balancing latency and compliance. Vendors able to route workloads between environments without code rewrites reinforce their strategic value inside multi-cloud procurement roadmaps.
By End-User Enterprise Size:
Accessible Tooling Spurs SME UptakeLarge Enterprises generated 58.92% of 2025 revenue, yet the SME cohort is projected to post an 17.62% CAGR, the fastest within the AI platform market. Feature-rich freemium tiers, step-up elastic pricing, and wizard-based model builders are lowering adoption barriers for resource-constrained firms.
Survey data from Salesforce shows 89% of SMEs intend to deploy AI by 2025, underscoring pent-up demand once usability hurdles diminish. For providers, the segment offers scale through volume; small contracts aggregate into meaningful annuities with minimal account-management overhead. Vendors that package compliance guardrails and click-to-deploy connectors stand out in procurement cycles dominated by non-technical buyers.
By Application:
Generative AI Catalyzes Platform ExpansionNatural Language Processing still represents 38.94% of 2025 revenue, driven by conversational agents and document-intelligence macros embedded across help-desk and back-office workflows. Generative AI, however, is forecast to grow at a 20.43% CAGR, transforming platforms from task-specific engines into broad creative suites.
Cross-domain models capable of synthesizing text, code, and images are redefining feature roadmaps. Platform roadmaps increasingly include prompt-engineering consoles, synthetic-data generators, and RAG pipelines. The AI platform market size for generative toolkits is poised to widen as copyright-safe content libraries unlock marketing, design, and product-development use cases once thought too complex for automation.
By End-Use Industry:
Healthcare Becomes the Growth EngineIT and Telecom retained 31.78% revenue share in 2025, leveraging pre-existing data pipelines to deploy AI for network optimization and subscriber analytics. Healthcare, projected to advance at a 16.22% CAGR, benefits from regulatory clarity on clinical-decision-support tools and the validation of AI for radiology triage.
Hospital groups now budget for conversational triage bots and coding-automation engines as standard line items. Partnerships such as Cognizant’s launch of healthcare large language models on Google Cloud demonstrate the appetite for domain-tuned platforms. Vendors able to marry auditability with clinical efficacy will capture share as payers and providers scale digital front doors.
Geography Analysis
North America AI Platform Market
North America generated 39.03% of 2025 global revenue, buoyed by first-mover enterprises and unrivaled venture funding that anchors platform innovation clusters. Annual disclosures from Microsoft, Amazon, and Google confirm multibillion-dollar AI capital programs that assure customers of long-term capacity. Canada’s talent immigration policies and Mexico’s near-shore data-center corridors complement US leadership, collectively reinforcing regional dominance.
APAC AI Platform Market
Asia-Pacific is the fastest-growing territory at an 17.95% CAGR, propelled by government-sponsored sovereign-AI frameworks and manufacturing digitalization agendas across China, India, Japan, and South Korea. National data-residency laws are fostering a preference for localized deployments, creating openings for vendors that can certify domestic hosting while maintaining global feature parity. Expanding regional colocation footprints and strategic joint ventures between local telecoms and US platform players point to rising demand for bilingual interfaces and cultural fine-tuning.
Southern Europe AI Platform Market
Europe maintains steady expansion as the EU AI Act moves toward final implementation. Compliance timetables are prompting banks and life-sciences firms to invest in audit-grade model registries and explanation layers. Although the act imposes new obligations, it also clarifies expectations, encouraging hesitant adopters to green-light projects previously stalled by regulatory uncertainty. In Southern Europe, recovery-fund grants tied to digital-transformation milestones are channeling budgets toward AI-enhanced public-sector workflows, expanding addressable opportunity even in traditionally conservative segments.

Competitive Landscape
Competitive intensity in the AI platform market is climbing as hyperscalers, enterprise-software incumbents, and venture-backed specialists race to assemble full-stack offerings. Microsoft Azure AI, AWS Bedrock, and Google Vertex AI leverage integrated infrastructure, identity, and billing to shield accounts from displacement. Pure-play leaders such as OpenAI, Anthropic, and Databricks push the frontier on model scale, open-weight releases, and ecosystem extensibility, forcing incumbents to accelerate release cadences.
MandA activity topped USD 50 billion in 2024, with Meta’s USD 15 billion investment in Scale AI and Databricks’ USD 15.25 billion funding round illustrating willingness to pay premium valuations for differentiated assets. Hardware co-design is emerging as a next-stage moat: Google’s TPU v5p and Amazon’s Trainium2 chips promise cost-per-token reductions that lock customers into proprietary runtimes. Meanwhile, IBM’s acquisition of Seek AI and Salesforce’s multimodal agent expansion signal that established vendors will keep supplementing in-house RandD with bolt-on buys to accelerate vertical capabilities.
White-space opportunities persist for regional providers that navigate local compliance intricacies and for domain specialists embedding AI into sector-specific workflows such as clinical diagnostics and industrial automation. Edge-focused orchestrators capable of offline inference and synchronized federated updates also stand to win as data-sovereignty and latency needs converge. The market remains dynamic, with differentiation shifting from raw model accuracy to holistic platform economics, governance toolkits, and developer-experience depth.
AI Platform Industry Leaders
Amazon Web Services Inc.
Google LLC
IBM Corporation
NVIDIA
Microsoft Azure AI
- *Disclaimer: Major Players sorted in no particular order
AI Platform Market Companies Covered in this Report
- Microsoft Corporation
- Amazon Web Services, Inc.
- Google LLC
- IBM Corporation
- Salesforce, Inc.
- Oracle Corporation
- SAP SE
- NVIDIA Corporation
- Intel Corporation
- Baidu, Inc.
- OpenAI, L.P.
- Snowflake Inc.
- Databricks, Inc.
- H2O.ai, Inc.
- DataRobot, Inc.
- Cohere Technologies Inc.
- Anthropic PBC
- C3.ai, Inc.
- Palantir Technologies Inc.
- Huawei Technologies Co., Ltd.
- SAS Institute Inc.
- ServiceNow, Inc.

Recent Industry Developments in AI Platform Market
- May 2025: AWS reported Q1 2025 revenue of USD 29.3 billion and announced USD 105 billion in 2025 capital expenditures, primarily for data-center infrastructure.
- April 2025: IBM disclosed its generative-AI revenue reached USD 6 billion in Q1 2025 and reaffirmed full-year revenue-growth guidance of at least 5% at constant currency.
- March 2025: Adobe introduced Adobe Experience Platform Agent Orchestrator and unveiled a strategic partnership with Microsoft to embed AI agents in Microsoft 365 Copilot.
- February 2025: Anthropic raised an additional USD 2 billion from Amazon, lifting Amazon’s total investment to USD 4 billion and projecting revenue of USD 34.5 billion by 2027.


AI Platform Market Report Scope and Research Methodology
Market Definition and Coverage
Our study defines the AI platform market as the aggregate value of software and managed runtime services that let organizations design, train, deploy, monitor, and update machine-learning, natural-language, computer-vision, and related AI models across cloud, edge, and on-premise environments. The figure captures license and subscription revenues tied to core workbench tools, automated MLOps pipelines, model marketplaces, and integrated governance dashboards.
Scope Exclusion: Chipsets, discrete accelerator hardware, and pure advisory projects remain outside the sizing.
Segments Covered in This Report
- By Component
- Software
- Services (Implementation, Managed)
- By Deployment
- Cloud
- On-premise
- By End-user Enterprise Size
- Large Enterprises
- Small and Medium Enterprises
- By Application
- Natural Language Processing (NLP)
- Computer Vision
- Predictive Analysis
- Robotic Process Automation (RPA)
- Recommendation Systems
- By End-Use Industry
- BFSI
- Healthcare and Life Sciences
- Retail and E-commerce
- Manufacturing
- IT and Telecom
- Automotive
- Government and Public Sector
- Energy and Utilities
- Other Industries
- By Geography
- North America
- United States
- Canada
- Mexico
- South America
- Brazil
- Argentina
- Rest of South America
- Europe
- United Kingdom
- Germany
- France
- Italy
- Spain
- Russia
- Rest of Europe
- Asia-Pacific
- China
- India
- Japan
- South Korea
- Australia and New Zealand
- Southeast Asia
- Rest of Asia-Pacific
- Middle East and Africa
- Middle East
- Saudi Arabia
- United Arab Emirates
- Turkey
- Rest of Middle East
- Africa
- South Africa
- Nigeria
- Kenya
- Rest of Africa
- Middle East
- North America
Data Sources, Market Sizing, and Validation
Primary Research
Mordor analysts interviewed product heads at platform vendors, cloud architects in Fortune 500 firms, and AI practice leaders at regional system integrators across North America, Europe, and Asia-Pacific. These discussions validated adoption rates, clarified typical contract values, and revealed regional preference shifts that desk research alone could not surface.
Desk Research
We began with public datasets that anchor supply, demand, and pricing. Statistical portals such as the US Census ICT survey, Eurostat Digital Economy database, and Japan's METI ICT indices quantify enterprise software outlays, while UN Comtrade import codes trace cross-border software royalties. Analyst teams mined policy briefs from OECD AI Observatory, peer-reviewed work in the IEEE Digital Library, and patents retrieved through Questel to map emerging platform capabilities. Company 10-Ks, investor decks, and major cloud provider usage disclosures enriched revenue benchmarks. D&B Hoovers, Dow Jones Factiva, and other paid repositories supplied granular firm-level splits. The sources listed illustrate our evidence base and are not exhaustive.
Market-Sizing & Forecasting
We apply a top-down and bottom-up blend. Global enterprise software spending is first apportioned by AI workload penetration and average platform spend per user group, which are then verified against sampled supplier invoices and channel checks. Key model inputs include cloud infrastructure spending, GPU server shipments, active AI developer headcount, average subscription price tiers, regulation-driven compliance demand, and churn ratios. Multivariate regression links these variables to historic platform revenues before forward projections, while scenario analysis stresses currency swings and policy shocks. Data gaps in bottom-up rolls are bridged with moderated expert consensus.
Data Validation & Update Cycle
Outputs pass variance screens against independent metrics, and anomalies trigger re-contact with sources. Senior analysts review every calculation step, after which the model is locked for publication. Updates occur annually, with interim refreshes when sizable fund-raising, regulatory, or macro shocks emerge; a final sense-check precedes client delivery.
How Mordor Intelligence's AI Platform Market Size Compares to Other Published Estimates
Published estimates often differ because research houses pick varied service scopes, price trackers, and refresh cadences.
Key gap drivers include narrower functional coverage, counting only no-code tools or only cloud PaaS, reliance on unverified vendor claims, and less frequent model updates.
Benchmark comparison
| Market Size | Anonymized source | Primary gap driver |
|---|---|---|
| USD 65.25 B (2025) | Mordor Intelligence | |
| USD 18.22 B (2025) | Global Consultancy A | Excludes deployment management and governance modules, leading to understated totals |
| USD 14.21 B (2024) | Trade Journal B | Tracks only no-code platforms, omitting developer-centric suites |
| USD 60.35 B (2023) | Industry Association C | Counts cloud PaaS revenues yet ignores on-prem and hybrid subscriptions |
The comparison shows that once consistent scope, pricing, and update rhythm are applied, Mordor's balanced approach yields a dependable baseline that decision-makers can trace back to transparent variables and repeatable steps.


Key Questions Answered in the Report
What is the current size of the AI platform market?
The AI platform market is valued at USD 72.18 billion in 2026 and is forecast to reach USD 119.57 billion by 2031 at a 10.62% CAGR.
Which component leads the AI platform market and why?
Software leads with 70.98% revenue share because enterprises favor integrated development environments that bundle data, model, and orchestration capabilities.
How fast is the cloud deployment segment growing?
Cloud deployments hold 64.05% market share and are expanding at a 14.88% CAGR as hyperscalers add AI-optimized hardware and incentive credits.
Why is healthcare the fastest-growing vertical?
Regulatory clarity and validated clinical use cases such as radiology triage and medical-coding automation are driving a 16.22% CAGR for healthcare.
Page last updated on:


