Smart Stadium Market Size and Share
Market Overview
| Study Period | 2020 - 2031 |
|---|---|
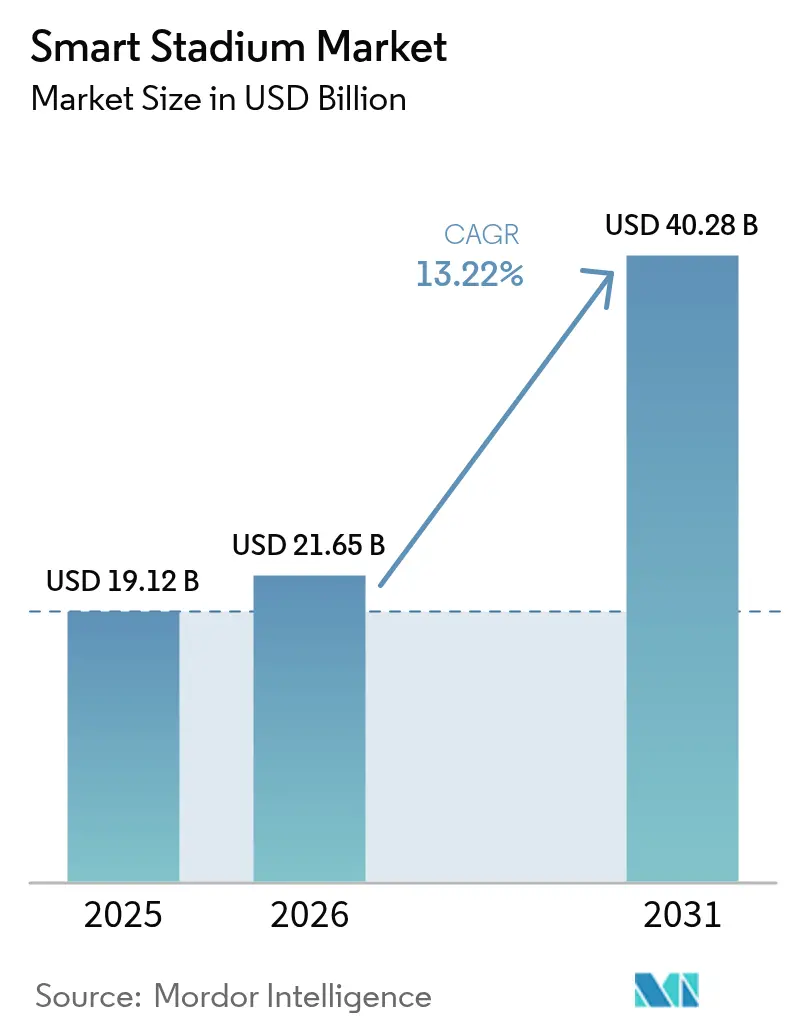
| Market Size (2026) | USD 21.65 Billion |
| Market Size (2031) | USD 40.28 Billion |
| Growth Rate (2026 - 2031) | 13.22% CAGR |
| Fastest Growing Market | Middle East |
| Largest Market | North America |
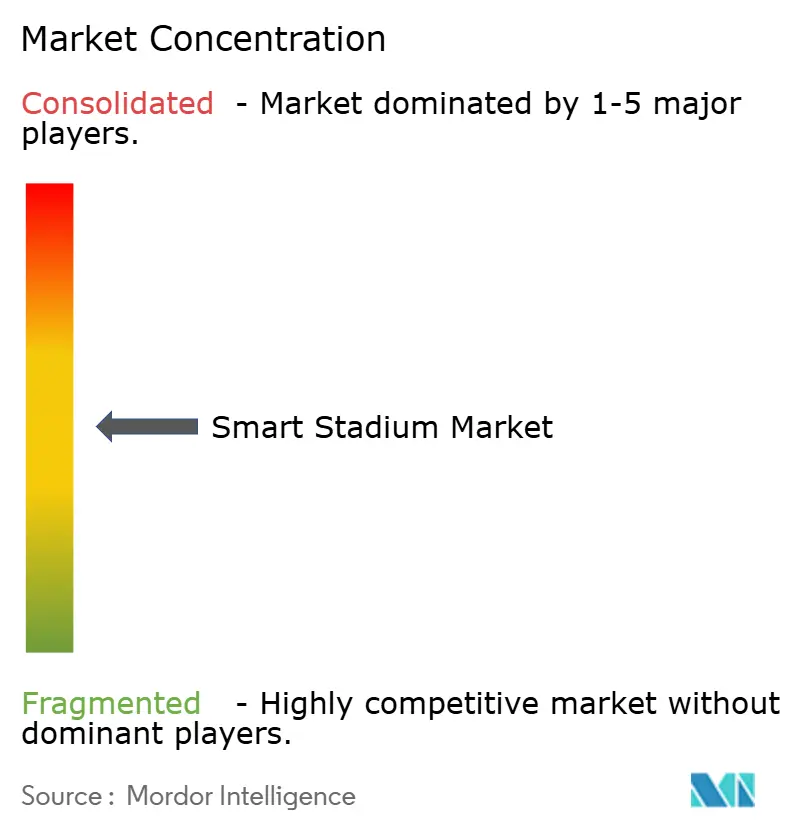
| Market Concentration | Medium |
Major Players
*Disclaimer: Major Players sorted in no particular order Image © Mordor Intelligence. Reuse requires attribution under CC BY 4.0. |
|
Smart Stadium Market Analysis by Mordor Intelligence
Smart stadium market size in 2026 is estimated at USD 21.65 billion, growing from 2025 value of USD 19.12 billion with 2031 projections showing USD 40.28 billion, growing at 13.22% CAGR over 2026-2031. Venue owners see the network as a profit engine rather than a cost center, driving investment in private 5G cores, edge-compute nodes, and cloud analytics that unlock real-time betting, dynamic sponsorship assets, and data-driven crowd services. Mega-events such as the 2026 FIFA World Cup and the 2028 Los Angeles Olympics are compressing upgrade cycles into 24-month windows, while European zero-trust mandates are raising integration standards and creating defensible positions for certified platforms. U.S. legalization of mobile wagering is generating new licensing revenues, and Asia’s smart-city grants are subsidizing IoT roll-outs across tier-2 venues. Competitive intensity is rising as full-stack vendors integrate radio, edge, and software bundles, forcing smaller specialists to focus on niche layers like AI video analytics and distributed antenna systems.
Key Report Takeaways
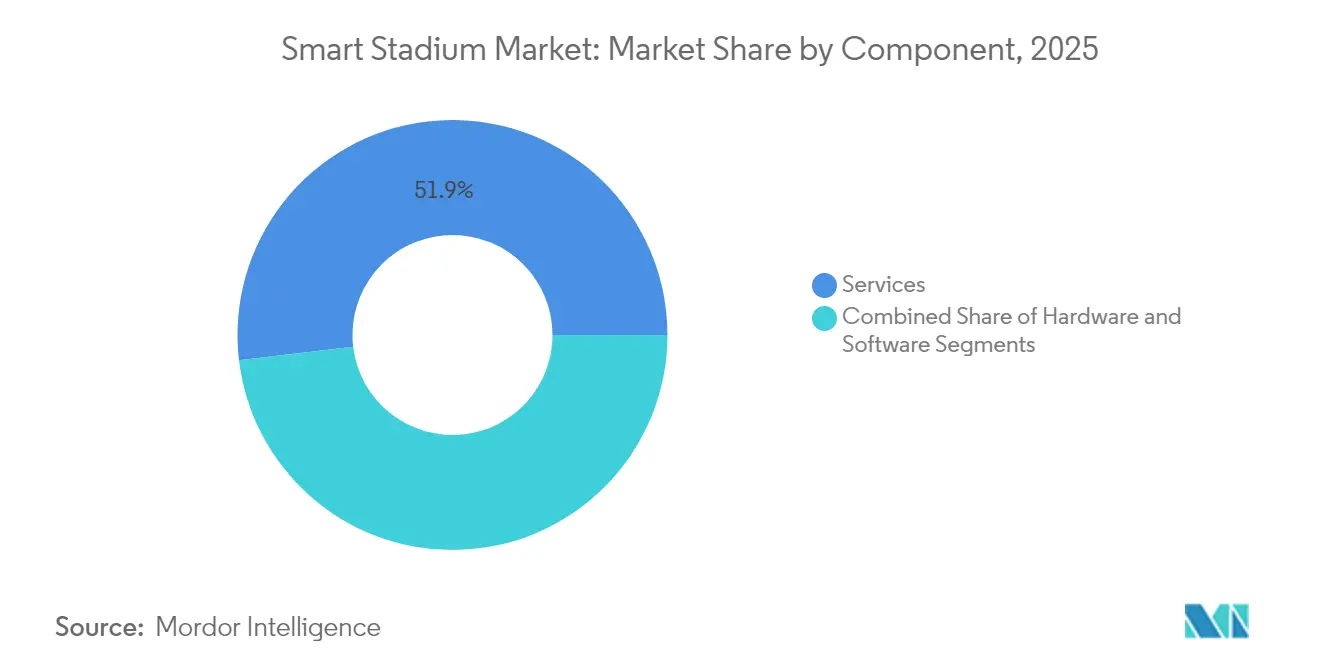
- By component, Services led with 51.88% revenue share in 2025, while Software is projected to expand at a 15.02% CAGR through 2031.
- By software solution, Digital Content and Fan Engagement commanded 28.10% of revenue in 2025; Smart Ticketing and Parking is forecast to grow at a 13.95% CAGR to 2031.
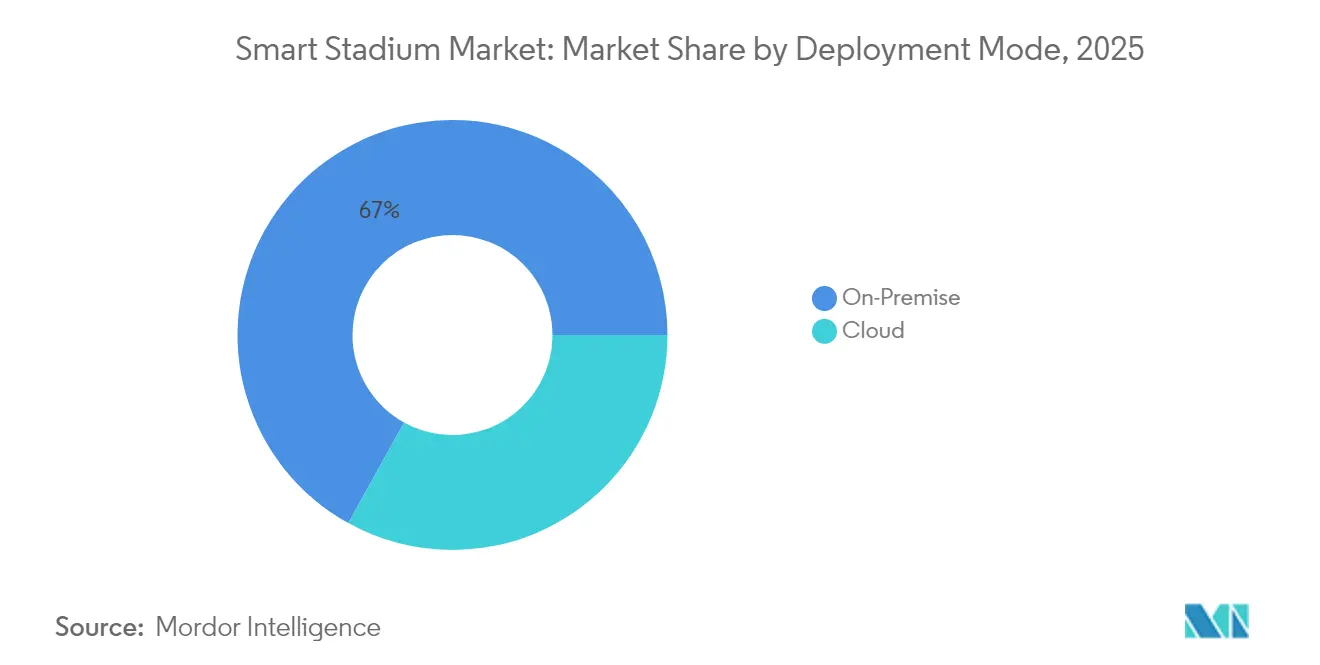
- By deployment mode, On-Premise installations held 66.95% in 2025, whereas Cloud is expected to accelerate at a 14.72% CAGR through 2031.
- By connectivity technology, Wi-Fi 6/7 captured 44.05% in 2025, and 5G and Private LTE is advancing at a 14.05% CAGR to 2031.
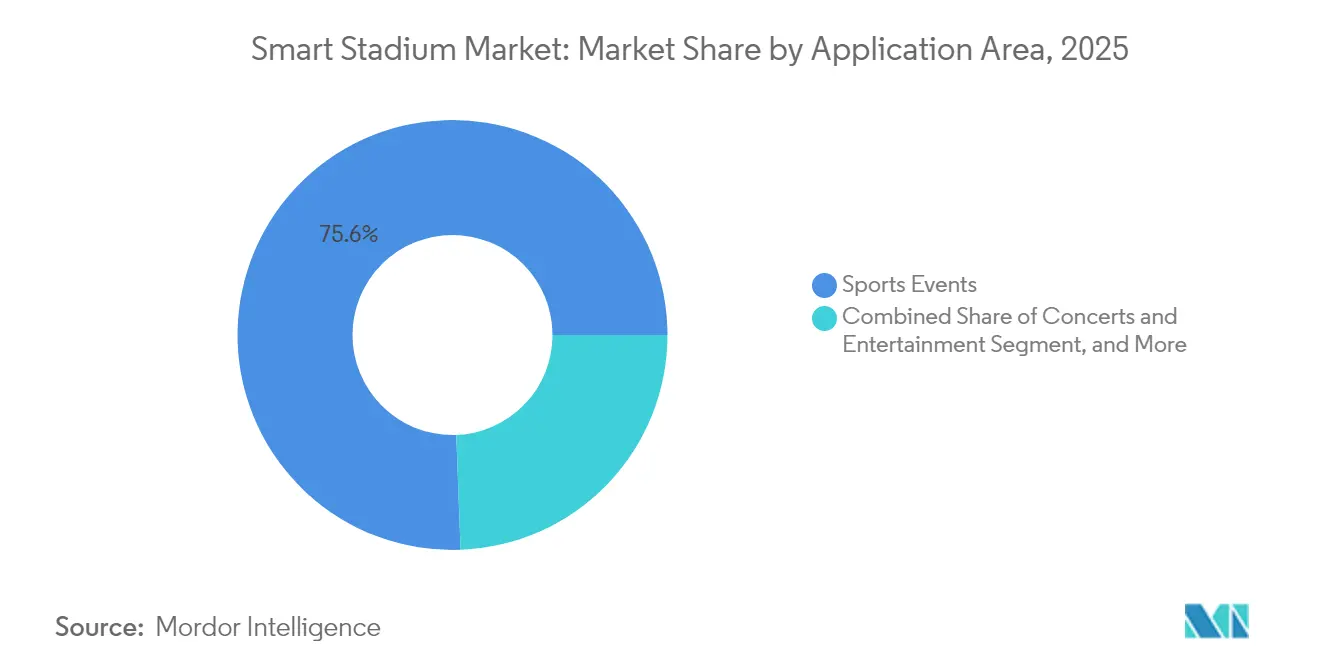
- By application, Sports Events accounted for 75.60% of 2025 revenue and Esports Tournaments are poised for a 13.40% CAGR through 2031.
- By revenue stream, Ticketing and Merchandise held 35.30% in 2025, while Data Monetization and Betting is projected to rise at a 14.25% CAGR to 2031.
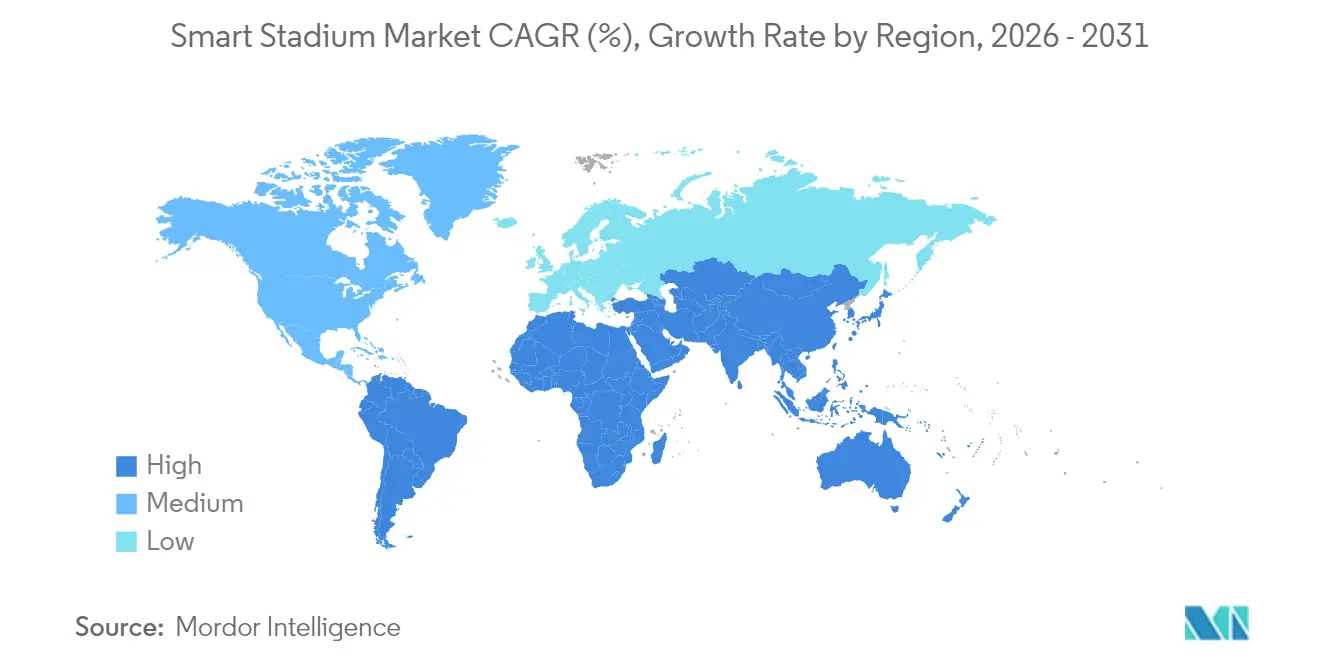
- By geography, North America led with 37.10% share in 2025; the Middle East is expected to log the fastest regional growth at 14.45% CAGR through 2031.
Note: Market size and forecast figures in this report are generated using Mordor Intelligence’s proprietary estimation framework, updated with the latest available data and insights as of 2026.
Global Smart Stadium Market Trends and Insights
Drivers Impact Analysis*
| Driver | (~) % Impact on CAGR Forecast | Geographic Relevance | Impact Timeline |
|---|---|---|---|
| 5G network roll-outs catalyzing high-density connectivity | +2.8% | North America and Europe, early APAC metros | Medium term (2-4 years) |
| Mega-event pipeline (2026 FIFA World Cup, 2028 LA Olympics) accelerating digitization budgets | +3.1% | United States, Mexico, Canada | Short term (≤ 2 years) |
| EU crowd-safety mandates (NIS2 and Cyber Resilience Act) requiring real-time analytics | +1.9% | European Union, UK, Switzerland | Medium term (2-4 years) |
| In-venue sports betting and data licensing opening new revenue streams | +2.4% | United States, expanding to Canada and LATAM | Medium term (2-4 years) |
| Smart-city grants in APAC (e.g., India’s Khelo India 2.0) funding stadium IoT upgrades | +1.7% | India, China, Southeast Asia | Long term (≥ 4 years) |
| Green-Deal targets driving energy-efficient building automation in EU arenas | +1.5% | European Union and candidate countries | Long term (≥ 4 years) |
| Source: Mordor Intelligence | |||
5G Network Roll-outs Catalyzing High-Density Connectivity
Carrier investment in millimeter-wave and C-band spectrum is enabling stadiums to serve tens of thousands of concurrent users at multi-gigabit speeds, a feat that legacy distributed-antenna systems could not economically achieve. Verizon completed 5G Ultra Wideband builds across 28 NFL venues in 2024, supporting augmented-reality replays and in-seat betting that demand sub-20-millisecond latency.[1]Verizon Communications, “5G Ultra Wideband Deployment Across NFL Stadiums,” verizon.com Notre Dame Stadium’s 2024 Wi-Fi 6E overlay achieved an aggregate of 26 Gbps during a single game and is being paired with a private LTE core for deterministic IoT telemetry. European operators such as Vodafone and Deutsche Telekom are positioning stadium densification as anchor tenants for standalone 5G cores that also showcase slicing to municipal buyers. Dedicated small-cell grids reduce interference during peak ingress when device density exceeds 1,500 connections per access point. The resulting bandwidth is underpinning next-generation services that raise per-capita spending and sponsorship yield.
Mega-Event Pipeline Accelerating Digitization Budgets
The 2026 FIFA World Cup and 2028 Los Angeles Olympics are compressing decade-long refresh cycles into two-year sprints. Lenovo’s 2024 global deal with FIFA supplies edge servers and AI appliances to 16 venues across the United States, Mexico, and Canada. Mexico’s Estadio Azteca began a USD 150 million renovation in 2024, installing fiber-to-the-seat connectivity for 4K on-demand video. The LA28 organizing committee is utilizing Autodesk BIM workflows to integrate predictive maintenance that will continue beyond the games. These flagship builds create a demonstration effect that pushes secondary markets to upgrade to Olympic-grade standards, expanding the smart stadium market well beyond host cities.
EU Crowd-Safety Mandates Requiring Real-time Analytics
The Network and Information Security Directive 2, adopted in 2024, classifies large venues as essential entities and obliges them to deploy real-time anomaly detection for systems serving more than 10,000 attendees. The 2024 Cyber Resilience Act extends liability to hardware and software vendors, incentivizing operators to source integrated, certified platforms.[2]European Parliament, “Network and Information Security Directive 2,” europarl.europa.eu UEFA’s 2024 safety code now requires AI crowd-density analytics for Category 4 stadiums. As a result, clubs are consolidating supplier lists, favoring solutions from Cisco, Schneider Electric, and Siemens that arrive pre-certified and reduce audit scope. Compliance increases upfront costs but builds long-term barriers to entry, solidifying the incumbent's advantage within the smart stadium market.
In-Venue Sports Betting and Data Licensing Opening New Revenue Streams
U.S. legalization of mobile wagering is turning stadiums into real-time data generators. Sportradar’s live-odds engine processed more than 1.2 million betting events per day during the 2024 NFL season, aided by venue geofencing that enables enhanced odds offers for on-site fans. Genius Sports holds exclusive rights to distribute NFL player-tracking statistics through 2030, and venues typically earn multi-million-dollar annual fees for granting access to their data. Betting kiosks and mobile top-ups extend concession dwell time, boosting secondary spend on food and merchandise. The incremental revenue offsets sensor and edge-compute capital costs, making the economics of the smart stadium market more attractive to private operators.
Restraints Impact Analysis*
| Restraint | (~) % Impact on CAGR Forecast | Geographic Relevance | Impact Timeline |
|---|---|---|---|
| Legacy system fragmentation elevating retrofit integration costs | -1.6% | Europe, venues built < 2010 | Medium term (2-4 years) |
| Rising cyber-liability under GDPR and CCPA slowing fan-data platforms | -1.3% | European Union and California | Medium term (2-4 years) |
| Prolonged municipal lease approvals delaying capital deployment | -1.2% | South America | Medium term (2-4 years) |
| Under-utilization rates below 40 event-days compressing ROI | -1.0% | Middle East private venues | Long term (≥ 4 years) |
| Source: Mordor Intelligence | |||
Legacy System Fragmentation Elevating Retrofit Costs
European arenas built between 1990 and 2010 often run proprietary HVAC, access control, and surveillance platforms on disparate protocols such as BACnet, Modbus, and ONVIF. Converging these silos demands custom middleware and lengthy on-site commissioning, which can double the per-seat cost of a greenfield build. A 2024 Stadium Business Summit survey found that 63% of operators identified integration complexity as their top barrier to adoption, with retrofit timelines reaching 18 months for large venues. Operators must sometimes maintain parallel systems during migration, eroding ROI. Although the EU’s Energy Performance of Buildings Directive accelerates decommissioning of obsolete equipment, capital constraints and municipal lease restrictions slow wholesale replacement, weighing on smart stadium market growth.
Rising Cyber-Liability Under GDPR and CCPA
The GDPR allows fines of up to 4% of a company's global turnover for personal-data breaches, and the California Consumer Privacy Act extends deletion rights to biometric and location records. A 2024 Irish regulator ruling fined a football club EUR 2.8 million (USD 3.28 million) for inadequate mobile app consent, prompting peer venues to pause fan engagement pilots. Compliance now requires data-protection impact assessments, encryption at rest, and appointed data-protection officers, adding 15-25% to platform operating costs. California’s 2024 enforcement of geolocation rules further complicates wayfinding and crowd analytics deployments. These liabilities prompt operators to adopt anonymized edge processing, which limits cloud egress; however, the added complexity can slow rollouts and temper near-term smart stadium market expansion.
*Our forecasts treat driver/restraint impacts as directional, not additive. The impact forecasts reflect baseline growth, mix effects, and variable interactions.
Segment Analysis
By Component: Software Momentum Builds on Service Foundations
Services anchored 51.88% of 2025 revenue as system integrators mapped legacy electrical, mechanical, and IT assets into a single IoT fabric. Software, however, is forecast to grow at a 15.02% CAGR, making it the fastest driver of smart stadium market growth. Operators prefer subscription licenses for building-automation and crowd-analytics modules that avoid forklift upgrades. Cisco’s 2024 Private 5G bundle illustrates the shift, combining radios, core software, and professional services into a single SKU. As commodity x86 servers replace proprietary appliances, venues cut the total cost of ownership and accelerate feature roll-outs. The smart stadium industry is increasingly treating software as the principal lever for new revenue streams, with hardware refreshes timed to coincide with carrier 5G roadmaps and Wi-Fi generational shifts.
Hardware occupies an essential middle ground. Edge gateways, access points, and sensor arrays must still meet broadcast-quality latency thresholds, particularly for real-time betting integrations. Replacement cycles align with the adoption of Wi-Fi 7 and the introduction of 6 GHz spectrum in major markets. Vendors that bundle firmware updates and AI inference capabilities into existing devices are best positioned to capture replacement demand. The evolving component mix underscores how the smart stadium market is migrating from capital-intensive builds toward recurring-revenue service models.


By Software Solution: Engagement Leads, Ticketing Accelerates
Digital Content and Fan Engagement software accounted for 28.10% of 2025 solution revenue, reflecting demand for mobile apps, in-seat ordering, and augmented-reality overlays that increase per-capita spending. Smart Ticketing and Parking, projected to post a 13.95% CAGR, is emerging as the breakout. Liverpool FC’s NFC roll-out cut average ingress times from 12 to 7 minutes and produced timestamped mobility data for advertisers. SKIDATA’s 2024 cloud parking solution, already live in Germany and Austria, integrates with city traffic systems to enable dynamic pricing.
Building Automation and Energy Management are converging around sustainability mandates; Schneider Electric’s EcoStruxure platform claims 20-30% energy savings, a compelling metric for EU operators facing near-zero-energy targets. Security software remains compliance-driven as UEFA and FIFA push AI crowd analytics into venue licensure. Across categories, modular, cloud-native design is expanding the addressable market for smart stadiums.
By Deployment Mode: Hybrid Architectures Dominate Roadmaps
On-Premise infrastructure represented 66.95% of installations in 2025, still critical where data sovereignty and sub-10-millisecond latency are non-negotiable. Yet, cloud deployments are forecast to expand at a 14.72% CAGR, as Amazon Web Services, Microsoft Azure, and Google Cloud offer hybrid blueprints that keep sensitive data on-site while scaling analytics in the cloud.
Riot Games’ “Project Stryker” demonstrates a model where on-premise SMPTE 2110 workflows feed AWS global production centers, delivering esports events with sub-5-millisecond switching. Europe’s 2024 Data Act, mandating IoT data portability, is further reducing lock-in fears. The emerging default is a split stack where deterministic applications live at the edge, and elastic workloads burst to the cloud, expanding the smart stadium market size without compromising compliance.
By Connectivity Technology: Wi-Fi Holds Core, 5G Gains Pace
Wi-Fi 6/7 secured 44.05% of 2025 deployments, leveraging incumbent access-point footprints and IEEE 802.11be’s deterministic latency. 5G and Private LTE, scaling at 14.05% CAGR, supply licensed-spectrum reliability for safety-critical functions like automated alerts and dynamic wayfinding.
JMA Wireless shipped distributed antenna systems to 15 NFL stadiums in 2024, supporting carrier aggregation and mmWave backhaul. Bluetooth Low Energy beacons add inexpensive proximity marketing, operating for up to five years on coin-cell batteries. Fiber backbones and containerized edge servers anchor all wireless layers, creating a converged fabric where Wi-Fi 7’s multi-link operation and 5G network slicing dynamically allocate bandwidth by application priority. The interplay of licensed and unlicensed spectrum is a defining feature of the smart stadium market.
By Application Area: Sports Events Prevail, Esports Climbs
Sports Events dominated with 75.60% of 2025 revenue, thanks to professional leagues and college athletics that mandate high reliability and monetize premium seating. Esports arenas, however, are slated for a 13.40% CAGR through 2031 as gaming audiences demand sub-5-millisecond latency and SMPTE 2110 video workflows. Riot Games built its own broadcast-class network stack to meet these requirements, then monetized the IP by licensing it to third-party venues.
Concerts and entertainment bookings generate high per-event revenue but face routing and rigging constraints that limit the number of available dates. Corporate events fill off-season calendars yet yield lower per-capita spend. Hybrid formats, which combine on-site and virtual attendance, are further expanding the smart stadium market by monetizing the same content twice, once at the gate and again on the stream.
By Revenue Stream: Traditional Anchors Meet Data Upside
Ticketing and Merchandise produced 35.30% of 2025 venue revenue and remains the economic anchor. Data Monetization and Betting, however, is projected to grow at 14.25% CAGR as operators license play-by-play feeds and biometric telemetry to sportsbook and media partners. Sportradar’s rights portfolio surpassed 750,000 events in 2024, underscoring the significant demand for real-time data.
Concessions benefit from mobile ordering, which lifts the average spend by 15-20%. Dynamic digital signage shifts advertising from static boards to per-impression pricing informed by real-time demographics. Unified digital wallets that integrate ticketing, concessions, and betting into a single account simplify settlement and open up cross-sell opportunities, deepening the revenue well for the smart stadium market.
Geography Analysis
North America led the smart stadium market with 37.10% share in 2025, lifted by mature betting regulations and aggressive 5G densification. Verizon’s dedicated small-cell grids and edge-compute nodes across 28 NFL venues enable augmented-reality replays and real-time wagering. Canada and Mexico are renovating ahead of the 2026 World Cup, with Estadio Azteca’s USD 150 million fiber-to-seat upgrade setting a regional benchmark. California’s privacy rules, however, compel venues to anonymize location data at the edge, which slows biometric rollouts.
The Middle East is projected to post the fastest regional CAGR at 14.45% thanks to sovereign-funded mega-venues aligned with Vision 2030. Riyadh’s King Salman Stadium is targeting net-zero energy through integrated solar arrays and AI crowd analytics, while Dubai Arena operates cashless concessions and dynamic parking. Underutilization below 40 event days per year threatens ROI, yet government backstops are mitigating refinancing risk to ensure showcase projects land on time, a dynamic that broadens the smart stadium market reach.
The Asia Pacific and Europe follow diverse adoption curves, shaped by public funding programs and regulations. India’s Khelo India 2.0 earmarked INR 30 billion (USD 360 million) in 2024-2025 for IoT upgrades in tier-2 stadiums. China’s 14th Five-Year Plan bundles stadium IoT into municipal bond packages, accelerating deployment in Guangdong and Zhejiang. Europe’s zero-trust and energy directives lift baseline costs but protect incumbents that can certify supply-chain security. Japan and South Korea leverage 5G penetration for cashless payments and AR fan experiences, yet seismic-code retrofits raise capital needs. Across regions, policy drivers and mega-event timetables dictate timing, but the underlying demand for connected fan experiences keeps the smart stadium market on a steady growth path.

Competitive Landscape
The smart stadium market is moderately fragmented. Global integrators such as Cisco, IBM, Huawei, and Johnson Controls compete on turnkey portfolios that bundle radio, edge computing, and analytics, locking in contracts for five to seven years. Cisco’s 2025 Private 5G update folds video-analytics edge appliances into a single SKU, halving deployment timelines for mid-sized venues. Hyperscalers partner with rights holders Riot Games’ Project Stryker funnels live esports feeds through AWS to secure high-margin workloads and deepen integration with venue data stacks.
Niche players thrive by filling gaps the giants overlook. JMA Wireless focuses on distributed antenna systems that aggregate carrier spectrum, while AllGoVision delivers AI-powered crowd analytics tuned for safety compliance. SKIDATA specializes in cloud-based ticketing and parking solutions that integrate with city traffic management platforms. Participation in IEEE 802.11be and SMPTE IP-video task forces signals the credibility of a long-term roadmap, an attribute operators weigh as they invest capital in twenty-year assets.
Regulation is quietly reshaping competitive dynamics. The EU Cyber Resilience Act’s CE-mark requirement is pushing uncertified devices out of tender lists and consolidating share among suppliers with audited supply chains.[4] European Commission, “Cyber Resilience Act,” digital-strategy.ec.europa.eu Vendors boasting end-to-end portfolios are better positioned to shoulder liability and deliver single-throat-to-choke assurances. Meanwhile, white-space opportunities persist in 10,000- to 30,000-seat venues that cannot afford bespoke builds, creating demand for managed-service models and keeping the door open for agile disruptors within the smart stadium market.
Smart Stadium Industry Leaders
-
Cisco Systems Inc.
-
IBM Corporation
-
Huawei Technologies Co. Ltd.
-
Johnson Controls International plc
-
Intel Corporation
- *Disclaimer: Major Players sorted in no particular order

Recent Industry Developments
- January 2025: Cisco expanded its Private 5G platform with edge-compute appliances pre-integrated with video analytics software, targeting crowd density monitoring and automated alerts.
- November 2024: Riot Games and Cisco launched Project Stryker, combining on-premise SMPTE 2110 workflows with AWS remote production for sub-5-millisecond esports broadcasts.
- October 2025: Lenovo signed a global partnership with FIFA to supply edge servers and AI hardware to 16 World Cup venues across North America.
- September 2024: Verizon finished 5G Ultra Wideband roll-outs in 28 NFL stadiums, delivering sub-20-millisecond latency for AR replays and wagering.


Global Smart Stadium Market Report Scope
The Smart Stadium Market refers to the ecosystem of connected and technology-enabled stadiums that leverage advanced hardware, software solutions, and network infrastructure to enhance operational efficiency, fan engagement, and revenue generation. It integrates components such as building automation, crowd management, digital content platforms, and energy management systems, alongside deployment modes like on-premise and cloud. Connectivity technologies, including Wi-Fi 6/7, 5G, and edge computing, enable real-time data analytics, high-density connectivity, and interactive experiences for spectators. The market serves multiple applications, including sports events, concerts, esports, and corporate events, with revenue streams spanning ticketing, concessions, advertising, venue rentals, and data monetization.
The Smart Stadium Market Report is Segmented by Component (Hardware, Software, Services), Software Solution (Building Automation Management, Stadium and Public Security, Event and Crowd Management, Digital Content and Fan Engagement, Network Management, Energy Management, Smart Ticketing and Parking), Deployment Mode (On-Premise, Cloud), Connectivity Technology (Wi-Fi 6/7, 5G and Private LTE, Distributed Antenna Systems, Bluetooth Low Energy/BLE Beacons, Fiber and Edge Compute Infrastructure), Application Area (Sports Events, Concerts and Entertainment, Esports Tournaments, Corporate and Other Events), Revenue Stream (Ticketing and Merchandise, Concessions and Hospitality, Advertising and Sponsorship, Venue Rental and Non-Sport Events, Data Monetization and Betting), and Geography (North America, South America, Asia Pacific, Europe, Middle East, Africa). The Market Forecasts are Provided in Terms of Value (USD).
| Hardware |
| Software |
| Services |
| Building Automation Management |
| Stadium and Public Security |
| Event and Crowd Management |
| Digital Content and Fan Engagement |
| Network Management |
| Energy Management |
| Smart Ticketing and Parking |
| On-Premise |
| Cloud |
| Wi-Fi 6/7 |
| 5G and Private LTE |
| Distributed Antenna Systems (DAS) |
| Bluetooth Low Energy / BLE Beacons |
| Fiber and Edge Compute Infrastructure |
| Sports Events |
| Concerts and Entertainment |
| Esports Tournaments |
| Corporate and Other Events |
| Ticketing and Merchandise |
| Concessions and Hospitality |
| Advertising and Sponsorship |
| Venue Rental and Non-Sport Events |
| Data Monetization and Betting |
| North America | United States |
| Canada | |
| Mexico | |
| South America | Brazil |
| Argentina | |
| Rest of South America | |
| Asia Pacific | China |
| India | |
| Japan | |
| South Korea | |
| Rest of Asia Pacific | |
| Europe | Germany |
| United Kingdom | |
| France | |
| Italy | |
| Spain | |
| Rest of Europe | |
| Middle East | Saudi Arabia |
| United Arab Emirates | |
| Rest of Middle East | |
| Africa | South Africa |
| Egypt | |
| Rest of Africa |
| By Component | Hardware | |
| Software | ||
| Services | ||
| By Software Solution | Building Automation Management | |
| Stadium and Public Security | ||
| Event and Crowd Management | ||
| Digital Content and Fan Engagement | ||
| Network Management | ||
| Energy Management | ||
| Smart Ticketing and Parking | ||
| By Deployment Mode | On-Premise | |
| Cloud | ||
| By Connectivity Technology | Wi-Fi 6/7 | |
| 5G and Private LTE | ||
| Distributed Antenna Systems (DAS) | ||
| Bluetooth Low Energy / BLE Beacons | ||
| Fiber and Edge Compute Infrastructure | ||
| By Application Area | Sports Events | |
| Concerts and Entertainment | ||
| Esports Tournaments | ||
| Corporate and Other Events | ||
| By Revenue Stream | Ticketing and Merchandise | |
| Concessions and Hospitality | ||
| Advertising and Sponsorship | ||
| Venue Rental and Non-Sport Events | ||
| Data Monetization and Betting | ||
| By Geography | North America | United States |
| Canada | ||
| Mexico | ||
| South America | Brazil | |
| Argentina | ||
| Rest of South America | ||
| Asia Pacific | China | |
| India | ||
| Japan | ||
| South Korea | ||
| Rest of Asia Pacific | ||
| Europe | Germany | |
| United Kingdom | ||
| France | ||
| Italy | ||
| Spain | ||
| Rest of Europe | ||
| Middle East | Saudi Arabia | |
| United Arab Emirates | ||
| Rest of Middle East | ||
| Africa | South Africa | |
| Egypt | ||
| Rest of Africa | ||


Key Questions Answered in the Report
How large is the smart stadium market in 2026?
The smart stadium market size reached USD 21.65 billion in 2026 and is projected to climb to USD 40.28 billion by 2031.
What CAGR is anticipated for smart stadium investments through 2031?
Aggregate spending is forecast to rise at a 13.22% CAGR over the 2026-2031 period.
Which region leads adoption of connected-venue technology?
North America held 37.10% share in 2025, supported by 5G densification and sports-betting legislation.
What is the fastest growing revenue stream inside connected venues?
Data monetization and betting is projected to expand at a 14.25% CAGR as leagues license real-time feeds to sportsbook and media partners.
Which connectivity technologies dominate new stadium builds?
Wi-Fi 6/7 remains the primary access layer but private 5G is advancing quickly, especially for latency-sensitive and mission-critical applications.
How are mega-events influencing upgrade cycles?
The 2026 FIFA World Cup and 2028 Los Angeles Olympics are compressing refresh timelines into two-year sprints, forcing operators to adopt edge-compute and private-network architectures sooner than planned.
Page last updated on:


