Silicon Fertilizer Market Size and Share
Market Overview
| Study Period | 2020 - 2030 |
|---|---|
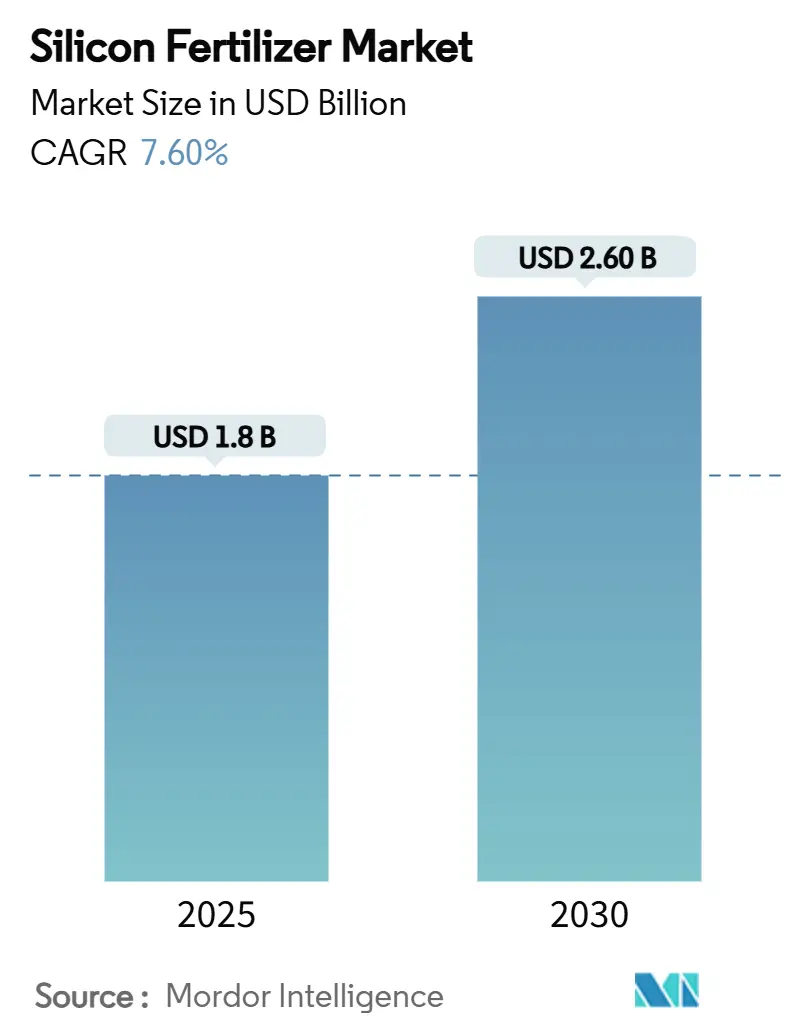
| Market Size (2025) | USD 1.8 Billion |
| Market Size (2030) | USD 2.60 Billion |
| Growth Rate (2025 - 2030) | 7.60% CAGR |
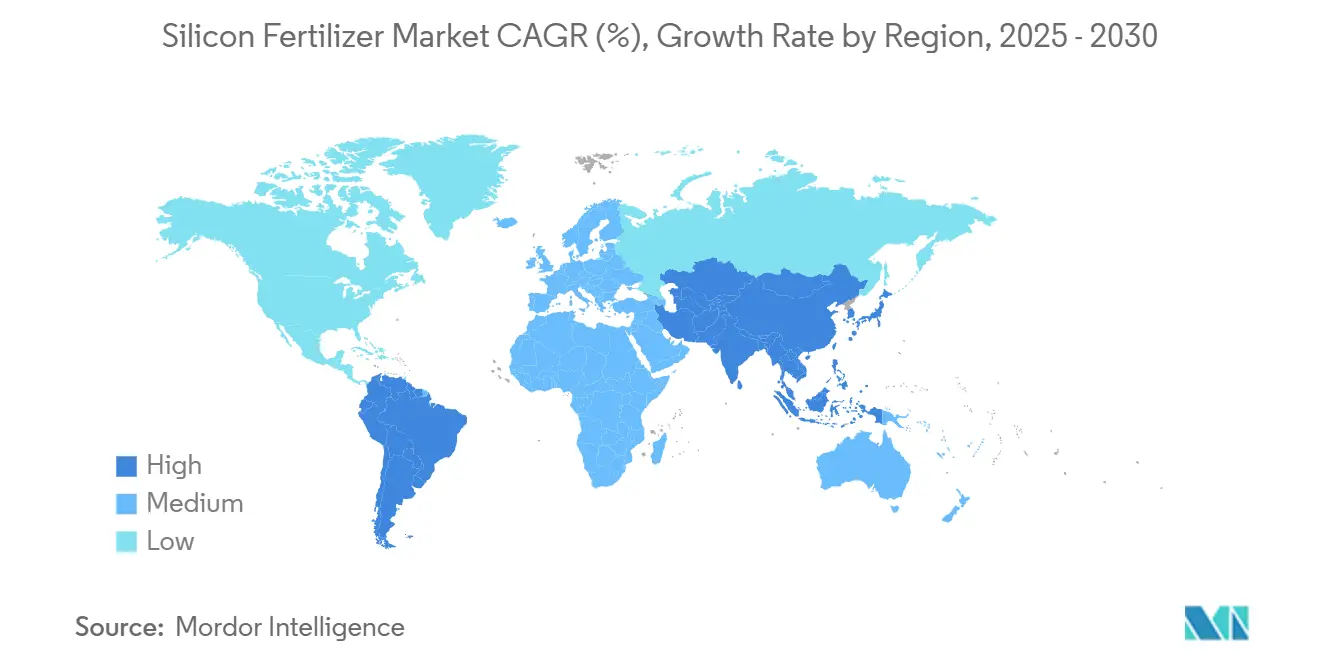
| Fastest Growing Market | Asia Pacific |
| Largest Market | North America |
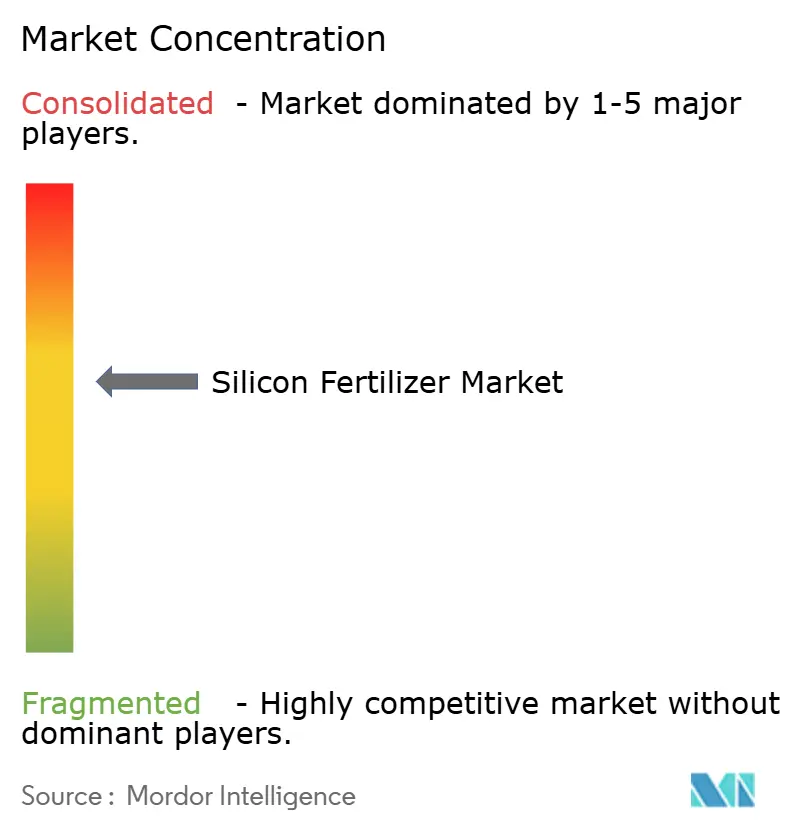
| Market Concentration | Medium |
Major Players
*Disclaimer: Major Players sorted in no particular order Image © Mordor Intelligence. Reuse requires attribution under CC BY 4.0. |
|
Silicon Fertilizer Market Analysis by Mordor Intelligence
The silicon fertilizer market size was valued at USD 1.8 billion in 2025 and is forecast to reach USD 2.6 billion by 2030, advancing at a 7.6% CAGR. Demand is rising as growers incorporate silicon to protect crops from drought, salinity, and disease, while precision-farming tools make application easier and more profitable. Field studies show silicon treatments can lift wheat yields by as much as 80% and raise soil water availability by 40%. [1]Source: Phys.org, “Silicon boosts wheat yields and soil water.” phys.orgAdoption is fastest in the Asia-Pacific region, where governments link sustainability subsidies to silicon use, and where rice, the world’s most silicon-hungry crop, dominates the planted area. North America holds the largest revenue share because specialty growers integrate silicon into high-value horticulture and controlled-environment systems. Product innovation is shifting toward nano-formulations that deliver silicon precisely and toward industrial by-product upcycling, which lowers costs and reduces the carbon footprint. A moderately fragmented supplier base is consolidating around firms able to pair silicon with digital services and carbon-credit programs.
Key Report Takeaways
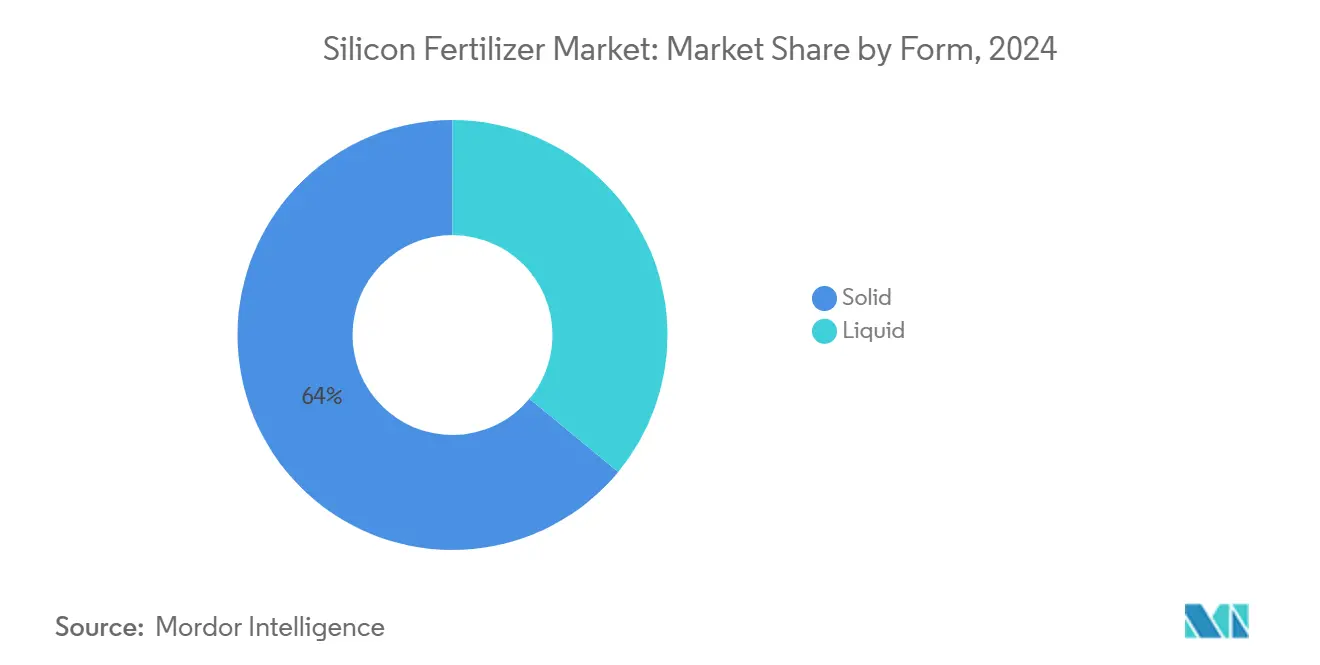
- By form, the solid segment accounted for 64% of the silicon fertilizer market share in 2024, while liquid products are expanding at an 11.2% CAGR through 2030.
- By source, calcium silicate led with 46% revenue share in 2024, and potassium silicate is the fastest-growing segment at 9.2% CAGR through 2030.
- By crop type, cereals and grains commanded 28% of the silicon fertilizer market size in 2024, and fruits and vegetables are projected to grow at a 10.5% CAGR to 2030.
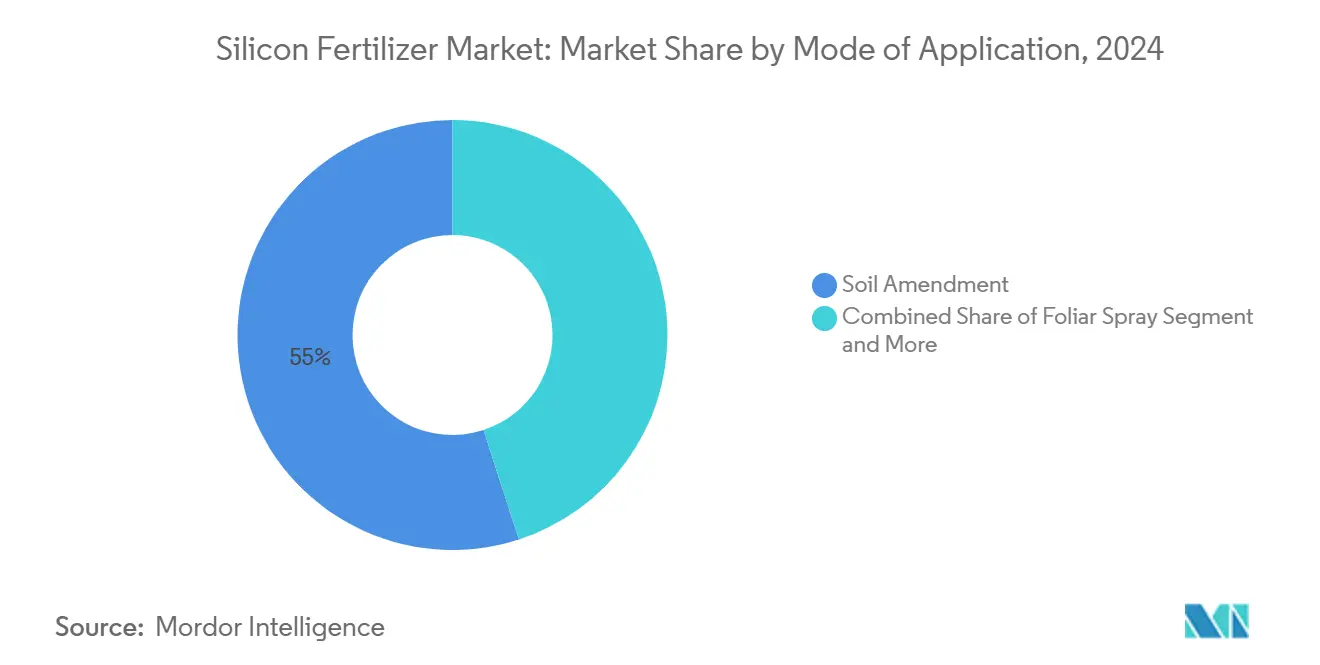
- By mode of application, soil amendments represented 55% of the market in 2024, whereas hydroponic uses are advancing at a 15% CAGR through 2030.
- By geography, North America remains the largest regional market by value, representing a 25% share of the market, while the Asia-Pacific region is the fastest-growing, with a 9.4% CAGR to 2030.
Global Silicon Fertilizer Market Trends and Insights
Drivers Impact Analysis*
| Driver | (~) % Impact on CAGR Forecast | Geographic Relevance | Impact Timeline |
|---|---|---|---|
| Expanding government sustainability mandates | +1.2% | Global, strongest in European Union and Asia-Pacific | Medium term (2–4 years) |
| Yield-boost focus in high-value horticulture | +0.9% | North America, Europe, and premium Asian markets | Short term (≤ 2 years) |
| Rising abiotic-stress incidents (drought, salinity) | +1.5% | Global, notably water-stressed zones | Long term (≥ 4 years) |
| Nano-silicon carrier technologies | +0.8% | Developed markets, spreading to emerging | Medium term (2–4 years) |
| Carbon-credit-linked soil-silicon programs | +0.4% | European Union, North America, and voluntary global markets | Long term (≥ 4 years) |
| Silicon-rich industrial by-products upcycling | +0.6% | Steel and mining regions | Medium term (2–4 years) |
| Source: Mordor Intelligence | |||
Expanding Government Sustainability Mandates
The European Union’s Farm-to-Fork strategy, India’s balanced fertilization initiatives, and China’s zero-growth pesticide policy all highlight silicon’s potential as a sustainable input to reduce reliance on conventional agrochemicals. In the United States, the National Organic Program allows potassium silicate solutions up to 1.0% by weight, widening the organic addressable market.[2]Source: USDA Agricultural Marketing Service, "Aqueous Potassium Silicate" usda.govSubsidies and technical assistance are accelerating adoption, especially among rice growers seeking pesticide reductions and audit-ready traceability.
Yield-Boost Focus in High-Value Horticulture
Greenhouse tomato operations record up to 61% yield gains when silicon is dosed through hydroponic solutions. Growers of berries, cucumbers, and ornamentals utilize silicon to enhance firmness, shelf life, and transport tolerance, which directly translates into premium pricing. Cannabis facilities also note larger inflorescences when combining silicate with phosphite biostimulants.
Rising Abiotic-Stress Incidents
More frequent drought and salinity events intensify the search for resilience technologies. Silicon deposition thickens cell walls, cuts oxidative stress markers, and can lift plant water-use efficiency by 40%, keeping leaves turgid when irrigation is limited. These gains are most valuable in regions with growing water scarcity and erratic rainfall. As climate volatility accelerates, silicon’s protective role against heat, salt, and heavy metal stress becomes increasingly indispensable. This is prompting greater adoption among farmers seeking low-cost, soil-applied solutions that strengthen crop defenses naturally.
Nano-Silicon Carrier Technologies
Engineered nanoparticles provide higher bioavailability and on-demand release. Dual stimuli-responsive nanosystems that co-deliver salicylic acid and silicon have proved effective in long-duration immunity against rice blast with reduced fungicide loads. Such precision opens the silicon fertilizer market opportunities in digital farming platforms. These smart delivery systems can be integrated with sensor-based diagnostics to trigger nutrient release based on real-time crop stress indicators. This alignment with precision agriculture trends enhances input efficiency and appeals to sustainability-driven agtech investors
Restraints Impact Analysis*
| Restraint | (~) % Impact on CAGR Forecast | Geographic Relevance | Impact Timeline |
|---|---|---|---|
| Limited global regulatory harmonization | -0.8% | Worldwide, affecting trade flows | Medium term (2–4 years) |
| Price premium over conventional fertilizers | -1.1% | Price-sensitive developing markets | Short term (≤ 2 years) |
| Silicate buildup risk in closed-loop hydroponics | -0.3% | Controlled-environment farms | Short term (≤ 2 years) |
| Scarcity of crop-specific silicon dosing data | -0.5% | Global precision-farming users | Medium term (2–4 years) |
| Source: Mordor Intelligence | |||
Price Premium Over Conventional Fertilizers
Silicon granules and liquids cost 20–40% more than standard NPK blends. Profitability is evident in premium crops but less so in low-margin grains, which restrains uptake among smallholders. Limited awareness of the long-term benefits to soil health further reduces the willingness to invest. Additionally, the lack of subsidy support compared to traditional fertilizers keeps silicon options out of reach for many cost-sensitive growers.
Limited Global Regulatory Harmonization
Divergent safety thresholds for silicon compounds between the European Chemicals Agency and regulators in North America and Asia complicate product registration and labeling, raising compliance costs. These inconsistencies delay market entry for manufacturers and discourage cross-border investments. The absence of a unified classification for silicon as an essential plant nutrient further limits its inclusion in national fertilizer subsidy schemes.
*Our forecasts treat driver/restraint impacts as directional, not additive. The impact forecasts reflect baseline growth, mix effects, and variable interactions.
Segment Analysis
By Form: Solid Dominance with Liquid Innovation
Solid silicon fertilizers maintained 64% of the 2024 revenue, driven by calcium silicate applications on large-scale rice and sugarcane farms. This segment holds the largest silicon fertilizer market share due to the compatibility of granules with existing spreader equipment and their sustained nutrient release throughout the growing season. The liquid formulations segment is experiencing growth at an 11.2% CAGR. Foliar potassium silicate applications provide dual nutrient benefits, while nano-silicon emulsions enable rapid leaf absorption, reducing application volumes. Research on greenhouse lettuce demonstrated that liquid nano-silicon increased yields by 61% and enhanced storage quality.
The increasing demand for liquid formulations aligns with precision agriculture adoption. Controlled-environment agriculture operations prefer drip irrigation and misting systems that require clog-resistant solutions. For field applications, drone-based foliar spraying reduces labor costs, while liquid formulations that blend with existing spray programs attract orchard and vineyard operators. The integration of remote sensing technology to monitor crop stress enables precise, variable-rate silicon applications during periods of plant vulnerability, supporting growth in the liquid silicon fertilizer segment.


By Source: Calcium Silicate Leadership Amid Nano-Silicon Emergence
Calcium silicate generated 46% of the silicon fertilizer market size revenue in 2024, providing soils with sustained silicon release while improving pH levels and calcium availability. The product remains the primary agronomic choice, particularly in tropical paddy soils where silicon levels frequently measure below 40 mg Si kg¹. Potassium silicate is the fastest-growing segment in the silicon fertilizer market, with a projected CAGR of 9.2%, driven by its dual nutrient properties and complete solubility, which make it highly suitable for hydroponic and foliar applications. Although potassium silicate currently ranks second in market share, its versatility in enhancing plant health and stress tolerance underpins strong adoption.
Sodium silicate and diatomaceous earth fulfill specialized requirements in turfgrass management and organic orchard operations that require gradual nutrient release. The diversification of silicon sources strengthens supply chain stability and reduces market barriers. The calcium silicate segment continues to maintain its leadership position in the silicon fertilizer market, despite the growing adoption of nano-silica applications.
By Crop Type: Cereals Foundation with Horticultural Expansion
Cereals and grains accounted for 28% of silicon fertilizer demand in 2024. Rice producers in China, India, and Vietnam have used silicon fertilizers for decades, with field studies demonstrating grain yield increases of 5-25% and decreased instances of lodging and blast disease.[3]Source: Journal of Applied and Natural Science, “Silicon fertilization in cereals.” journals.ansfoundation.orgWheat and maize applications are increasing as drought resistance becomes more critical.
Fruits and vegetables are driving market growth, with greenhouse tomatoes, strawberries, and cucumbers commanding higher prices when silicon enhances their firmness and shelf life. This segment is set to grow at a 10.5% CAGR, surpassing the growth rate of cereals. Sugar crops, including Brazilian sugarcane and expanding oilseed cultivation in Argentina, contribute additional volume, especially as processors require crops resistant to heat and water stress.
By Mode of Application: Soil Amendment Tradition Meets Hydroponic Innovation
Soil amendments account for 55% of silicon fertilizer revenue in 2024. Large-scale rice, sugarcane, and soybean farms incorporate calcium silicate or slag during land preparation to restore depleted soil reserves and enhance root-zone chemistry. This application method suits extensive farming systems as silicon releases gradually over multiple growing seasons, reducing the per-season application costs.
Foliar applications and hydroponic delivery methods show significant growth. The hydroponic segment is projected to grow at a 15% CAGR, driven by the expansion of vertical farms and greenhouses. Research demonstrates that silicon-enriched nutrient solutions improve hydroponic lettuce yields and quality, confirming benefits in soilless cultivation systems. Growers increasingly adopt foliar silicon sprays combined with biostimulants to reduce synthetic fungicide usage. The integration of sensor technology for real-time canopy stress detection enables precision-based foliar silicon applications, indicating potential market expansion for this application method.
Geography Analysis
North America remains the largest single-value market, representing approximately 25% of the silicon fertilizer market, owing to premium horticulture and controlled-environment agriculture. Hydroponic strawberry, lettuce, and cannabis operations implement silicon for higher yields and extended shelf life, justifying higher spend. The region’s well-established supply chains and advanced farming technologies further support sustained silicon fertilizer demand.
Asia-Pacific leads the silicon fertilizer market with a 9.4% CAGR to 2030. China’s Ministry of Agriculture promotes silicon as a sustainable input for 30 million ha of paddy, and Indian programs subsidize secondary nutrients that include silicon for degraded soils. Indonesia and Thailand follow suit as research proves silicon doses restore yields on acidic rice soils. These coordinated efforts position Asia-Pacific as the most dynamic and fast-growing region for silicon fertilizer adoption.
South America grows at a significant CAGR. Brazil routinely applies 4-8 t ha¹ of calcium silicate to sugarcane, with studies showing superior silicon recovery over successive ratoon crops scielo.br. Argentina is integrating silicon into soybean fertility packages to strengthen nodulation under drought. The region’s deep adoption of large export-oriented crops makes it an anchor for volume growth. Europe, growing is propelled by the Common Agricultural Policy’s chemical-input reduction targets, which position silicon as a biological alternative. In the Middle East and Africa, uptake is starting from a smaller base yet climbs a significant CAGR as import-dependent countries seek water-efficient and salinity-resilient production systems.

Competitive Landscape
The top five suppliers controlled a majority share of the market in 2024, indicating moderate concentration. PQ Corporation spearheads, owing to its AgSil brand and strong presence in potassium silicate liquids. The company is retrofitting furnaces to process recycled glass cullet, reducing energy needs, and integrating circularity into its product line.
Agripower Australia leverages large deposits of amorphous silica that require minimal processing energy, offering a cost edge in Asia-Pacific markets. MaxSil Pty Ltd. products target golf turf and specialty crops, while Denka focuses on high-purity calcium silicate for Japanese rice growers. Below the top tier, nano-silicon startups and slag-upcycling specialists, such as Harsco Environmental, carve out regional niches where local supply chains and customer support are crucial.
Suppliers that combine silicon fertilizer products with agronomic advisory services and remote-sensing data are gaining market share by offering integrated solutions tailored to grower needs. These value-added services help optimize fertilizer application and improve crop health monitoring, driving stronger customer loyalty. As digital agriculture advances, companies investing in data-driven insights alongside product innovation are best positioned to lead the silicon fertilizer market.
Silicon Fertilizer Industry Leaders
-
PQ Corporation (AgSil)
-
Agripower Australia
-
MaxSil Pty Ltd.
-
Denka Corporation Ltd
-
Haifa Group International Chemical Co., Ltd.
- *Disclaimer: Major Players sorted in no particular order

Recent Industry Developments
- June 2025: Research in the Journal of Nanobiotechnology unveiled dual stimuli-responsive nanosystems that co-deliver salicylic acid and bioavailable silicon, lengthening disease protection in rice.
- April 2025: Salk Institute scientists identified peptide CLE16 that fosters mycorrhizal symbiosis, potentially reducing fertilizer needs and complementing silicon’s stress-mitigation role.


Global Silicon Fertilizer Market Report Scope
| Solid |
| Liquid |
| Calcium Silicate |
| Potassium Silicate |
| Sodium Silicate |
| Others |
| Cereals and Grains |
| Fruits and Vegetables |
| Sugar Crops |
| Oilseeds |
| Others |
| Soil Amendment |
| Foliar Spray |
| Hydroponics/Controlled-Environment |
| North America | United States |
| Canada | |
| Rest of North America | |
| South America | Brazil |
| Argentina | |
| Rest of South America | |
| Europe | Germany |
| France | |
| Italy | |
| Spain | |
| Russia | |
| Rest of Europe | |
| Asia-Pacific | China |
| India | |
| Japan | |
| Australia | |
| Rest of Asia-Pacific | |
| Middle East | Saudi Arabia |
| United Arab Emirates | |
| Rest of Middle East | |
| Africa | South Africa |
| Egypt | |
| Rest of Africa |
| By Form | Solid | |
| Liquid | ||
| By Source | Calcium Silicate | |
| Potassium Silicate | ||
| Sodium Silicate | ||
| Others | ||
| By Crop Type | Cereals and Grains | |
| Fruits and Vegetables | ||
| Sugar Crops | ||
| Oilseeds | ||
| Others | ||
| By Mode of Application | Soil Amendment | |
| Foliar Spray | ||
| Hydroponics/Controlled-Environment | ||
| By Geography | North America | United States |
| Canada | ||
| Rest of North America | ||
| South America | Brazil | |
| Argentina | ||
| Rest of South America | ||
| Europe | Germany | |
| France | ||
| Italy | ||
| Spain | ||
| Russia | ||
| Rest of Europe | ||
| Asia-Pacific | China | |
| India | ||
| Japan | ||
| Australia | ||
| Rest of Asia-Pacific | ||
| Middle East | Saudi Arabia | |
| United Arab Emirates | ||
| Rest of Middle East | ||
| Africa | South Africa | |
| Egypt | ||
| Rest of Africa | ||


Key Questions Answered in the Report
Which crops respond most to silicon fertilization?
Rice shows the strongest response due to its high accumulation capacity, while greenhouse tomatoes, cucumbers, and sugarcane also register sizable yield and quality benefits.
What is the current size and growth outlook for the silicon fertilizer market?
The silicon fertilizer market size is USD 1.8 billion in 2025 and is forecast to reach USD 2.6 billion by 2030, reflecting a 7.6% CAGR.
How do nano-silicon products differ from conventional granules?
Nano-silicon offers higher bioavailability and can be programmed for controlled release, enabling lower application rates and compatibility with precision-farming platforms.
Which form of silicon is gaining popularity fastest?
Liquid products are expanding at an 11.2% CAGR through 2030 owing to the precision agriculture adoption.
Page last updated on:


