Market Overview
| Study Period | 2021 - 2031 |
|---|---|
| Forecast Data Period | 2026 - 2031 |
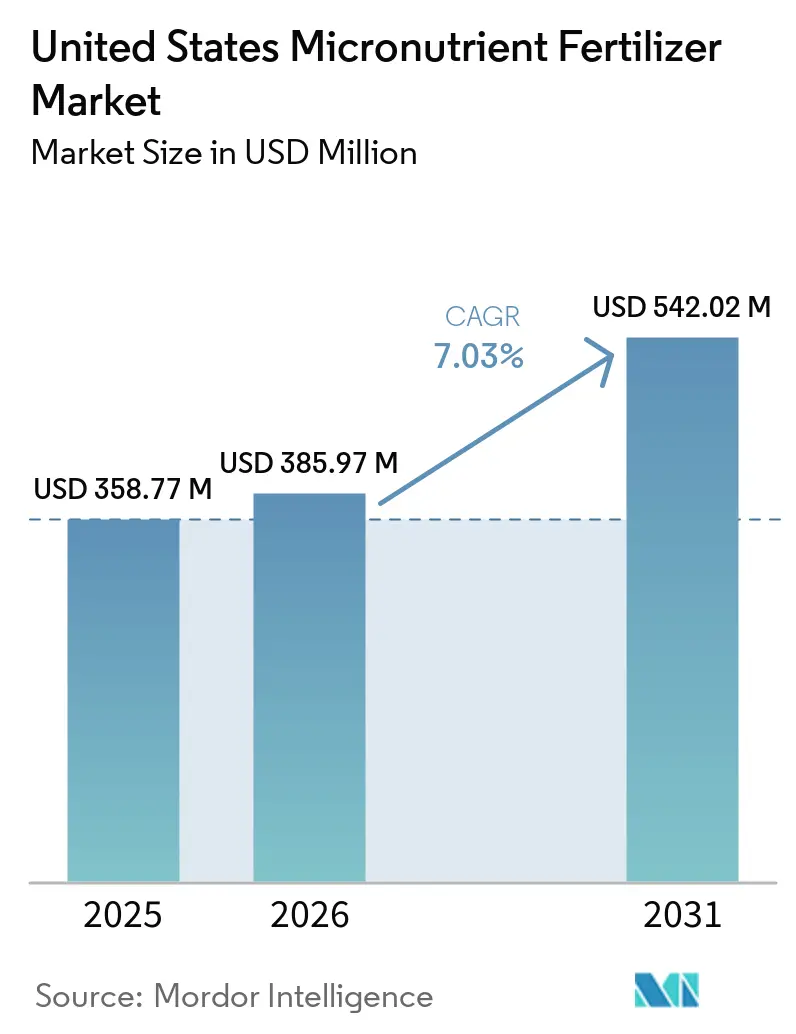
| Base Year Market Size (2025) | USD 358.77 Million |
| Market Size (2026) | USD 385.97 Million |
| Market Size (2031) | USD 542.02 Million |
| Growth Rate (2026 - 2031) | 7.03% CAGR |
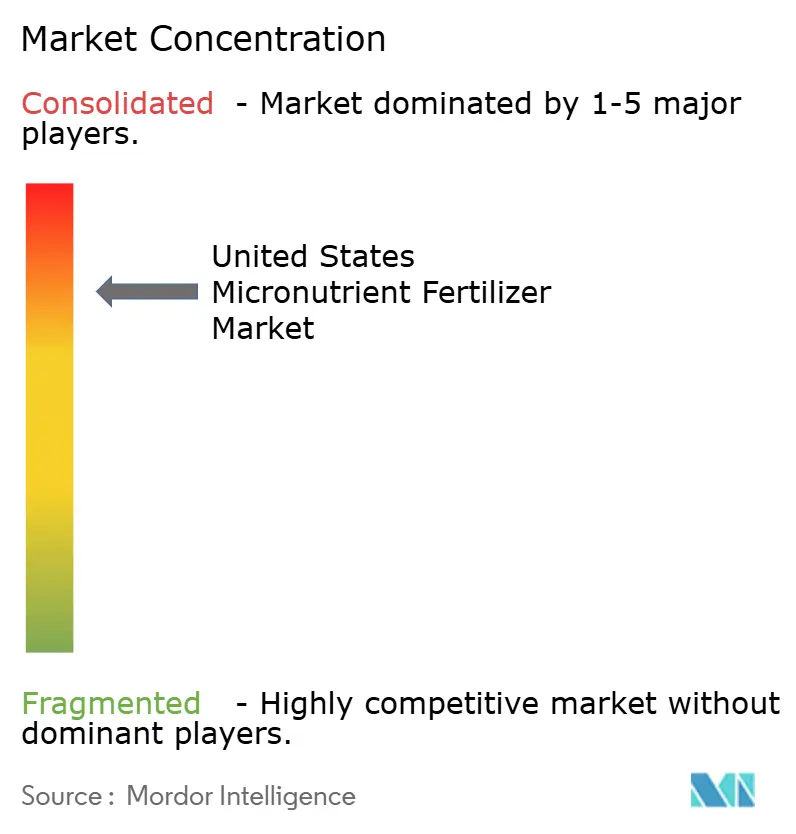
| Market Concentration | High |
Major Players*Disclaimer: Major Players sorted in no particular order Image © Mordor Intelligence. Reuse requires attribution under CC BY 4.0. | |
United States Micronutrient Fertilizer Market Analysis by Mordor Intelligence
The United States micronutrient fertilizer market size is projected to grow from USD 358.77 million in 2025 to USD 385.97 million in 2026 and is forecast to reach USD 542.02 million by 2031 at 7.03% CAGR over 2026-2031. Steady growth reflects the agriculture sector’s stronger focus on addressing zinc and boron shortages, which suppress yields despite adequate N-P-K application[1]Source: Charles Wortmann, “Micronutrient Deficiencies in Corn and Soybeans,” University of Nebraska-Lincoln CropWatch, cropwatch.unl.edu. Uptake of variable-rate technology, intensified specialty-crop acreage, and USDA conservation incentives are accelerating adoption of chelated blends and liquid formulations. Meanwhile, the United States micronutrient fertilizers market benefits from carbon programs that reward higher nutrient-use efficiency, creating new revenue streams for growers. Price sensitivity in row crops, regenerative “input-light” philosophies, and tank-mix issues with high-analysis phosphate starters temper near-term momentum.
Key Report Takeaways
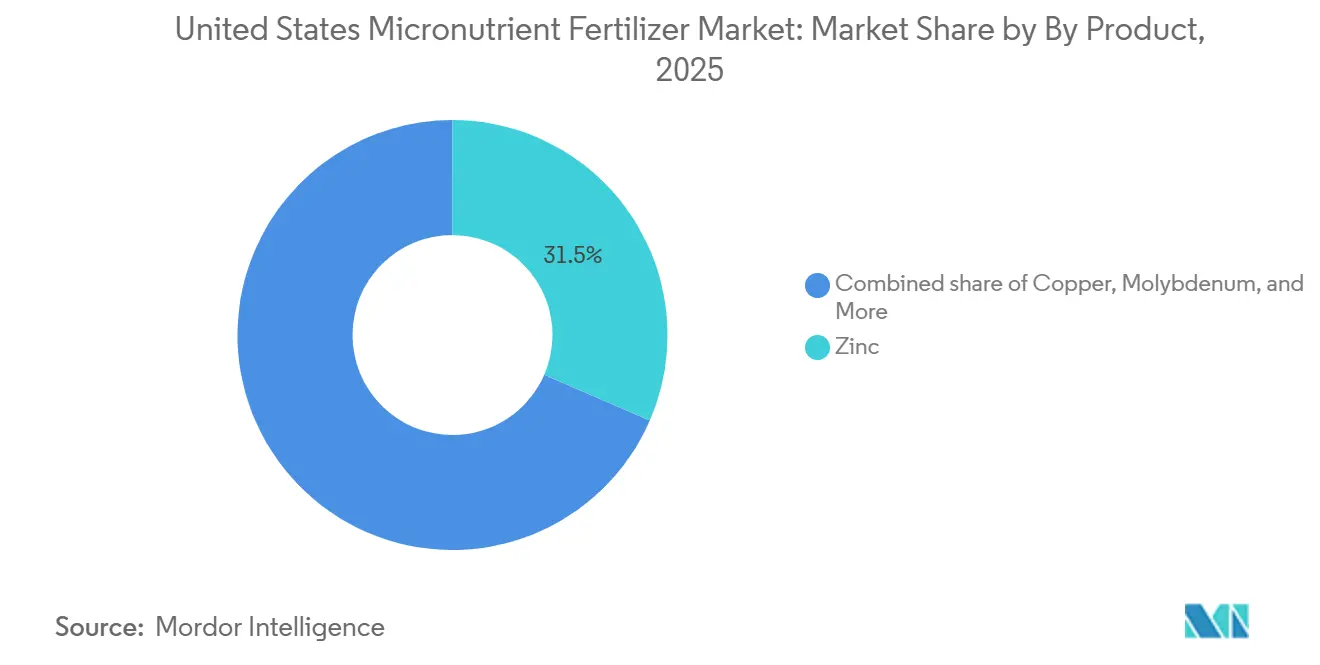
- By product, zinc held the largest United States micronutrient fertilizer market share at 31.5% in 2025, while molybdenum is the fastest-growing at a 7.3% CAGR during 2026 to 2031.
- By form, conventional products were the largest segment at 76.3% in 2025, while specialty formulations are the fastest-growing at a 6.6% CAGR through 2031.
- By application, soil application was the largest segment at 76.8% in 2025, while fertigation is the fastest-growing at a 6.8% CAGR through 2031.
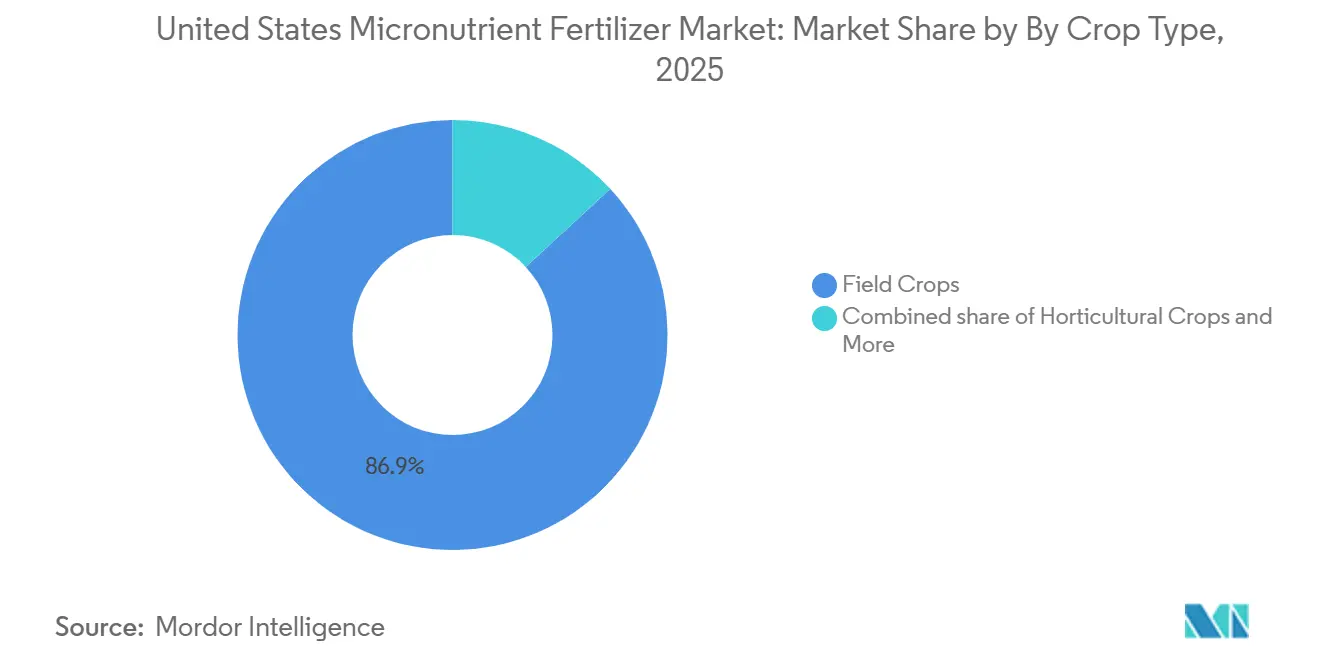
- By crop type, field crops accounted for the largest United States micronutrient fertilizer market size at 86.9% in 2025, while horticultural crops are the fastest-growing at an 8.0% CAGR through 2031.
Note: Market size and forecast figures in this report are generated using Mordor Intelligence’s proprietary estimation framework, updated with the latest available data and insights as of 2026.
United States Micronutrient Fertilizer Market Trends and Insights
Drivers Impact Analysis*
| Driver | (~) % Impact on CAGR Forecast | Geographic Relevance | Impact Timeline |
|---|---|---|---|
| Precision-rate micronutrient application | +1.2% | Corn Belt, California Central Valley, Eastern Washington | Medium term (2-4 years) |
| Documented zinc and boron shortages | +1.5% | Iowa, Illinois, Indiana, Ohio, Nebraska | Short term (≤ 2 years) |
| Specialty-crop acreage expansion | +1.0% | California Central Valley, Florida citrus belt | Long term (≥ 4 years) |
| USDA cost-share for micronutrient plans | +0.8% | Nationwide, early uptake in Midwest and Great Plains | Medium term (2-4 years) |
| In-furrow chelated blends for low-pH soils | +0.9% | Southeast, Pacific Northwest, Northeast | Medium term (2-4 years) |
| Carbon programs rewarding nutrient efficiency | +0.7% | California, Iowa, Illinois, voluntary carbon markets | Long term (≥ 4 years) |
| Source: Mordor Intelligence | |||


Precision-Rate Micronutrient Application
Variable-rate spreaders and liquid injectors now deliver zinc, boron, or blended packages at 0.5-4 lb per acre within a single pass, matching spatial variability identified through grid sampling and yield maps. University field trials show 15-25% higher nutrient-use efficiency and lower total applied pounds relative to uniform rates. Equipment makers bundle micronutrient modules into existing hardware, cutting incremental costs and accelerating adoption across the United States micronutrient fertilizers market. Retail agronomists leverage the data layer to document environmental benefits for USDA programs and carbon registries, further strengthening farmers.
Documented zinc and boron shortages
Soil surveys reveal 47% of eastern Nebraska fields below critical zinc thresholds, with 31% also lacking boron. Higher yields, phosphorus antagonism, and minimal tillage intensify the risks of shortages. As the United States micronutrient fertilizers market pivots toward routine tissue and soil diagnostics every three to four years, demand for granular zinc sulfate, boric acid, and chelated liquids rises. Agronomists calculate that correcting severe deficiencies can add 10-20 bushels per acre in corn, easily covering an extra USD 15-25 per-acre expenditure on micronutrients.
Specialty-crop acreage expansion
California almond plantings increased by 12% between 2020 and 2024, and Florida citrus shifted toward protected culture, necessitating precise foliar feeding. These crops often require three to five micronutrient applications each season, compared to one or two on row crops, which drives per-acre spending above USD 50. The United States micronutrient fertilizers market experiences a strong demand for chelated zinc, boron, iron, and multi-nutrient tank mixes that protect fruit quality, kernel fill, and shelf life. Growers prefer liquids that are compatible with electrostatic sprayers and drip systems to minimize labor and water usage.
USDA cost-share for micronutrient plans
EQIP and CSP now reimburse 50-75% of soil-testing costs and 25-50% of the first-year corrective applications when micronutrients are integrated into nutrient management plans [2]Source: USDA Natural Resources Conservation Service, “EQIP Environmental Quality Incentives Program,” usda.gov. Participation increased by 34% since 2022, particularly in watersheds facing nutrient runoff targets. Cost relief boosts adoption across small and mid-sized farms, providing the United States micronutrient fertilizers market with a policy tailwind while demonstrating that balanced nutrition enhances soil health indicators, such as aggregate stability and microbial respiration.
Restraints Impact Analysis*
| Restraint | (~) % Impact on CAGR Forecast | Geographic Relevance | Impact Timeline |
|---|---|---|---|
| Price premium versus N-P-K | -1.1% | Corn Belt and Great Plains broad-acre farms | Short term (≤ 2 years) |
| Corn and soybean price volatility | -0.9% | Midwest and Great Plains | Short term (≤ 2 years) |
| Tank-mix issues with phosphate starters | -0.6% | Nationwide no-till systems | Medium term (2-4 years) |
| Regenerative “input-light” movement | -0.8% | California, Iowa, Illinois | Long term (≥ 4 years) |
| Source: Mordor Intelligence | |||
Price premium versus N-P-K
The cost differential between micronutrient applications and traditional N-P-K fertilizers creates economic resistance among broad-acre farmers operating on thin profit margins. Micronutrient blends cost USD 15-25 per acre, compared to USD 8-12 for N-P-K. With row-crop margins often ranging from USD 50 to USD 150 per acre, growers hesitate unless a clear yield improvement is proven. Trials indicate a break-even point at 3-5 bushels per acre (bu) corn or 1-2 bushels per acre (bu) soybean yield gains, with results not uniform across soil types [3]Source: USDA Economic Research Service, “Drivers of Fertilizer Markets: Supply, Demand, and Prices,” ers.usda.gov. This restraint limits the penetration of United States micronutrient fertilizers into clearly deficient fields.
Tank-mix issues with phosphate starters
Chemical incompatibility between micronutrient formulations and phosphate starter fertilizers creates application timing and logistics challenges that limit the adoption of these practices in no-till and minimum-till systems. Zinc sulfate can precipitate with 10-34-0 starters, clogging orifices and reducing nutrient availability by up to 40% in alkaline water. Compatibility agents add 20-30% to the cost, while separate passes increase labor and fuel costs. These hurdles slow specialty formulations in the United States micronutrient fertilizers market, where one-pass nutrient delivery is a priority.
*Our forecasts treat driver/restraint impacts as directional, not additive. The impact forecasts reflect baseline growth, mix effects, and variable interactions.
Segment Analysis
By Product: Zinc Remains Dominant while Molybdenum Accelerates
Zinc held the largest United States micronutrient fertilizers market share at 31.5% in 2025, supported by widespread use across corn, soybean, and wheat production, where zinc deficiencies remain common in high-yielding systems. Sustained demand from zinc-deficient and alkaline soils, coupled with high-pH irrigation conditions, reinforces its position. Copper also remains an important product category due to its nutritional benefits and use in certain crop protection programs across corn, soybean, and specialty crop production, while boron continues to gain traction in deficiency-prone regions despite its relatively narrow application margins.
Molybdenum, though a smaller segment, is the fastest-growing product category, with a projected CAGR of 7.3% through 2031. Growth is driven by increasing emphasis on biological nitrogen fixation and nitrogen-use efficiency, particularly in legume production systems. Ongoing research into mechanochemically modified Mo-Zn composites with slow-release nutrient delivery characteristics may support future product innovation within the segment. Additionally, advancements in second-generation chelates and dry dispersible powder formulations improve performance in calcareous soils, enabling premium pricing opportunities. Specialty growers in California are increasingly adopting multi-micronutrient application programs that favor tank-stable blends for both drip and aerial applications, supporting broader micronutrient market expansion.


By Form: Conventional Dominates while Specialty Innovation Gains Ground
Conventional sulfates, oxides, and basic salts accounted for 76.3% of the United States micronutrient fertilizer market size in 2025, due to their low cost and broad availability. Despite dominance, specialty forms are growing at a 6.6% CAGR through 2031. Liquids enable uniform, variable-rate placement alongside herbicides, while controlled-release coatings reduce leaching and soil tie-up, which is critical in sandy Florida citrus groves. Water-soluble powders boost foliar uptake for horticulture and turf managers. Field evidence shows yield benefits and simplified logistics offsetting premiums, especially where carbon programs grant additional value for efficiency gains.
Advances in polymer coatings and nano-encapsulation drive differentiation as suppliers seek to expand their margins beyond basic commodities. Investments in proprietary chemistries by market leaders signal a strategic pivot to specialty value pools, elevating the overall sophistication of the United States micronutrient fertilizers industry.
By Application Method: Soil Application Anchors Market While Fertigation Gains Momentum
Soil application methods dominated micronutrient delivery with 76.8% market share in 2025, yet fertigation is emerging as the fastest-growing application approach with 6.8% CAGR through 2031, driven by precision agriculture adoption and water-use efficiency imperatives. Traditional broadcast and incorporated soil applications remain the preferred method for broad-acre field crops due to their compatibility with existing equipment and proven effectiveness in correcting widespread soil deficiencies. The approach benefits from established agronomic protocols and cost-effectiveness, particularly for zinc and boron applications where soil incorporation ensures sustained availability throughout the growing season.
Fertigation's accelerated growth reflects the increasing sophistication of irrigation systems and the need for precise nutrient timing in high-value specialty crops. The shift toward fertigation is supported by advances in water-soluble chelated formulations that maintain stability in irrigation systems while providing enhanced bioavailability compared to conventional soil-applied forms.
By Crop Type: Field Crops Anchors while Horticulture Drives Growth
Field crops accounted for the largest United States micronutrient fertilizers market size at 86.9% in 2025, driven by extensive corn, soybean, wheat, and cotton acreage, where micronutrients play a critical role in maintaining yield potential and nutrient-use efficiency. Corn remains the largest consumer due to its high zinc requirements, while boron, manganese, and copper are increasingly incorporated into nutrient programs across major row-crop regions. Even at a relatively modest spend of USD 15–20 per acre, the scale of U.S. field-crop production translates into substantial micronutrient demand. Turf and ornamental segments also provide a stable source of consumption, supporting retail programs, golf courses, landscaping activities, and manufacturing plant utilization throughout the year.
Horticultural crops are the fastest-growing segment, projected to grow at a 8.0% CAGR through 2031. This growth is driven by strong demand for almonds, grapes, citrus, berries, nuts, and high-density vegetable production systems. Growers are increasingly adopting targeted micronutrient programs to enhance fruit quality, color, shelf life, and export performance, as even minor nutrient deficiencies can impact profitability. For instance, California almond growers invest over USD 75 per acre in multiple micronutrient applications, underscoring the importance of crop quality and yield optimization. The continued expansion of specialty crop acreage and the adoption of precision nutrition practices are projected to further boost micronutrient demand within the horticultural segment.
Geography Analysis
The Corn Belt anchors the largest share of the United States micronutrient fertilizers market, driven by vast corn and soybean acreages and documented deficiencies in zinc and boron. No-till adoption reduces vertical soil mixing, prompting growers to adopt granular and in-furrow solutions for early-season uptake. Retail networks offer bundled soil testing and variable-rate prescriptions, reinforcing penetration.
California ranks second despite limited acreage. High-pH soils, the intensity of specialty crops, and strict environmental regulations promote the use of chelated liquids and fertigation-ready powders. Growers demonstrate a willingness to pay for solutions that protect yields and comply with nutrient-management mandates.
The Great Plains region sees moderate expansion as irrigated corn and wheat boost micronutrient removal from alkaline loess soils. Suppliers focus on zinc and iron liquids compatible with strip-till systems. In the Southeast, acidic sands drive demand for DTPA-chelated zinc and manganese, often placed in-furrow to limit leaching during heavy rains. Florida citrus programs incorporate weekly foliar micronutrient sprays to combat HLB-induced nutrient stress, making the state a test bed for novel blends.
Competitive Landscape
Top Companies in United States Micronutrient Fertilizer Market
The United States micronutrient fertilizers market is characterized by a high concentration, with the top five firms accounting for 84.1% of the revenue in 2024. The Mosaic Company leverages vertically integrated phosphate mining, granular processing, and broad distribution to supply both commodity sulfates and premium chelates. The Andersons Inc. operates extensive rail and river terminals, pairing micronutrients with crop-nutrient bundling for large cooperatives. Yara International ASA leverages global sourcing and proprietary formulations optimized for both drip and foliar systems.
Capital intensity and regulatory compliance form natural entry barriers. Nonetheless, innovation creates white-space for niche players specializing in dry dispersible powders or biologic-micronutrient hybrids. Nutrien has earmarked USD 500 million over five years to develop proprietary micronutrient and biostimulant lines, signaling an escalation in R&D stakes. Patent filings on chelation and controlled-release matrices increase as suppliers seek to protect their differentiation. Distribution partnerships with precision-ag platforms extend reach into data-driven advisory services, deepening customer lock-in.
OEM collaborations embed micronutrient data layers into prescription software, intertwining product performance with agronomic insights. As sustainability metrics infiltrate grain contracts, suppliers able to document greenhouse-gas reductions through balanced nutrition gain competitive tailwinds.
United States Micronutrient Fertilizer Industry Leaders
Sociedad Quimica y Minera de Chile SA
The Andersons Inc.
The Mosaic Company
Wilbur-Ellis Company LLC
Yara International ASA
- *Disclaimer: Major Players sorted in no particular order

Recent Industry Developments
- June 2024: Nutrien Ag Solutions completed the acquisition of Suncor Energy AgroScience assets, adding patented chlorin-based biocontrol technologies to its Loveland Products lineup.
- August 2024: Phospholutions partnered with Toros Agri and WeGrow AG to commercialize RhizoSorb phosphorus fertilizer in North America following successful scale-up trials.
- April 2023: ADOB, a major provider of chelating micronutrients, foliar, and other specialty farming solutions based in Poland, was acquired by Nouryon. Through the acquisition, the company broadened its innovative crop nutrition portfolio.


United States Micronutrient Fertilizer Market Report Scope
Boron, Copper, Iron, Manganese, Molybdenum, Zinc, Others are covered as segments by Product. Fertigation, Foliar, Soil are covered as segments by Application Mode. Field Crops, Horticultural Crops, Turf & Ornamental are covered as segments by Crop Type.Product
| Boron |
| Copper |
| Iron |
| Manganese |
| Molybdenum |
| Zinc |
| Others |
Form
| Conventional | |
| Speciality | CRF |
| Liquid Fertilizer | |
| SRF | |
| Water Soluble |
Application
| Soil |
| Foliar |
| Fertigation |
Crop Type
| Field Crops |
| Horticultural Crops |
| Turf & Ornamental |
| Product | Boron | |
| Copper | ||
| Iron | ||
| Manganese | ||
| Molybdenum | ||
| Zinc | ||
| Others | ||
| Form | Conventional | |
| Speciality | CRF | |
| Liquid Fertilizer | ||
| SRF | ||
| Water Soluble | ||
| Application | Soil | |
| Foliar | ||
| Fertigation | ||
| Crop Type | Field Crops | |
| Horticultural Crops | ||
| Turf & Ornamental | ||


Market Definition
- MARKET ESTIMATION LEVEL - Market Estimations for various types of fertilizers has been done at the product-level and not at the nutrient-level.
- NUTRIENT TYPES COVERED - Micronutients: Zn, Mn, Cu, Fe, Mo, B, and Others
- AVERAGE NUTRIENT APPLICATION RATE - This refers to the average volume of nutrient consumed per hectare of farmland in each country.
- CROP TYPES COVERED - Field Crops: Cereals, Pulses, Oilseeds, and Fiber Crops Horticulture: Fruits, Vegetables, Plantation Crops and Spices, Turf Grass and Ornamentals
| Keyword | Definition |
|---|---|
| Fertilizer | Chemical substance applied to crops to ensure nutritional requirements, available in various forms such as granules, powders, liquid, water soluble, etc. |
| Specialty Fertilizer | Used for enhanced efficiency and nutrient availability applied through soil, foliar, and fertigation. Includes CRF, SRF, liquid fertilizer, and water soluble fertilizers. |
| Controlled-Release Fertilizers (CRF) | Coated with materials such as polymer, polymer-sulfur, and other materials such as resins to ensure nutrient availability to the crop for its entire life cycle. |
| Slow-Release Fertilizers (SRF) | Coated with materials such as sulfur, neem, etc., to ensure nutrient availability to the crop for a longer period. |
| Foliar Fertilizers | Consist of both liquid and water soluble fertilizers applied through foliar application. |
| Water-Soluble Fertilizers | Available in various forms including liquid, powder, etc., used in foliar and fertigation mode of fertilizer application. |
| Fertigation | Fertilizers applied through different irrigation systems such as drip irrigation, micro irrigation, sprinkler irrigation, etc. |
| Anhydrous Ammonia | Used as fertilizer, directly injected into the soil, available in gaseous liquid form. |
| Single Super Phosphate (SSP) | Phosphorus fertilizer containing only phosphorus which has lesser than or equal to 35%. |
| Triple Super Phosphate (TSP) | Phosphorus fertilizer containing only phosphorus greater than 35%. |
| Enhanced Efficiency Fertilizers | Fertilizers coated or treated with additional layers of various ingredients to make it more efficient compared to other fertilizers. |
| Conventional Fertilizer | Fertilizers applied to crops through traditional methods including broadcasting, row placement, ploughing soil placement, etc. |
| Chelated Micronutrients | Micronutrient fertilizers coated with chelating agents such as EDTA, EDDHA, DTPA, HEDTA, etc. |
| Liquid Fertilizers | Available in liquid form, majorly used for application of fertilizers to crops through foliar and fertigation. |


Research Methodology
Mordor Intelligence follows a four-step methodology in all our reports.
- Step-1: IDENTIFY KEY VARIABLES: In order to build a robust forecasting methodology, the variables and factors identified in Step-1 are tested against available historical market numbers. Through an iterative process, the variables required for market forecast are set and the model is built on the basis of these variables.
- Step-2: Build a Market Model: Market-size estimations for the forecast years are in nominal terms. Inflation is not a part of the pricing, and the average selling price (ASP) is kept constant throughout the forecast period for each country.
- Step-3: Validate and Finalize: In this important step, all market numbers, variables and analyst calls are validated through an extensive network of primary research experts from the market studied. The respondents are selected across levels and functions to generate a holistic picture of the market studied.
- Step-4: Research Outputs: Syndicated Reports, Custom Consulting Assignments, Databases & Subscription Platforms


