Aquaculture Fertilizer Market Size and Share
Market Overview
| Study Period | 2020 - 2030 |
|---|---|
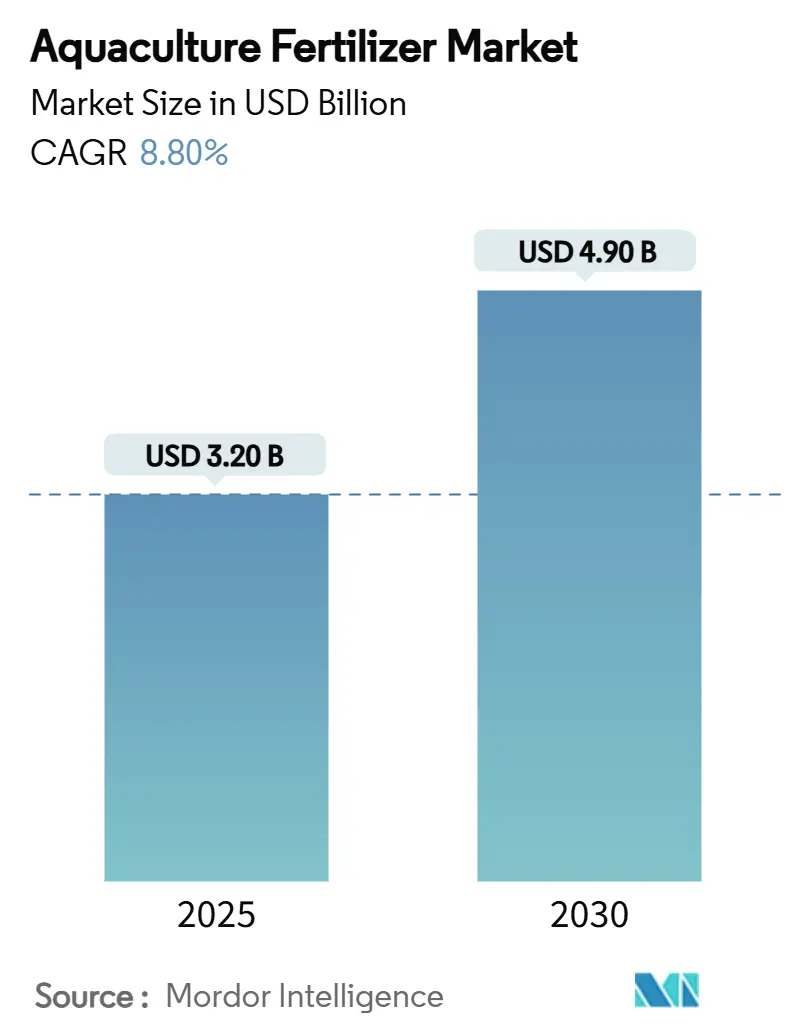
| Market Size (2025) | USD 3.20 Billion |
| Market Size (2030) | USD 4.90 Billion |
| Growth Rate (2025 - 2030) | 8.80% CAGR |
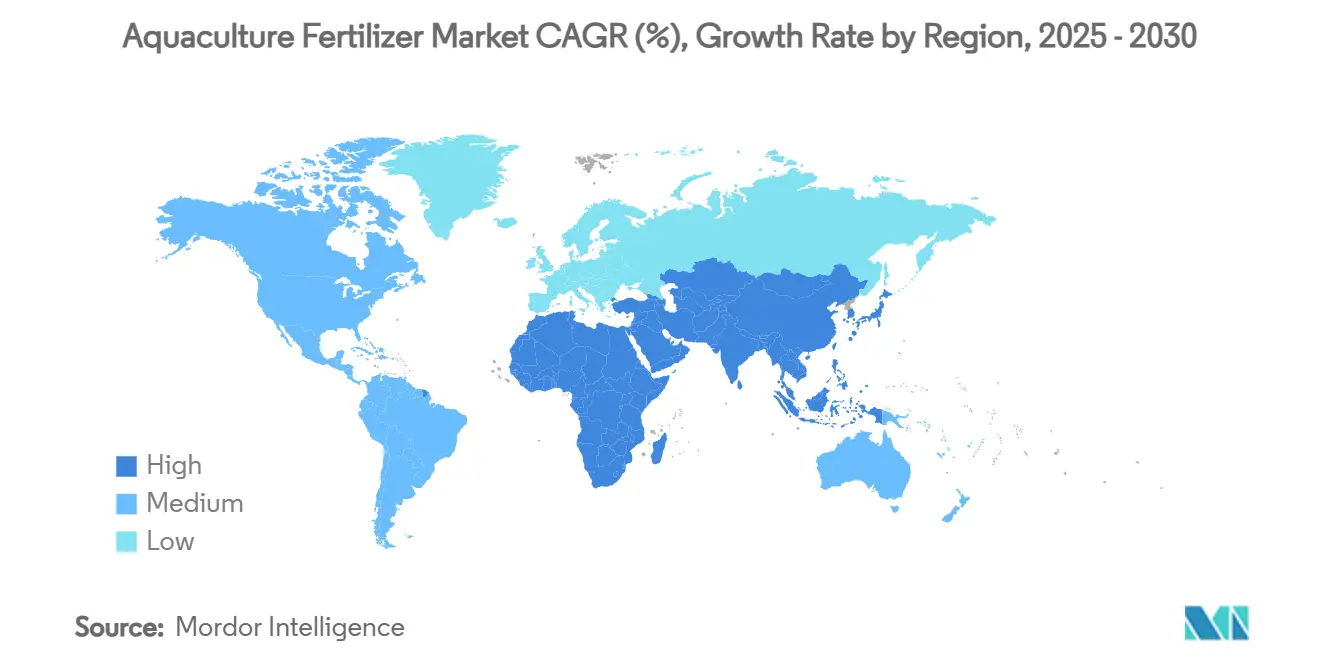
| Fastest Growing Market | Africa |
| Largest Market | Asia Pacific |
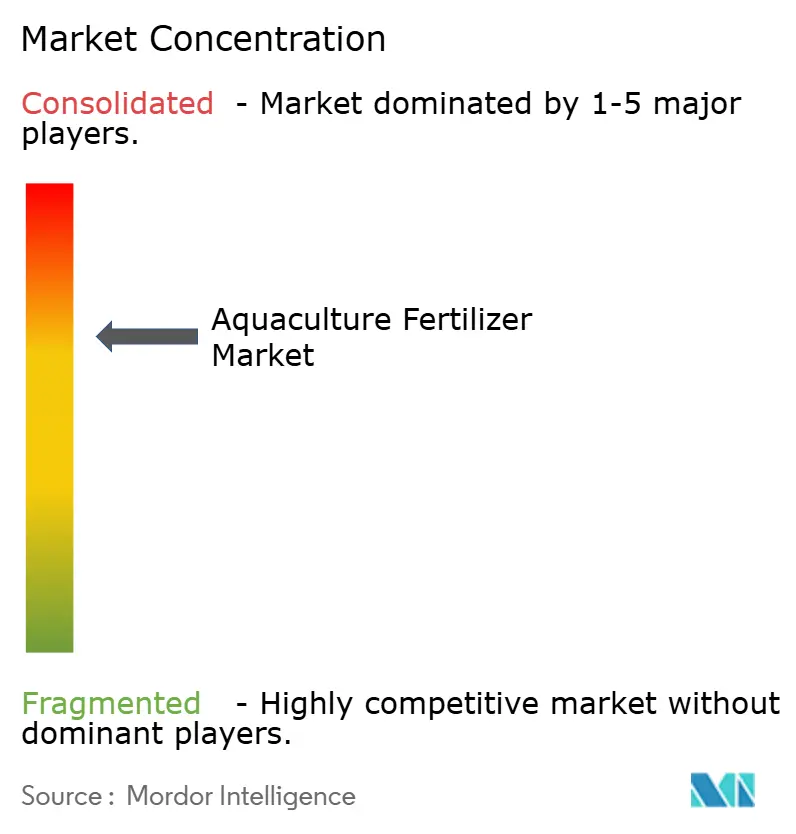
| Market Concentration | Medium |
Major Players *Disclaimer: Major Players sorted in no particular order Image © Mordor Intelligence. Reuse requires attribution under CC BY 4.0. | |
Aquaculture Fertilizer Market Analysis by Mordor Intelligence
The aquaculture fertilizer market size reached USD 3.2 billion in 2025 and is forecast to expand to USD 4.9 billion by 2030, reflecting an 8.8% CAGR. This momentum comes from rising global seafood demand, the intensification of production systems, and the need to optimize nutrient efficiency under tightening environmental regulations. Technology‐driven dosing platforms, expanding integrated multi-trophic aquaculture (IMTA), and the growing popularity of land-based recirculating aquaculture systems (RAS) all underpin robust spending on advanced fertilizers. At the same time, regulatory policies aimed at curbing eutrophication, together with volatile feed and raw-material prices, compel producers to seek products that maximize yield per unit of input while lowering nutrient discharge. The resulting dynamic fosters incremental innovation, particularly in chelated micronutrients, biofertilizers, and water-soluble formulations across every region of the aquaculture fertilizer market.
Key Report Takeaways
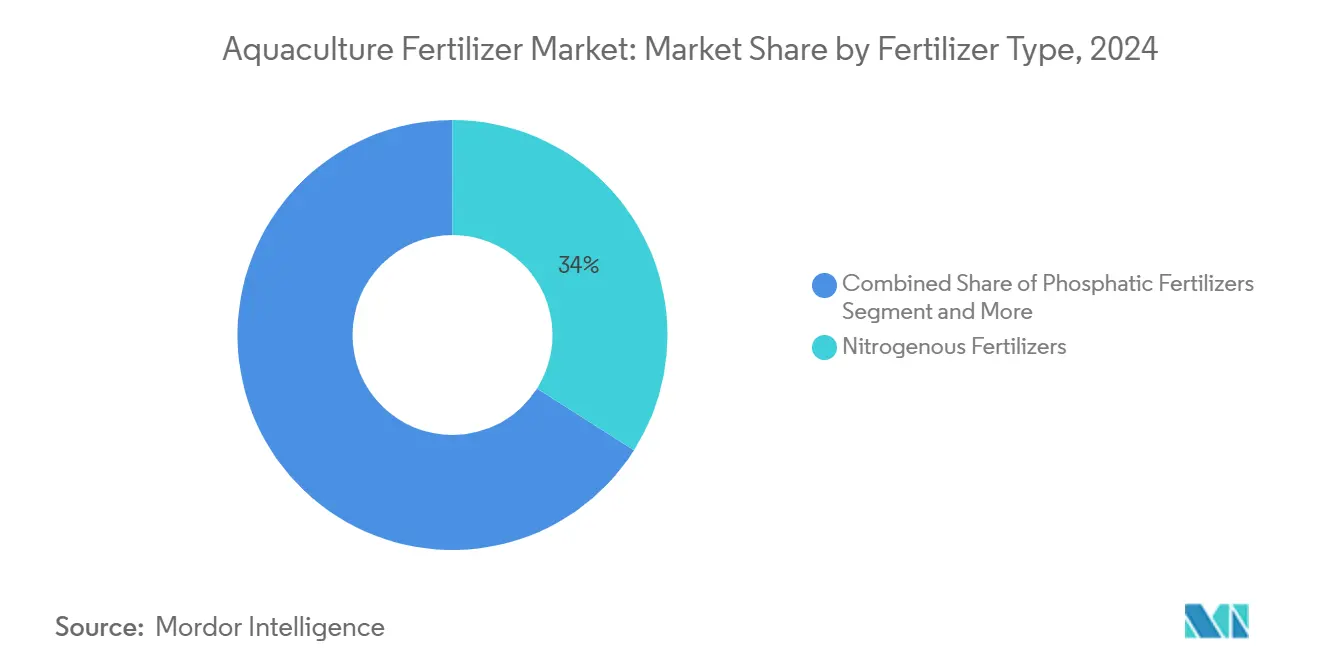
- By fertilizer type, nitrogenous products led with 34% of the aquaculture fertilizer market share in 2024, while phosphatic products are projected to expand at a 13.5% CAGR through 2030.
- By form, liquid fertilizers captured 41% of the aquaculture fertilizer market size in 2024, while water-soluble formulations are set to grow at a 15.2% CAGR to 2030.
- By cultured species, finfish accounted for a 46% share of the aquaculture fertilizer market size in 2024, while crustaceans are poised for the fastest 12.1% CAGR through 2030.
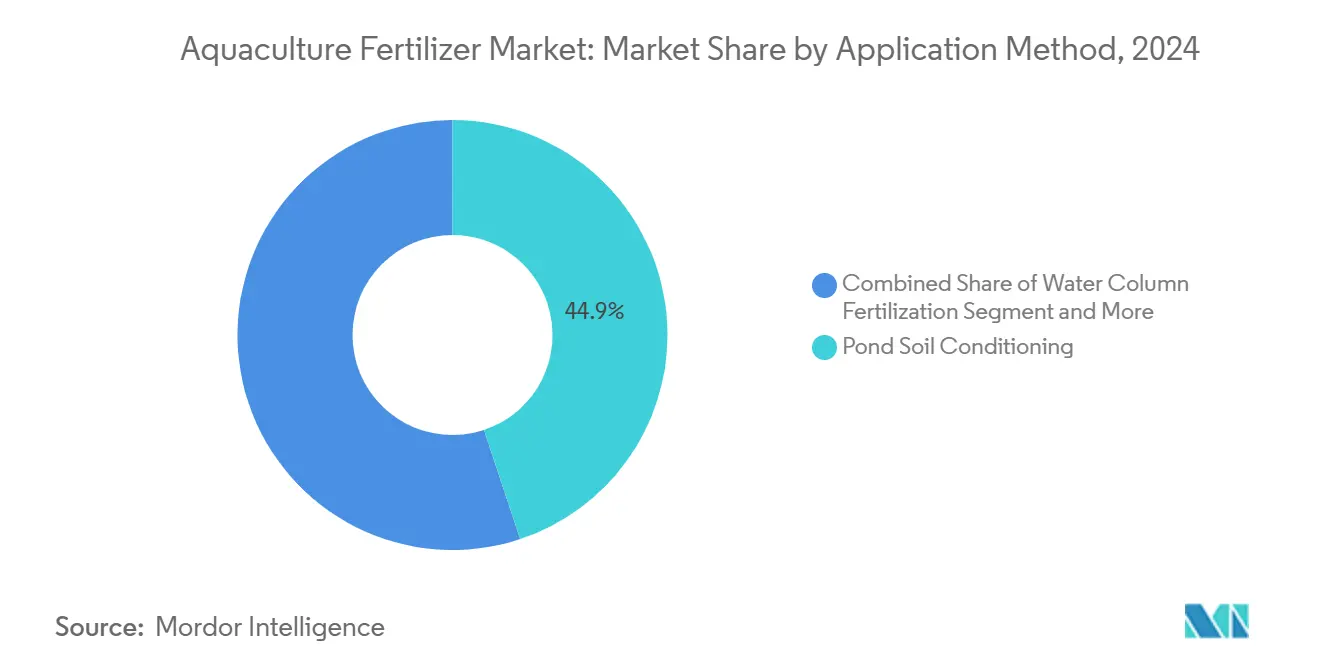
- By application method, pond soil conditioning retained 44.9% of the aquaculture fertilizer market share in 2024, whereas foliar/direct plant fertilization is forecast to post a 13.2% CAGR by 2030.
- By end-user farm size, small-scale farms held 52.1% revenue share in 2024, but large farms are on track for an 11.4% CAGR to 2030.
- By geography, Asia-Pacific led with 56% revenue share in 2024, while Africa is forecast to post the highest 11.8% CAGR through 2030.
Global Aquaculture Fertilizer Market Trends and Insights
Drivers Impact Analysis*
| Driver | (~) % Impact on CAGR Forecast | Geographic Relevance | Impact Timeline |
|---|---|---|---|
| Intensification of integrated multi-trophic aquaculture | +1.8% | Norway, Chile, China, global spill-over | Medium term (2-4 years) |
| Shift to zero-exchange biofloc systems | +1.5% | Asia-Pacific core, South America adoption | Short term (≤ 2 years) |
| Growth in seaweed cultivation for bioplastics and carbon capture | +1.2% | North America, Europe, Asia-Pacific coastal zones | Long term (≥ 4 years) |
| Policy push for antibiotic-free production favoring biofertilizers | +1.0% | European Union and North America leading | Medium term (2-4 years) |
| AI-driven nutrient-dosing platforms | +0.8% | Developed markets first, emerging regions later | Medium term (2-4 years) |
| Land-based RAS investments driving chelated micronutrient demand | +0.9% | North America, Europe, Middle East | Short term (≤ 2 years) |
| Source: Mordor Intelligence | |||
Intensification of Integrated Multi-Trophic Aquaculture (IMTA)
IMTA pairs finfish with extractive species such as kelp and mussels, allowing excess nitrogen and phosphorus to be recycled instead of being discharged. Trials in Norway have shown a monthly nitrogen removal of 9.3 g per m², reducing external fertilizer needs while creating a second revenue stream from seaweed biomass. Chile and China are scaling similar concepts to secure operating permits in ecologically sensitive zones. Fertilizer suppliers now bundle balanced N-P-K blends with trace-element additives tailored for co-cultivation, deepening product differentiation. As regulations tighten, IMTA’s closed-loop advantage is anticipated to widen its impact on fertilizer demand across major coastal markets.
Shift to Zero-Exchange Biofloc Systems
Biofloc technology maintains a 10:1–20:1 carbon-to-nitrogen ratio that converts toxic ammonia into protein-rich microbial flocs, cutting water use by up to 90%. Asian shrimp farms have embraced the model to overcome land and water constraints and to comply with discharge rules. These systems need precise carbon sources plus micronutrient cocktails to stabilize microbial communities, pushing demand for water-soluble fertilizers. Vendors are responding with premixed liquid products that include carbohydrate carriers and chelated trace metals. The technology’s rapid payback keeps adoption momentum high, especially in India, Indonesia, and Brazil.
Growth in Seaweed Cultivation for Bioplastics and Carbon Capture
Offshore seaweed acreage is increasing because kelp sequesters carbon and supports bioplastic supply chains, projected to reach USD 16.1 billion by 2033.[1]World Bank, “Seaweed as a Climate Solution,” documents.worldbank.org European initiatives target 8 million metric tons of annual seaweed output by 2030, while the United States farms in Alaska and Maine expand nursery capacity. Although seaweed needs fewer inputs than finfish, offshore lines still require pulsed nitrogen and iron dosing during peak growth. This spurs the development of specialty fertilizers packaged in slow-dissolving sachets, compatible with buoy-based drip systems. As carbon-credit programs monetize sequestration, growers are budgeting more for precision nutrient regimes.
Policy Push for Antibiotic-Free Production Favoring Biofertilizers
Seventeen top-producing nations now restrict critically important antibiotics, forcing farms to seek microbial alternatives that improve water quality and fish immunity. Biofertilizers containing probiotics and prebiotics fit this mandate and often qualify for eco-label premiums. ICL Group’s 2025 acquisition of Lavie Bio underlines supplier pivot toward biologicals. Early adopters report fewer disease outbreaks and up to 8% better feed conversion, reinforcing the economic case. Regulatory momentum suggests biofertilizers will keep expanding their share of total nutrient spending.
Restraints Impact Analysis*
| Restraint | (~) % Impact on CAGR Forecast | Geographic Relevance | Impact Timeline |
|---|---|---|---|
| Stricter eutrophication regulations | -1.5% | European Union and North America | Short term (≤ 2 years) |
| Raw-material price volatility | -1.2% | Global, higher impact on developing markets | Short term (≤ 2 years) |
| Nutrient-rich formulated feeds reducing external fertilizer need | -0.8% | Developed aquaculture clusters | Medium term (2-4 years) |
| Low farmer technical capacity in emerging nations | -0.6% | Sub-Saharan Africa, parts of Southeast Asia, and South America | Long term (≥ 4 years) |
| Source: Mordor Intelligence | |||
Stricter Eutrophication Regulations
The United States Environmental Protection Agency proposes cuts of 100 million lb of nutrient discharge annually, forcing farms to adopt precision fertilizers and closed-loop systems.[2]U.S. Environmental Protection Agency, “Effluent Limitations Guidelines,” federalregister.gov Europe’s Water Framework mirrors this push with tighter total nitrogen limits in sensitive basins. Open-water cage operators respond by switching to slow-release coatings and integrating seaweed buffers. Compliance costs elevate demand for high-efficacy products even as total application volumes flatten. Failure to meet new limits risks permit revocation, making regulatory adherence non-negotiable.
Raw-Material Price Volatility
Electrical failures trimmed Mosaic’s 2024 phosphate output by up to 110,000 metric tons, exposing fertilizer buyers to sudden price spikes. Nitrogen costs remain linked to natural-gas markets, where geopolitical tensions trigger wide swings. Small farms in Africa and Southeast Asia feel the squeeze most acutely, delaying purchases or diluting applications. Volatility drives consolidation as larger suppliers hedge inventory and offer price-lock contracts. Yet, persistent unpredictability still dampens near-term spending on premium formulations.
*Our forecasts treat driver/restraint impacts as directional, not additive. The impact forecasts reflect baseline growth, mix effects, and variable interactions.
Segment Analysis
By Fertilizer Type: Nitrogenous Dominates While Phosphatic Accelerates
Nitrogenous products retained a 34% aquaculture fertilizer market share in 2024, benefiting from their central role in protein synthesis and rapid biomass gain. The aquaculture fertilizer market size contribution from nitrogen remains anchored in high densities of finfish like tilapia and carp, where efficient nitrogen availability improves feed conversion ratios. Yet stricter discharge limits on ammonia spur interest in controlled-release coatings that reduce volatilization losses. In contrast, phosphatic fertilizers, although starting from a lower base, are projected for the fastest 13.5% CAGR through 2030 as RAS and IMTA demand precise phosphorus inputs to prevent water quality crashes. This shift nudges suppliers toward balanced N-P-K blends and buffered phosphate salts that deliver stable pH.
Compound and blended formulations gain traction among integrated operators who prefer single-product convenience that aligns with sensor-driven dosing. Organic and biofertilizers grow quickly, propelled by antibiotic-free certification schemes and consumer preference for eco-labels. Chelated micronutrients occupy a premium niche tied to large RAS tanks, where small deviations in trace elements can impair fish immunity. Early trials with purple marine-bacteria-based fertilizers containing 11% nitrogen offer a low-carbon path, and commercial rollout is likely to raise the sustainability bar across the aquaculture fertilizer market.


By Form: Liquid Leads While Water-Soluble Surges
Liquid products commanded 41% of 2024 revenue, the largest contribution to the aquaculture fertilizer market size, because they disperse uniformly and integrate seamlessly with automated injectors. Farms employing biofloc and RAS appreciate the real-time adjustability of liquids that limits nutrient spikes. Water-soluble crystals, while accounting for a smaller share, are projected to climb 15.2% CAGR as cloud-platform dosing software thrives. The aquaculture fertilizer market benefits from these formulations’ low insoluble residues, making them ideal for high-clarity tanks that monitor turbidity.
Granular and powder forms remain relevant, especially in extensive pond aquaculture, where seasonal basal dressing of pond bottoms continues. Their extended shelf life and simple logistics appeal to community cooperatives in inland Asia. Because dense granules sink quickly, they suit carp ponds that rely on benthic algae activation. Looking forward, suppliers invest in dual-use products granules coated for controlled solubility yet capable of being milled for solubility on demand bridging old and new application paradigms.
By Cultured Species: Finfish Holds Lead, Crustaceans Accelerate
Finfish contributed 46% of the 2024 aquaculture fertilizer market size, reflecting entrenched global demand for salmon, tilapia, and carp. Finfish nutrition science is well documented, enabling fertilizer vendors to fine-tune N-P-K ratios aligned with species metabolic rates. Crustaceans, led by intensive shrimp units in India and Ecuador, are forecast to outpace at a 12.1% CAGR through 2030. Zero-exchange biofloc technology underpins crustacean expansion, driving a premium for carbon sources and trace-metal chelates that sustain microbial flocs.
Mollusk segments leverage IMTA, where oysters and mussels polish water by filtering excess plankton, reducing additional fertilizer inputs, but still requiring episodic micronutrient boosts. Seaweed and algae farming, pivotal for bioplastics and carbon removal markets, demands targeted nutrient pulses during sporophytic phases and mariculture buoy-based nutrient drip systems. Companies now offer species-labelled packs that bundle nitrogen, phosphorus, and critical trace elements such as iodine for kelp, all signs of the advancing specialization within the aquaculture fertilizer market.
By Application Method: Pond Soil Conditioning Stays Central While Foliar Feeding Rises
Pond soil conditioning preserved 44.9% of the aquaculture fertilizer market share in 2024 because sediment chemistry dictates the nutrient release tempo that underpins primary productivity. Farmers apply basal lime and nitrogen-rich amendments immediately after pond drying to kickstart algal blooms. In parallel, direct water-column fertilization delivers fast phytoplankton spurts to stabilize dissolved oxygen and pH. Fine-tuning the ratio of soil conditioning versus water-column dosing is becoming data-driven as handheld spectrometers offer quick profiling.
Foliar and direct plant fertilization inside aquaponics and IMTA increases at a 13.2% CAGR, driven by urban vertical farms linking fish tanks with hydroponic greens. Leaf-surface uptake allows operators to recapture dissolved nutrients into cucumbers or leafy vegetables, monetizing waste streams. IoT sprayers sync with nutrient sensors, cutting labor costs while reducing overspray. These integrated platforms expand the total addressable value of the aquaculture fertilizer market by servicing both aquatic and terrestrial components with a single nutrient program.
By End-User Farm Size: Small Farms Dominate Today, Large Enterprises Grow Faster
Small-scale ponds under 5 hectares accounted for 52.1% revenue in 2024, reflecting the demographic weight of household farmers across Asia. Government microfinance and input vouchers channel stable liquid fertilizer demand. Yet limited cash flow and variable technical skills constrain the uptake of premium chelated products, keeping average revenue per hectare modest. Medium-scale farms between 5 and 50 hectares adopt innovations such as solar-powered paddle wheels and pH sensors, acting as a technology bridge.
Large complexes above 50 hectares, often vertically integrated with hatcheries and processing, are on track for an 11.4% CAGR to 2030. Their scale enables tender-based fertilizer procurement, early adoption of AI dosing, and in-house Research and Development for site-specific blends. As consolidation accelerates, suppliers increasingly tailor service contracts, bundling software licenses, water tests, and nutrient deliveries, reinforcing a premium tier within the aquaculture fertilizer market.
Geography Analysis
Asia-Pacific held a dominant 56% aquaculture fertilizer market share in 2024, reflecting China's large carp ponds and India's fast-growing shrimp clusters. Chinese regulators now fund improved broodstock and low-fishmeal feeds to curb disease and boost nutrient efficiency. Indian demand remains strong as exporters secure traceable inputs and digital water-quality tools. Warm climates, established supply chains, and government credit lines all reinforce steady purchasing of nitrogenous and blended formulations. Companies also roll out IoT sensors that sync with liquid dosing pumps, widening the regional aquaculture fertilizer market.
Africa stands out as the fastest-expanding region with an 11.8% CAGR projected to 2030. Governments view tilapia, catfish, and marine species as solutions to protein gaps and rural jobs. Egypt anchors the continent with large-scale pond networks, while South Africa pilots offshore cages and biosecure hatcheries. Abundant inland water and rising consumer spending encourage private hatcheries to trial water-soluble fertilizers and probiotics. Challenges persist, including limited cold-chain logistics and spotty technical training, opening room for multinational suppliers to set up local blending hubs.
Europe shows mature demand shaped by strict nutrient caps, high-tech salmon farms, and ambitious seaweed targets of 8 million metric tons by 2030. Norway’s strategy favors offshore platforms and IMTA, increasing the need for chelated micronutrients and slow-release phosphorus products. Producers must document every kilogram of nutrient applied, which accelerates the uptake of precision application software. North America maintains steady growth as federal agencies clear offshore Aquaculture Opportunity Areas and land-based RAS projects secure financing.[3]NOAA, “Aquaculture Opportunity Areas,” noaa.gov United States and Canadian farms favor data-driven dosing that cuts discharge while securing certifications, further enlarging the regional aquaculture fertilizer market size.

Competitive Landscape
The aquaculture fertilizer market remains moderately consolidated, with the five largest players together accounting for of global revenue. This distribution leaves more than half the market in the hands of regional and niche players, sustaining competitive tension and encouraging innovation. Scale advantages in logistics, Research and Development, and digital farming solutions allow the leading group to set quality and sustainability benchmarks that smaller firms often follow. At the same time, open room for specialization keeps entry barriers manageable for companies offering biofertilizers, chelated micronutrients, and precision-dosing platforms.
Mergers and Acquisitions reshape the field. Merck Animal Health finalized its acquisition of Elanco’s aqua business in February 2025, strengthening vertical integration from health aids to nutrition. ICL Group expanded its biologicals reach through Lavie Bio activities in July 2025, targeting microbial products compatible with antibiotic-free labeling. Koch’s USD 3.6 billion Iowa nitrogen plant purchase lifts North American production to 3.5 million metric tons, ensuring supply security for large RAS projects.
Start-ups also carve niches. SINTEF’s algae-driven ammonia-to-fertilizer method offers circular-economy appeal. Agriloops’ EUR 13 million (USD 14.3 million) funding to scale saltwater aquaponics shows investor appetite for integrated approaches. Collectively, these moves suggest rising technology barriers that will likely nudge smaller regional blenders toward strategic alliances or exit over the forecast horizon.
Aquaculture Fertilizer Industry Leaders
Yara International ASA
The Mosaic Company
Nutrien Ltd.
ICL Group Ltd.
Haifa Negev technologies Ltd.
- *Disclaimer: Major Players sorted in no particular order

Recent Industry Developments
- December 2024: ICAR-CIBA has established a partnership with Agrocel Industries through a memorandum of understanding to evaluate AQUALAABH, a mineral mix derived from seawater. The research aims to improve productivity and sustainability in shrimp farming operations.
- July 2024: Merck Animal Health completed the acquisition of Elanco’s aqua unit to reinforce its integrated nutrition and health portfolios. This strategic move enhances Merck’s footprint in aquatic animal health and sustainability by integrating Elanco’s innovations with Merck’s global Research and Development expertise and commercial reach. The increased use of water supplements and nutrient inputs in farmed fish systems could drive complementary demand for pond fertilizers that support plankton growth and optimize water quality.
- March 2024: EuroChem has opened a phosphate fertilizer complex in Serra do Salitre, Minas Gerais, Brazil, with an investment of USD 1 billion and an annual production capacity of 1 million metric tons. The higher domestic availability of phosphate fertilizers may support aquaculture fertilizer demand by reducing nutrient competition and allowing specialized formulations for aquatic systems.


Global Aquaculture Fertilizer Market Report Scope
| Nitrogenous Fertilizers |
| Phosphatic Fertilizers |
| Potassic Fertilizers |
| Compound/Blended Fertilizers |
| Organic/Bio-fertilizers |
| Chelated Micronutrient Fertilizers |
| Solid - Granular |
| Solid - Powder |
| Liquid |
| Water-Soluble |
| Finfish |
| Crustaceans |
| Mollusks |
| Seaweed and Algae |
| Pond Soil Conditioning |
| Water Column Fertilization |
| Foliar/Direct Plant Fertilization in Integrated Systems |
| Small-Scale Farms (Less than 5 ha) |
| Medium-Scale Farms (5 to 50 ha) |
| Large-Scale Enterprises (More than 50 ha) |
| North America | United States |
| Canada | |
| Rest of North America | |
| South America | Brazil |
| Argentina | |
| Rest of South America | |
| Europe | Germany |
| United Kingdom | |
| France | |
| Italy | |
| Spain | |
| Russia | |
| Rest of Europe | |
| Asia-Pacific | China |
| India | |
| Japan | |
| South Korea | |
| Australia and New Zealand | |
| Rest of Asia-Pacific | |
| Middle East | Saudi Arabia |
| Turkey | |
| Rest of Middle East | |
| Africa | South Africa |
| Egypt | |
| Rest of Africa |
| By Fertilizer Type | Nitrogenous Fertilizers | |
| Phosphatic Fertilizers | ||
| Potassic Fertilizers | ||
| Compound/Blended Fertilizers | ||
| Organic/Bio-fertilizers | ||
| Chelated Micronutrient Fertilizers | ||
| By Form | Solid - Granular | |
| Solid - Powder | ||
| Liquid | ||
| Water-Soluble | ||
| By Cultured Species | Finfish | |
| Crustaceans | ||
| Mollusks | ||
| Seaweed and Algae | ||
| By Application Method | Pond Soil Conditioning | |
| Water Column Fertilization | ||
| Foliar/Direct Plant Fertilization in Integrated Systems | ||
| By End-User Farm Size | Small-Scale Farms (Less than 5 ha) | |
| Medium-Scale Farms (5 to 50 ha) | ||
| Large-Scale Enterprises (More than 50 ha) | ||
| By Geography | North America | United States |
| Canada | ||
| Rest of North America | ||
| South America | Brazil | |
| Argentina | ||
| Rest of South America | ||
| Europe | Germany | |
| United Kingdom | ||
| France | ||
| Italy | ||
| Spain | ||
| Russia | ||
| Rest of Europe | ||
| Asia-Pacific | China | |
| India | ||
| Japan | ||
| South Korea | ||
| Australia and New Zealand | ||
| Rest of Asia-Pacific | ||
| Middle East | Saudi Arabia | |
| Turkey | ||
| Rest of Middle East | ||
| Africa | South Africa | |
| Egypt | ||
| Rest of Africa | ||


Key Questions Answered in the Report
What is the current value of the aquaculture fertilizer market and forecasted market size?
The aquaculture fertilizer market size reached USD 3.2 billion in 2025 and is projected to hit USD 4.9 billion by 2030.
Which fertilizer type is growing fastest in aquaculture?
Phosphatic fertilizers are projected to record a 13.5% CAGR to 2030 due to their role in precision phosphorus management in RAS operations.
Why are water-soluble fertilizers gaining popularity?
They dissolve instantly, work well with automated injectors, and support real-time nutrient adjustments, driving a 15.2% CAGR through 2030.
How do regulations affect fertilizer demand in aquaculture?
Stricter nutrient discharge rules push farms toward precision dosing tools and biofertilizers, moderating volume growth but raising value per unit.
Page last updated on:


