Shea Butter Market Size and Share
Market Overview
| Study Period | 2021 - 2031 |
|---|---|
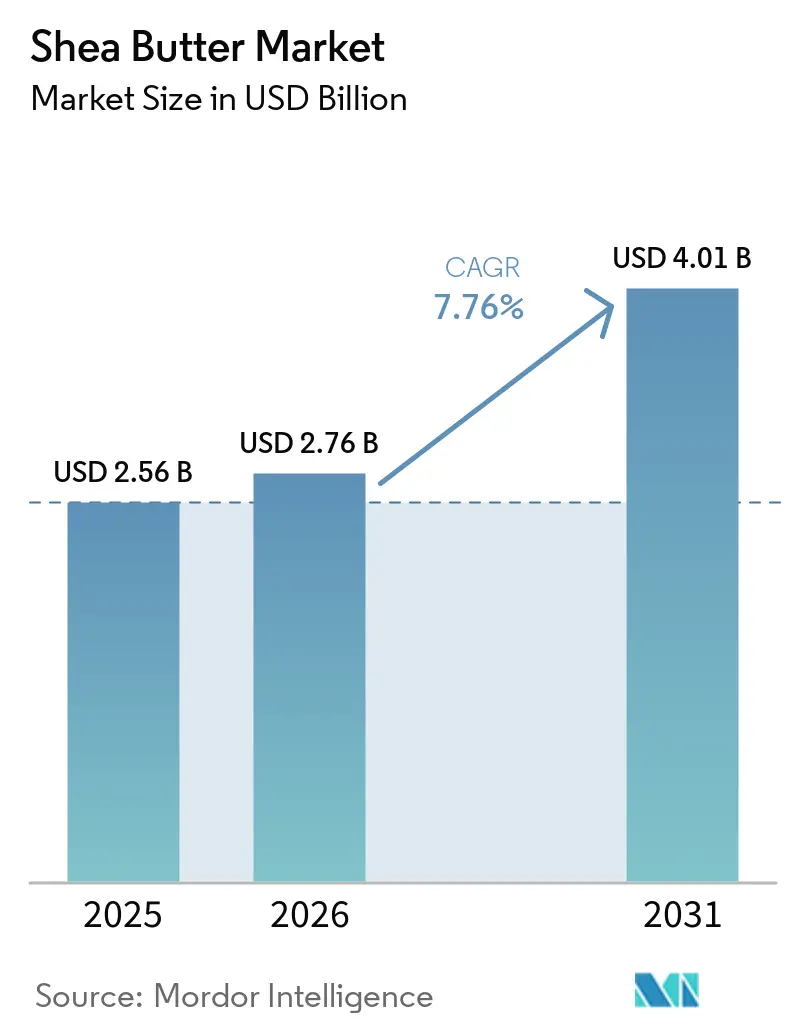
| Market Size (2026) | USD 2.76 Billion |
| Market Size (2031) | USD 4.01 Billion |
| Growth Rate (2026 - 2031) | 7.76% CAGR |
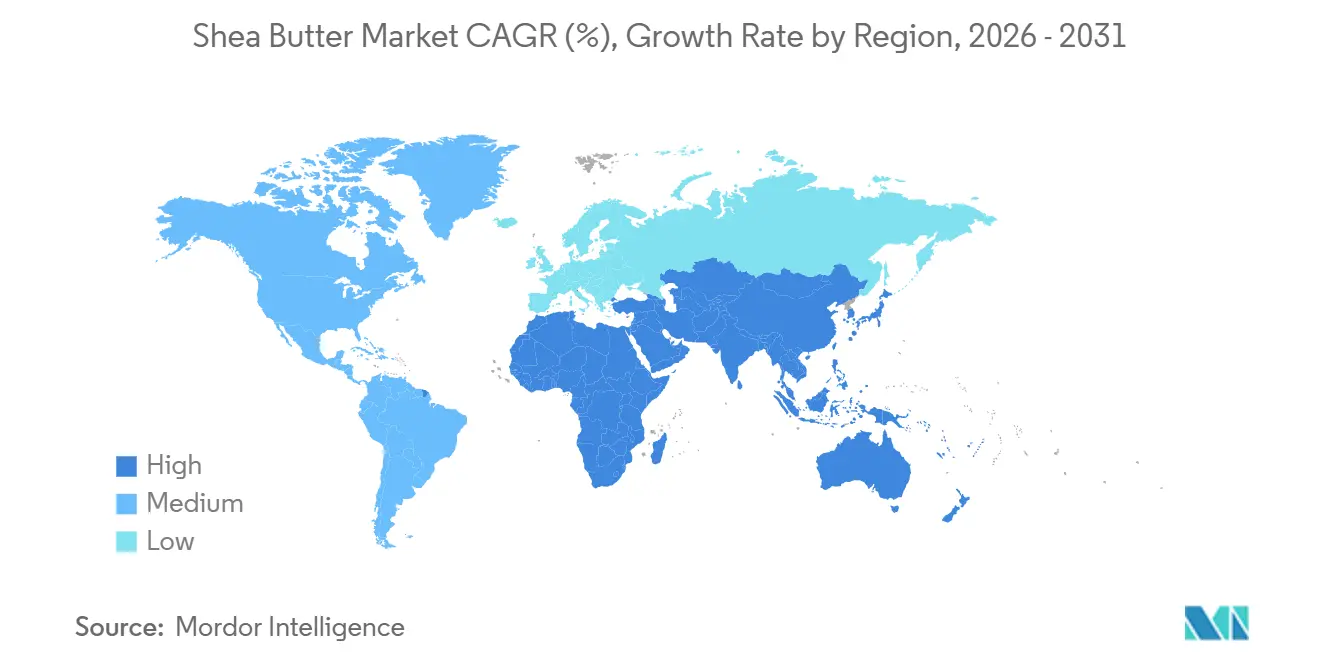
| Fastest Growing Market | Asia Pacific |
| Largest Market | Europe |
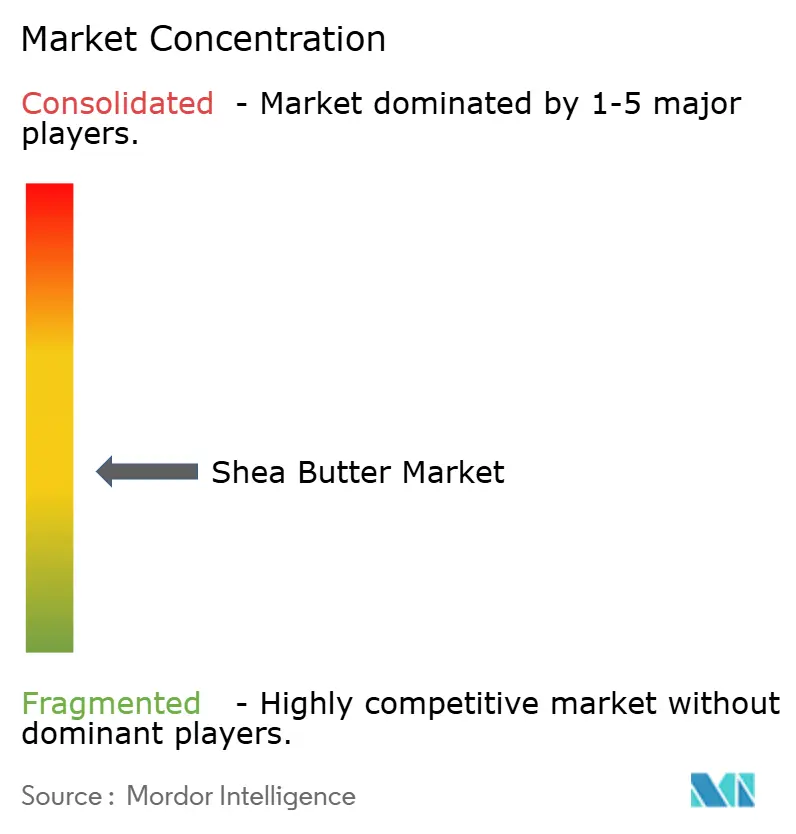
| Market Concentration | Medium |
Major Players
*Disclaimer: Major Players sorted in no particular order Image © Mordor Intelligence. Reuse requires attribution under CC BY 4.0. |
|
Shea Butter Market Analysis by Mordor Intelligence
The Shea butter market size is projected to expand from USD 2.56 billion in 2025 and USD 2.76 billion in 2026 to USD 4.01 billion by 2031, registering a 7.76% CAGR between 2026 and 2031. Demand is shifting from raw-kernel exports toward value-added butters and fractions as West African governments tighten export rules and global brands pledge transparent sourcing. Clean-label personal-care trends and food formulators’ need for cocoa-butter alternatives are strengthening the Shea butter market, while FDA and EFSA approvals remove regulatory barriers in North America and Europe. Asia-Pacific demand is accelerating as China and India adopt plant-based cosmetics and begin to permit shea-based cocoa-butter equivalents. At the same time, fractionation technology, blockchain traceability, and biomass energy systems are helping processors offer consistent quality and lower carbon footprints.
Key Report Takeaways
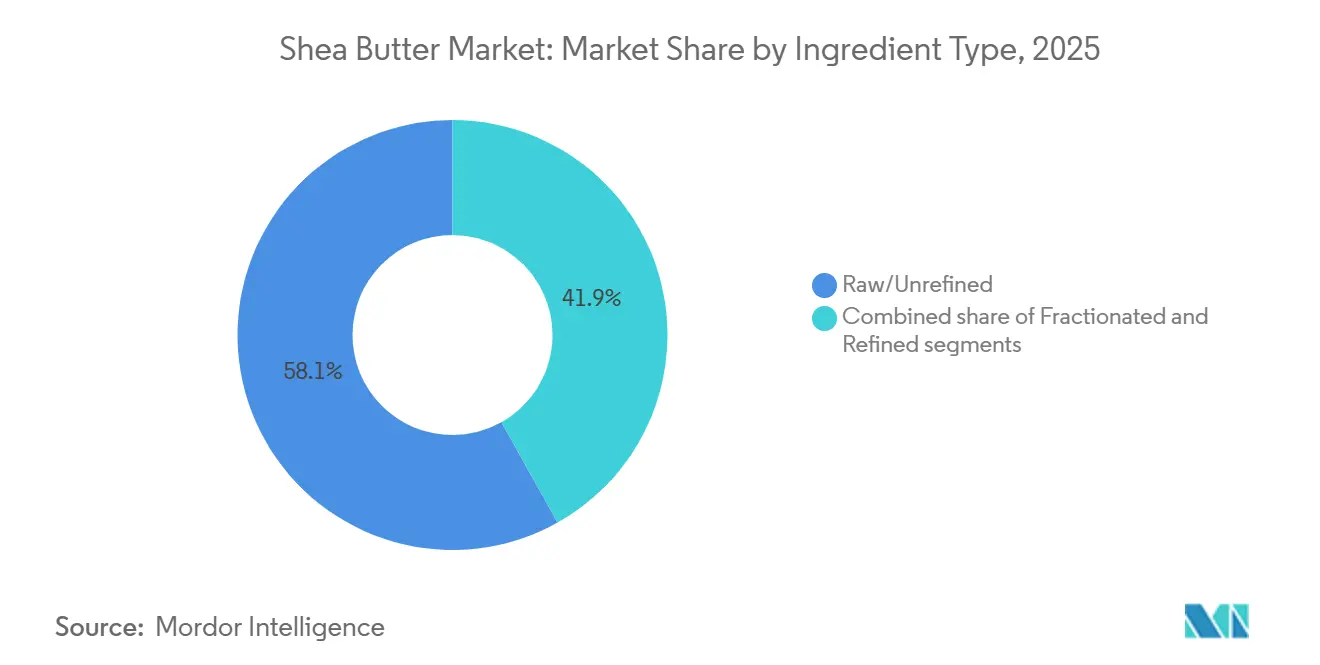
- By ingredient type, raw or unrefined shea commanded 58.13% of 2025 revenue, while fractionated formats are advancing at an 8.44% CAGR through 2031.
- By application, personal-care held 40.78% of the 2025 volume, whereas food and beverage is expanding at an 8.12% CAGR to 2031.
- By geography, Europe led with 33.91% revenue share in 2025, and Asia-Pacific is forecast to grow at 7.76% CAGR between 2026 and 2031.
Note: Market size and forecast figures in this report are generated using Mordor Intelligence’s proprietary estimation framework, updated with the latest available data and insights as of January 2026.
Global Shea Butter Market Trends and Insights
Drivers Impact Analysis*
| Driver | (~) % Impact on CAGR Forecasts | Geographic Relevance | Impact Timeline |
|---|---|---|---|
| Rising demand for clean-label, organic, and plant-based personal care ingredients | +2.1% | Global, concentrated in North America and European Union | Medium term (2-4 years) |
| Expanding application as a functional lipid and cocoa butter alternative in food formulations | +1.8% | Global, Asia-Pacific acceleration in China, India, Japan | Medium term (2-4 years) |
| GRAS/FDA approvals supporting broader food applications in the United States and European Union | +1.3% | North America and European Union | Short term (≤ 2 years) |
| Growing consumer awareness of therapeutic and nutritional benefits | +0.9% | Global, early traction in Asia-Pacific and North America | Long term (≥ 4 years) |
| Increasing preference for sustainably sourced and fair-trade ingredients | +1.2% | European Union core, spill-over to North America and Asia-Pacific | Medium term (2-4 years) |
| Advancements in processing technologies improving yield and quality consistency | +0.8% | West Africa production hubs (Ghana, Burkina Faso, Nigeria) | Long term (≥ 4 years) |
| Source: Mordor Intelligence | |||
Rising demand for clean-label, organic, and plant-based personal care ingredients
Consumer demand for clean-label, organic, and plant-based personal care ingredients is reshaping product development strategies, with shea butter emerging as a key component in skincare and haircare formulations. The growing preference for transparency and naturally derived ingredients is driving brands to replace synthetic chemicals with minimally processed alternatives like shea butter, which aligns with clean-label expectations. Its plant-based origin also supports the expanding vegan and cruelty-free beauty movement, making it a versatile ingredient across premium and mass-market product lines. Data from the National Sanitation Foundation in 2024 indicates that 74% of consumers prioritize organic ingredients in personal care products, underscoring the impact of consumer preferences on procurement and formulation decisions [1]Source: National Sanitation Foundation (NSF), "74% of Consumers Consider Organic Ingredients Important in Personal Care Products," nsf.org . This trend has led manufacturers to emphasize traceability and ethical sourcing, particularly from West African supply chains, where shea butter production is concentrated. Suppliers such as AAK AB and Ghana Nuts Company Limited are responding by enhancing their portfolios with certified organic and fair-trade shea butter to meet evolving market demands. Additionally, the convergence of clean beauty trends, sustainability requirements, and regulatory pressures is driving the adoption of multifunctional natural ingredients, with shea butter’s moisturizing and skin barrier-repair properties offering added value. Indie and direct-to-consumer brands are further amplifying demand by leveraging clean-label claims as a competitive advantage, solidifying shea butter’s role in the global personal care market.
GRAS/FDA approvals supporting broader food applications in the United States and European Union
Recent regulatory approvals in the United States and European Union are significantly influencing the adoption of shea butter in food manufacturing by addressing long-standing regulatory challenges. The U.S. FDA’s Generally Recognized as Safe (GRAS) determinations for shea olein (GRN 850, 2020) and shea stearin (GRN 1116, 2024) have enabled their inclusion in products such as baked goods, confectionery coatings, and dairy alternatives, with usage levels permitted up to a minimum 10% of total fat content [2]Source: Food and Drug Administration (FDA), "GRAS Notice GRN 1116 Agency Response Letter," fda.gov. This development aligns with the food industry’s pursuit of cost-efficient and functionally comparable alternatives to cocoa butter, particularly in response to volatile cocoa prices and supply constraints. Similarly, the European Food Safety Authority’s 2024 re-evaluation under Regulation (EC) No 258/97 has reaffirmed the safety of shea butter and extended its application to high-regulation categories, including infant formula and medical nutrition. These advancements are fostering confidence among manufacturers and driving investments in research and development for shea-based formulations across indulgent and functional food categories. Suppliers such as Bunge Loders Croklaan expanded their shea ingredient portfolios to meet growing demand, while regulatory alignment between the U.S. and EU is facilitating smoother cross-border trade and harmonizing standards for multinational producers. Enhanced traceability and quality assurance requirements are further encouraging standardized and compliant supply chains, positioning shea butter as a versatile and regulation-backed ingredient in the food industry.
Growing consumer awareness of therapeutic and nutritional benefits
Sustained consumer interest in the therapeutic and nutritional properties of shea butter is driving its evolution from a conventional cosmetic ingredient to a key component in dermatological and nutraceutical applications. This transformation is underpinned by its unsaponifiable fraction, which contains bioactive compounds such as lupeol, α-amyrin, and β-amyrin, recognized for their anti-inflammatory and wound-healing capabilities. Scientific validation, including a 2024 review in the Journal of Cosmetic Dermatology, has reinforced shea butter’s efficacy in addressing conditions like atopic dermatitis and photoaging, attributing these benefits to triterpene alcohols that inhibit cyclooxygenase-2 and reduce skin inflammation. Such findings are prompting formulators to reposition shea butter as an active therapeutic ingredient in dermocosmetics and medicated skincare. Furthermore, pharmaceutical-grade shea extracts are being utilized in advanced wound-care products, aligning with protocols for diabetic ulcers and post-surgical recovery by promoting collagen synthesis and skin barrier repair. While regulatory frameworks for medical applications remain inconsistent, ongoing research is gradually fostering acceptance. In parallel, nutraceutical applications are gaining traction, particularly in Japan and South Korea, where oral shea supplements are marketed for joint health. Suppliers like Sophim are responding to these trends by developing high-purity shea unsaponifiables for pharmaceutical and cosmetic use, further expanding their value chain and market potential.
Increasing preference for sustainably sourced and fair-trade ingredients
Sustainably sourced and fair-trade ingredients are increasingly influencing purchasing decisions, driven by heightened environmental and social awareness among consumers and businesses. In Europe, for instance, 51% of consumers in 2024 prioritized environmentally sustainable food, as reported by Südzucker, underscoring the growing importance of sustainability in ingredient sourcing [3]Source: Südzucker AG, "Südzucker Sweet Trends Report 2024," suedzucker.com. Shea butter, predominantly wild-harvested in Africa’s "shea belt," is well-positioned to meet this demand due to its sustainable production process compared to plantation-based oils like palm oil. Fair-trade certification further enhances its appeal by ensuring equitable income distribution and improved working conditions, particularly for women-led cooperatives involved in its collection and processing. This shift toward ethical sourcing is prompting buyers to adopt certified supply chains that emphasize traceability, transparency, and ESG compliance. Companies such as Savannah Fruits Company are responding by offering organic and Fairtrade-certified shea butter to meet European market expectations. Additionally, concerns over deforestation and climate change are driving investments in reforestation and responsible harvesting practices, ensuring long-term supply chain resilience. As brands increasingly replace controversial ingredients like palm oil with sustainable alternatives, shea butter is gaining traction across food and personal care applications. The alignment of consumer demand, regulatory pressures, and corporate sustainability goals continues to strengthen shea butter’s position as a preferred ethical ingredient globally.
Restraints Impact Analysis*
| Restraint | (~) % Impact on CAGR Forecasts | Geographic Relevance | Impact Timeline |
|---|---|---|---|
| Volatility in shea nut supply due to climatic and seasonal dependencies | -1.4% | West Africa (Ghana, Burkina Faso, Nigeria, Mali, Côte d'Ivoire) | Short term (≤ 2 years) |
| Quality inconsistency and adulteration risks in unrefined supply chains | -0.9% | Global, acute in unregulated West African export channels | Medium term (2-4 years) |
| High price sensitivity among industrial and B2B buyers | -0.7% | Global, concentrated in Asia-Pacific and emerging markets | Medium term (2-4 years) |
| Intense competition from alternative natural butters and oils | -0.8% | Global, particularly North America, European Union, and Asia-Pacific | Long term (≥ 4 years) |
| Source: Mordor Intelligence | |||
Volatility in shea nut supply due to climatic and seasonal dependencies
The shea butter market faces significant challenges due to the volatility in shea nut supply, which is heavily influenced by climatic and seasonal factors. Production depends largely on wild-grown shea trees in West Africa, with limited potential for controlled cultivation. Irregular rainfall patterns, prolonged dry periods, and seasonal harvesting cycles directly impact nut yields, causing fluctuations in raw material availability and pricing. Policy disruptions further compound these issues, as demonstrated by Nigeria’s extension of its one-year export ban through February 2027, announced in February 2026, which removed an estimated 350,000–500,000 tonnes of annual nut supply, nearly 40% of global output, as per the African Trade Chamber. This supply contraction has forced international buyers to seek alternative sources in countries like Ghana, Burkina Faso, and Côte d’Ivoire, where prior export restrictions in 2024–2025 had already tightened supply, creating additional procurement challenges. Manufacturers reliant on consistent volumes for large-scale food and personal care production are grappling with increased input cost volatility and supply chain uncertainty. Companies are diversifying sourcing strategies and forming origin-specific partnerships to address these challenges, though such transitions involve logistical complexities and time. B2B players like IOI Loders Croklaan are expanding multi-origin sourcing networks to mitigate regional risks, but the reliance on climate-sensitive and geographically concentrated production continues to limit the effectiveness of these strategies, impacting long-term pricing and inventory planning.
Quality inconsistency and adulteration risks in unrefined supply chains
Quality inconsistency and adulteration risks in unrefined supply chains present significant challenges for the shea butter industry, largely due to the fragmented and semi-formal sourcing practices prevalent in West Africa. The quality of unrefined shea butter is highly variable, influenced by factors such as collection methods, storage conditions, and processing techniques. For instance, free fatty acid (FFA) levels can range from 2% in freshly processed material to over 15% in poorly stored or aged batches, directly impacting product stability, odor, and suitability for use in cosmetic and food formulations. This variability complicates large-scale manufacturing processes, as standardized inputs are essential to maintain product efficacy and shelf life, often resulting in batch rejections and increased quality testing expenses. Furthermore, the risk of adulteration with cheaper fats or oils in informal supply chains undermines trust and traceability, particularly for international buyers with stringent compliance requirements. As demand grows for premium, clean-label, and clinically effective products, the need for high-purity and consistent raw materials has become critical. Manufacturers are increasingly opting for refined or certified shea butter variants to address these issues, despite the higher costs impacting profit margins. Suppliers like Olam Food Ingredients are investing in integrated sourcing networks and quality control systems to enhance traceability and reduce variability, but achieving uniform quality at scale remains a complex challenge due to the reliance on seasonal, smallholder-driven supply chains.
*Our forecasts treat driver/restraint impacts as directional, not additive. The impact forecasts reflect baseline growth, mix effects, and variable interactions.
Segment Analysis
By Ingredient Type: Fractionation Unlocks Premium Applications
Raw/unrefined shea butter accounted for the largest share of the market in 2025, contributing 58.13% of revenue. Its dominance is attributed to its traditional and artisanal usage base, which remains significant in premium natural and organic cosmetics. The high unsaponifiable content of raw shea butter, up to 17% compared to 3–5% in refined variants, supports claims of bioactivity and minimal processing, appealing to consumers seeking natural and organic formulations. At the same time, refined shea butter continues to serve mid-tier cosmetic and personal care brands that prioritize standardized color, odor, and fatty acid composition at a lower cost. This segment is particularly benefiting from rising demand in Asia-Pacific markets, where cost-effective formulations that meet baseline safety and efficacy standards are in high demand.
Fractionated shea butter derivatives, such as stearin and olein, are emerging as the fastest-growing segment, projected to expand at a CAGR of 8.44% from 2026 to 2031. Industrial buyers are increasingly shifting toward these derivatives due to their precise melting profiles, improved stability, and formulation consistency, which align with evolving application needs in food and cosmetics. Regulatory developments, such as AAK AB’s GRAS approval (GRN 1116) for shea stearin in 2024, and product innovations like Bunge Limited’s Coberine 206, which extends chocolate shelf life, are further accelerating this transition. These advancements position fractionated shea derivatives as scalable, high-performance solutions for industrial applications, while enabling targeted product development across diverse end-use categories.


By Application: Food Formulations Outpace Cosmetics Growth
In 2025, the personal care and cosmetics segment accounted for the largest share of the shea butter market, representing 40.78% of total demand. This segment remains robust, particularly in premium natural beauty categories where demand for organic, minimally processed, and bioactive ingredients is high. Growth is concentrated in high-value areas such as clean-label skincare and dermocosmetics, rather than mass-market products. Additionally, pharmaceutical and nutraceutical applications are emerging as niche but promising segments. In regions like Japan and South Korea, oral shea unsaponifiable supplements are marketed for joint health, leveraging their anti-inflammatory properties validated in topical dermatology. Industrial applications, including bio-lubricants, candles, and soap bases, provide market stability by absorbing lower-grade outputs and surplus production, ensuring balance during fluctuations in cosmetic demand. This diversified application base reduces reliance on a single end-use sector and enhances supply chain resilience.
Food and beverage applications are gaining momentum, projected to grow at a CAGR of 8.12% through 2031. This growth is driven by regulatory approvals, cocoa price volatility, and increasing consumer preference for deforestation-free fats. Manufacturers are actively seeking sustainable and cost-effective alternatives to cocoa butter, particularly in confectionery and bakery products, without compromising functionality. Regulatory clarity in key markets is lowering entry barriers, enabling formulators to integrate shea-based ingredients into mainstream food applications. Sustainability concerns are also encouraging multinational food companies to adopt ingredients like shea butter, which are not directly linked to large-scale deforestation. Supporting this trend, B2B players such as 3F Industries Ltd are expanding their shea-based specialty fats portfolio for chocolate and confectionery applications. These developments are gradually shifting the application mix toward food-led growth while strengthening shea butter’s position as a multifunctional ingredient across industries.

Geography Analysis
Europe holds the largest share of the global shea butter market, accounting for 33.91% of demand in 2025. This dominance is attributed to stringent regulatory frameworks that prioritize traceability and sustainability. Policies such as the EU Deforestation Regulation and the Corporate Sustainability Due Diligence Directive, effective December 2024, mandate importers to ensure full supply chain transparency, including plot-level traceability and verification of deforestation-free sourcing. These measures align with growing consumer demand for ethical and environmentally responsible products, particularly in premium personal care and cosmetics. Germany, France, and the United Kingdom lead imports, driven by multinational cosmetic companies like L'Oréal, Beiersdorf, and Clarins, which rely on certified shea butter for high-quality formulations. Additionally, Italy and Spain are emerging as key players in shea-based food applications, leveraging regulatory approvals to incorporate shea stearin into confectionery and bakery products that meet clean-label standards. Conversely, Russia shows modest demand due to limited consumer awareness and lower penetration of premium natural personal care products.
The Asia-Pacific region is the fastest-growing market, projected to expand at a CAGR of 7.76% from 2026 to 2031. This growth is fueled by rising disposable incomes and increasing adoption of clean beauty and functional ingredients. China and India are experiencing robust growth in plant-based and natural personal care products, supported by regulatory developments such as China’s 2021 approval of cocoa butter equivalents containing shea, which has broadened food applications. Innovation in specialty fats is also driving adoption, with companies like Bunge Limited introducing products such as Coberine 206 to address challenges in chocolate stability under warm climatic conditions. Japan and South Korea are emerging as niche markets for nutraceutical applications, particularly shea unsaponifiable supplements for joint health. In Australia, demand is driven by clean-label and ethically sourced cosmetics, with retailers emphasizing fair-trade and sustainability certifications that resonate with environmentally conscious consumers.
North America represents a significant market, supported by favorable regulatory frameworks and strong consumer preference for clean-label and plant-based products. The U.S. Food and Drug Administration’s GRAS approvals for shea olein and stearin have expanded their use across confectionery, bakery, and dairy-alternative segments. The United States leads regional consumption, with brands increasingly focusing on traceability and ethical sourcing, often collaborating with structured supply chains such as AAK AB’s Kolo Nafaso program. Canada and Mexico, while smaller markets, are witnessing steady growth in natural cosmetics and sustainability-driven product lines. In South America, Brazil and Argentina are gradually adopting premium personal care products, though challenges such as import costs and limited awareness persist. In the Middle East and Africa, markets like South Africa and the United Arab Emirates are key importers of refined shea for food and cosmetics. Producing nations, including Ghana, Burkina Faso, Nigeria, Mali, and Côte d'Ivoire, are increasingly focusing on value-added processing, supported by export restrictions and development finance initiatives aimed at strengthening local industry participation.

Competitive Landscape
The global shea butter market is moderately fragmented, with large multinational ingredient companies competing alongside specialized and vertically integrated processors. Companies such as AAK AB, Cargill, Bunge Limited, and Fuji Oil Holdings Inc. are well-positioned to meet the diverse application needs across food, cosmetics, and industrial sectors. Their global sourcing capabilities, robust quality assurance systems, and investments in regulatory compliance and product innovation enable them to cater to large consumer goods manufacturers seeking consistent and standardized shea ingredients. These players also focus on expanding their product lines to include fractionated and application-specific shea derivatives, targeting high-demand segments such as confectionery, personal care, and specialty fats.
Vertically integrated West African processors, including OLVEA and Savannah Fruits Company, maintain a strong foothold in the market by controlling significant portions of the upstream value chain, from nut collection to processing. This integration enhances traceability to source communities, aligning with the increasing demand for ethically sourced and sustainable ingredients, particularly in Europe and North America. These regional processors are agile in offering certified organic or fair-trade shea butter variants and are deeply embedded in local economies, supporting women-led cooperatives and ensuring a steady supply despite seasonal fluctuations. Their localized control allows them to respond quickly to evolving quality requirements and sustainability mandates, which are shaping procurement strategies among multinational buyers.
The competitive dynamics between multinational companies and regional processors drive differentiation through value-added offerings, traceability, and performance attributes. While multinational players emphasize product innovation and regulatory compliance, West African processors focus on origin-linked branding and community-impact narratives. This interplay provides formulators with a broader range of shea ingredient options, enabling tailored solutions for diverse end-use applications. As regulatory pressures, sustainability expectations, and performance standards continue to rise, competition increasingly centers on quality, certification, and supply chain transparency rather than price, fostering a more resilient and diversified global shea butter market.
Shea Butter Industry Leaders
-
AAK AB
-
Bunge Limited
-
Cargill Inc.
-
Fuji Oil Holdings
-
Olvea Group
- *Disclaimer: Major Players sorted in no particular order

Recent Industry Developments
- June 2025: A shea processing facility was inaugurated in Ilesha Baruba, Kwara State. The facility featured modern processing machinery, a borehole for clean water access, a creche, cloakrooms, and dedicated storage units for raw materials and finished products.
- June 2025: The Global Shea Alliance (GSA), Evolution of Smooth products, and Water for West Africa (WfWA) formed a strategic partnership to support women shea processors and enhance access to clean water, quality infrastructure, and sustainable livelihoods in Northern Ghana and Côte d’Ivoire.
- December 2024: Uganda adopted new fractionation technology that enhanced shea butter production by 300% while reducing energy consumption by 40%. This advancement significantly decreased traditional processing time, which previously took 10 hours. The technology enabled the production of diverse products, such as cooking oil and cosmetics, potentially facilitating access to international markets for Ugandan shea butter.
- June 2024: Bunge initiated a public-private partnership in Ghana to support women shea collectors through the Women Shea Business Cooperative project, in collaboration with Agriterra and GIZ. The initiative established six independent cooperatives, benefiting over 2,500 women and their communities. This project was funded by the German Federal Ministry for Economic Cooperation and Development and aligned with Bunge's broader objective of positively impacting 400,000 shea-collecting women by 2030.


Global Shea Butter Market Report Scope
| Raw/Unrefined |
| Refined |
| Fractionated (stearin, olein) |
| Personal-Care and Cosmetics |
| Food and Beverage |
| Pharmaceuticals and Nutraceuticals |
| Industrial (bio-lubes, candles, etc.) |
| North America | United States |
| Canada | |
| Mexico | |
| Rest of North America | |
| Europe | Germany |
| United Kingdom | |
| Italy | |
| France | |
| Spain | |
| Russia | |
| Rest of Europe | |
| Asia-Pacific | China |
| India | |
| Japan | |
| Australia | |
| Rest of Asia-Pacific | |
| South America | Brazil |
| Argentina | |
| Rest of South America | |
| Middle East and Africa | South Africa |
| United Arab Emirates | |
| Rest of Middle East and Africa |
| By Ingredient Type | Raw/Unrefined | |
| Refined | ||
| Fractionated (stearin, olein) | ||
| By Application | Personal-Care and Cosmetics | |
| Food and Beverage | ||
| Pharmaceuticals and Nutraceuticals | ||
| Industrial (bio-lubes, candles, etc.) | ||
| By Geography | North America | United States |
| Canada | ||
| Mexico | ||
| Rest of North America | ||
| Europe | Germany | |
| United Kingdom | ||
| Italy | ||
| France | ||
| Spain | ||
| Russia | ||
| Rest of Europe | ||
| Asia-Pacific | China | |
| India | ||
| Japan | ||
| Australia | ||
| Rest of Asia-Pacific | ||
| South America | Brazil | |
| Argentina | ||
| Rest of South America | ||
| Middle East and Africa | South Africa | |
| United Arab Emirates | ||
| Rest of Middle East and Africa | ||


Key Questions Answered in the Report
How large will the Shea butter market be by 2031?
It is forecast to reach USD 4.01 billion by 2031, growing at a 7.76% CAGR from 2026 to 2031.
Which segment is growing fastest within global demand?
Fractionated shea stearin and olein are expanding at an 8.44% CAGR because food and cosmetics producers value their performance and regulatory clarity.
Why is Asia-Pacific demand accelerating?
China’s approval of shea-based cocoa-butter equivalents, rising disposable income, and clean-beauty preferences lift regional growth to 7.76% CAGR.
Which alternative fats challenge shea?
Mango, kokum, and emerging macaúba oil offer shorter supply chains and lower carbon footprints, attracting formulators seeking diversified sources.
Page last updated on:


