Server Virtualization Energy Optimization Software Market Size and Share
Market Overview
| Study Period | 2020 - 2031 |
|---|---|
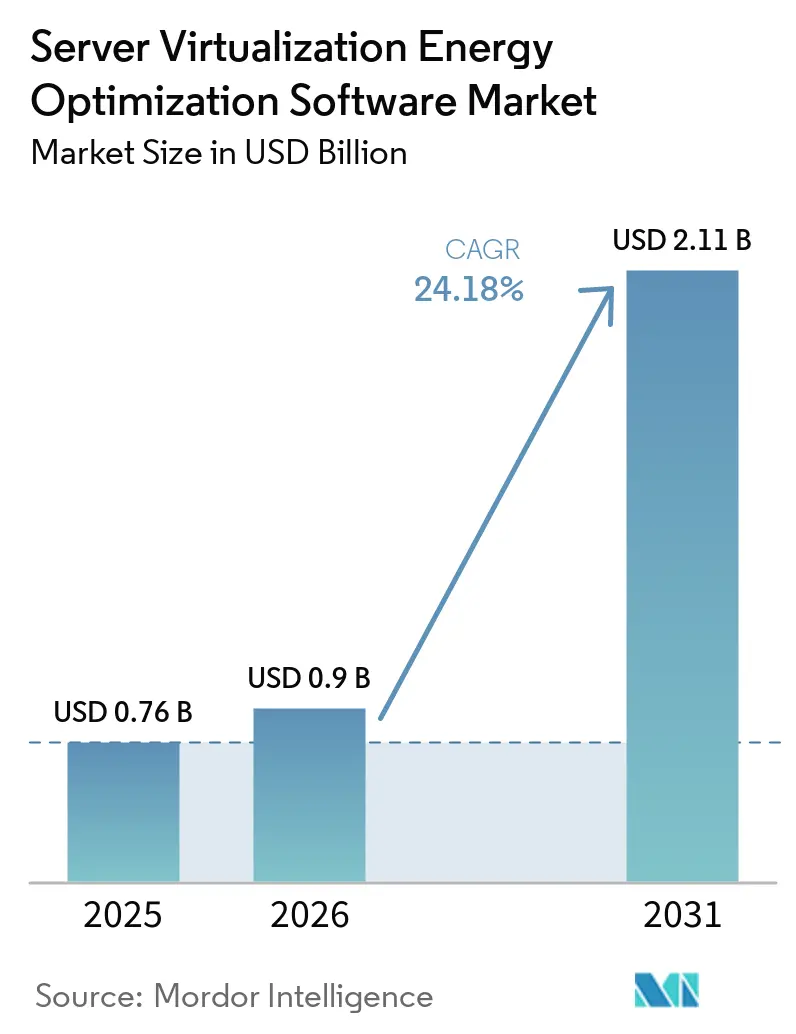
| Market Size (2026) | USD 0.9 Billion |
| Market Size (2031) | USD 2.11 Billion |
| Growth Rate (2026 - 2031) | 24.18% CAGR |
| Fastest Growing Market | Asia-Pacific |
| Largest Market | North America |
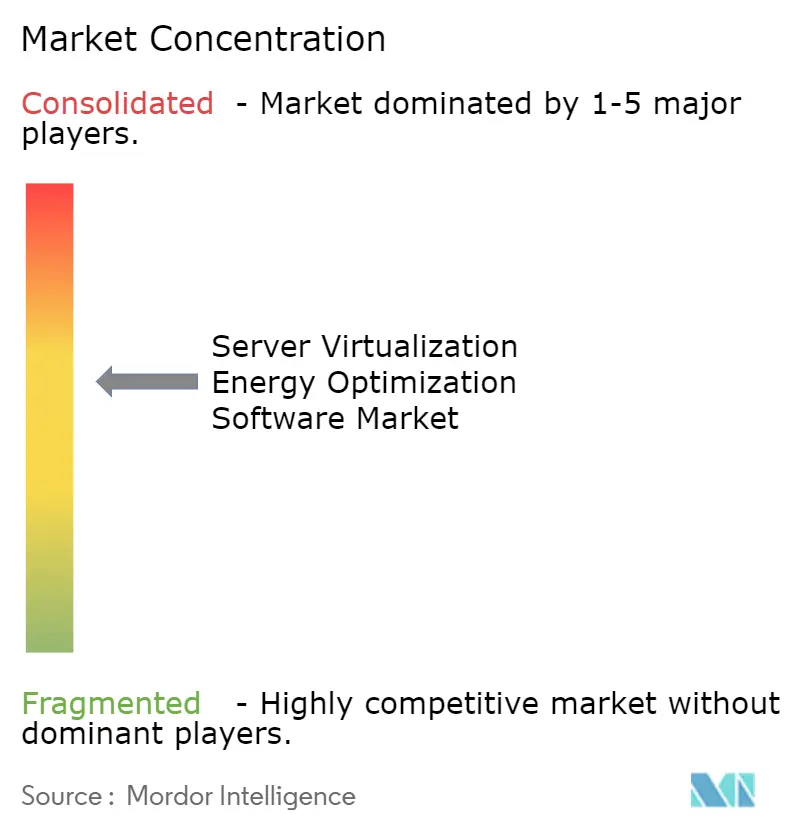
| Market Concentration | Medium |
Major Players *Disclaimer: Major Players sorted in no particular order Image © Mordor Intelligence. Reuse requires attribution under CC BY 4.0. | |
Server Virtualization Energy Optimization Software Market Analysis by Mordor Intelligence
The server virtualization energy optimization software market size was valued at USD 0.76 billion in 2025 and estimated to grow from USD 0.90 billion in 2026 to reach USD 2.11 billion by 2031, at a CAGR of 18.58% during the forecast period 2026-2031. The rise in AI-led compute workloads is changing power use inside virtualized environments and making energy-aware scheduling much more important in daily operations. Demand is no longer tied solely to large hyperscale estates, as faster growth in services, hybrid deployments, SMEs, and IT and telecom sectors shows that the buying base is widening across the server virtualization energy optimization software market. North America remains the largest regional base, Asia-Pacific is set for the fastest expansion, and Europe continues to show durable demand because compliance rules are turning energy reporting into an operational requirement. Competition is moderate to high, led by vendors with deep hypervisor integration, while fragmented telemetry, legacy tool integration, and less certain payback for smaller estates continue to slow some deployments. Even so, these issues are extending deal cycles more than they are changing the long-term direction of the server virtualization energy optimization software market.
Key Report Takeaways
- By component, software held 70.12% share in 2025, while services are projected to expand at a 20.12% CAGR through 2031.
- By deployment mode, cloud-based deployment accounted for 66.41% of the server virtualization energy optimization software market in 2025, while hybrid deployment is projected to expand at a 19.95% CAGR through 2031.
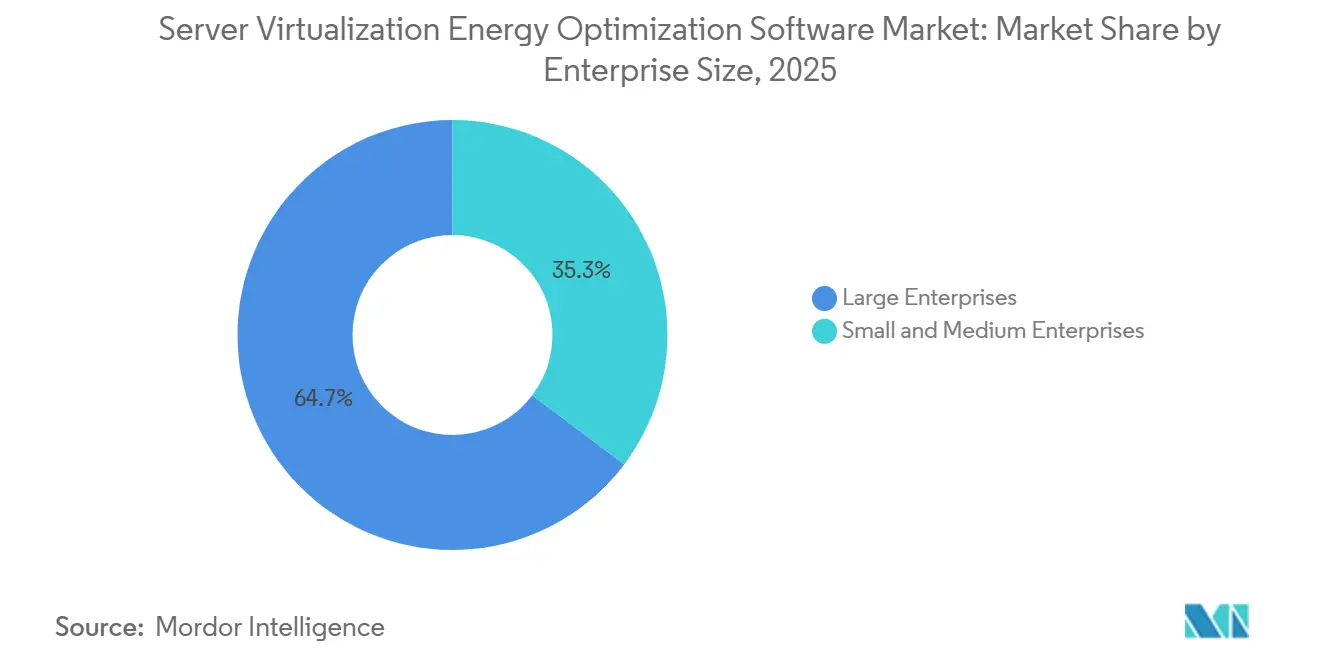
- By enterprise size, large enterprises held 64.72% share in 2025, while SMEs are projected to grow at a 21.34% CAGR through 2031.
- By end-user industry, industrial manufacturing led with 27.63% share in 2025, while IT and telecom are projected to advance at a 20.87% CAGR through 2031.
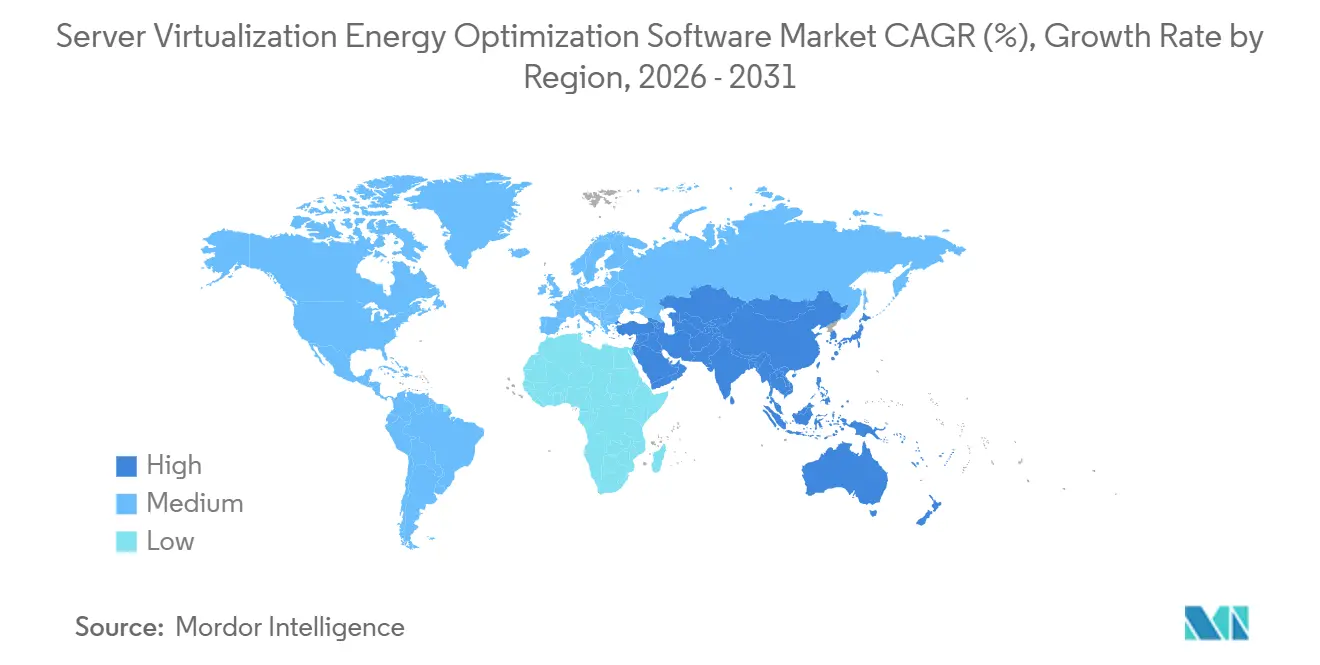
- By geography, North America held 34.56% of server virtualization energy optimization software market share in 2025, while Asia-Pacific is projected to record the highest CAGR at 23.78% through 2031.
Note: Market size and forecast figures in this report are generated using Mordor Intelligence’s proprietary estimation framework, updated with the latest available data and insights as of January 2026.
Global Server Virtualization Energy Optimization Software Market Trends and Insights
Drivers Impact Analysis*
| Driver | (~) % Impact on CAGR Forecast | Geographic Relevance | Impact Timeline |
|---|---|---|---|
| Rising Power Density in Virtualized Server Environments | +4.2% | Global, concentrated in North America and Asia-Pacific | Short term (≤ 2 years) |
| Growing Enterprise Focus on Data Center Energy Cost Reduction | +3.8% | Global | Short term (≤ 2 years) |
| Expansion of Hyperconverged Infrastructure and Consolidated Compute Stacks | +3.2% | North America, Europe, and Asia-Pacific | Medium term (2-4 years) |
| Compliance Pressure for Carbon Reporting and Energy Transparency | +2.9% | Europe and North America, spill-over to Asia-Pacific | Medium term (2-4 years) |
| AI-Assisted Power Scheduling and Workload Placement | +2.5% | Global, early gains in North America and EU | Long term (≥ 4 years) |
| Demand for Granular VM-Level Energy Attribution | +1.8% | Global | Medium term (2-4 years) |
| Source: Mordor Intelligence | |||
Rising Power Density In Virtualized Server Environments
AI accelerator adoption is concentrating more wattage per rack, turning power density into a direct software issue for the server virtualization energy-optimization software market. The International Energy Agency stated that servers already accounted for 60% of data center electricity demand and projected that server electricity consumption would grow strongly through 2030.[1]ScienceDirect, “Enhancing Data Center Energy Efficiency, Optimal Workload Scheduling for Integrated Power-Computing-Cooling Management,” sciencedirect.com That change matters because static placement models were built for general-purpose server estates, not for mixed clusters where a single AI-capable rack can draw 30 kW or more. A 2026 study published in Energy found that coordinated power, computing, and cooling optimization reduced data center power consumption by up to 30.56% versus constant air volume systems. As rack density rises, the cost of poor VM placement increases faster than linearly, keeping the server virtualization energy-optimization software market close to the core operating stack.
Growing Enterprise Focus On Data Center Energy Cost Reduction
Electricity has become a larger operating expense for data center operators, so the server virtualization energy optimization software market is benefiting as buyers link energy control with infrastructure cost reduction. Physical servers that run at low utilization still consume a large share of peak power, which keeps consolidation economics attractive even before formal sustainability targets are applied. Broadcom stated in May 2026 that VMware Cloud Foundation 9.1 introduced intelligent memory tiering and enhanced compression, reducing server costs by up to 40% for clusters running mixed AI and non-AI workloads.[2]Broadcom Inc., “Broadcom Announces VMware Cloud Foundation 9.1, Enabling Secure and Cost-Effective Infrastructure for Production AI,” broadcom.com IBM reported that Atruvia used Turbonomic to decommission more than 1,000 physical servers in 18 months, cutting hardware footprint by 20% while lowering energy use and carbon emissions. This is pushing the server virtualization energy optimization software market toward purchase decisions that combine operating efficiency, hardware reduction, and sustainability reporting in a single software solution.
Expansion Of Hyperconverged Infrastructure And Consolidated Compute Stacks
Hyperconverged infrastructure is giving software teams more direct control over compute, storage, and network resources, which lifts the importance of the server virtualization energy optimization software market. A 2025 academic paper from the University of Turin found that hyperconverged models centralized resource allocation, reduced physical hardware needs, and lowered energy and cooling demand in next-generation data centers. Cisco stated that its Compute Hyperconverged X-Series with Nutanix and Intel Xeon 6 was designed to support sustainability goals through lower power-per-workload ratios than traditional rack servers. As enterprises replace siloed three-tier stacks with standardized nodes, workload placement and energy analytics move closer to software platform teams. That shift makes the server virtualization energy optimization software market more relevant to daily IT operations and less dependent on stand-alone facilities tools.[3]Cisco Systems Inc., “Cisco Compute Hyperconverged X210 M8 Modular Server Family Data Sheet,” cisco.com
Compliance Pressure For Carbon Reporting And Energy Transparency
Regulation is making server-level power attribution harder to treat as optional, and that is reinforcing demand across the server virtualization energy optimization software market. The European Commission requires annual reporting for data centers above 500 kW under the Energy Efficiency Directive, and the reporting cycle that came into force in May 2026 covered data for the full year 2025. In the United States, the SEC adopted climate disclosure rules in March 2024 that required Scope 1 and Scope 2 reporting from large accelerated filers starting with their fiscal year 2025 annual reports. Nlyte Software responded to this shift with Version 16, which added EU EED-aligned sustainability reporting and location-level reporting support in November 2025. The result is that the server virtualization energy optimization software market is becoming tied more closely to compliance budgets, recurring reporting workflows, and audit readiness.
Restraints Impact Analysis*
| Restraint | (~) % Impact on CAGR Forecast | Geographic Relevance | Impact Timeline |
|---|---|---|---|
| Limited Visibility Across Multi-Cloud and Hybrid Virtualization Stacks | -1.8% | Global | Medium term (2-4 years) |
| Integration Complexity With Legacy Orchestration and Monitoring Tools | -1.5% | North America and Europe, enterprise-heavy markets | Medium term (2-4 years) |
| ROI Uncertainty for Smaller IT Environments | -1.1% | Global, strongest in South America, Middle East and Africa, and Tier-2 Asia-Pacific markets | Short term (≤ 2 years) |
| Data Quality Gaps in Power Telemetry and Asset Mapping | -0.8% | Global | Short term (≤ 2 years) |
| Source: Mordor Intelligence | |||
Limited Visibility Across Multi-Cloud And Hybrid Virtualization Stacks
The server virtualization energy optimization software market still faces visibility challenges when workloads move between private and public environments. Energy, utilization, and carbon information are often split across provider-specific consoles, which undermines attribution consistency and makes it harder to validate optimization at scale. Vendor tools reflect this fragmentation, with Broadcom surfacing carbon and energy dashboards inside VMware environments and Dynatrace exposing cost and carbon optimization through its own observability layer. When a workload shifts between on-premises VMware and public cloud during the same reporting window, baseline assumptions can change before measurement is complete. Until telemetry becomes more uniform across environments, the server virtualization energy optimization software market will continue to face slower rollout decisions in hybrid estates.
Integration Complexity With Legacy Orchestration And Monitoring Tools
Integration with legacy orchestration and monitoring tools remains a practical barrier to the server virtualization energy-optimization software market. Many large enterprises still depend on CMDB, ITSM, and hypervisor management tools that were not designed to move energy-centric data across workflows. Nlyte's connector catalog spans VMware, Hyper-V, Nutanix, Citrix, Oracle VM, Red Hat, BMC Remedy, and ServiceNow, underscoring the amount of mapping work required even in supported environments.[4]Nlyte Software, “Nlyte Software Add-Ons and Connectors,” nlyte.com The burden rises further when enterprises run several hypervisors in parallel and keep them on different upgrade cycles. This extends implementation time, raises service needs, and creates deployment risk, especially for buyers without dedicated integration teams.
*Our forecasts treat driver/restraint impacts as directional, not additive. The impact forecasts reflect baseline growth, mix effects, and variable interactions.
Segment Analysis
By Component: Services Growth Reflects Platform Complexity
Software accounted for 70.12% of the server virtualization energy optimization software market share in 2025, making it the leading component segment. In the server virtualization energy optimization software market, buyers continued to prioritize VM optimization platforms, resource allocation engines, and power analytics over stand-alone tools. Bundled offerings that combine workload balancing, VM consolidation, capacity optimization, and power analytics are reducing the boundary between separate product categories. This keeps competition centered on platform depth and integration stickiness inside the server virtualization energy optimization software industry.
Services are projected to expand at a 20.12% CAGR from 2026 to 2031, the fastest rate within the component mix. The server virtualization energy optimization software market is seeing that growth because many deployments require continuous tuning across mixed hypervisor stacks rather than a one-time installation. IBM reported that Atruvia used Turbonomic to decommission more than 1,000 physical servers in 18 months while reducing its hardware footprint by 20% and lowering energy use and carbon emissions. IBM also extended Turbonomic into GitHub and HashiCorp Terraform in May 2025, which widened the services role across infrastructure-as-code environments.


By Deployment Mode: Hybrid Architectures Drive New Adoption
Cloud-based deployment accounted for 66.41% of the server virtualization energy optimization software market in 2025, giving it a clear lead among deployment models. The server virtualization energy optimization software market favored cloud delivery because SaaS models eliminated local maintenance and enabled continuous telemetry from distributed workloads. This approach also fits buyers that wanted faster updates and easier dashboard access without expanding on-site software teams. Even so, cloud leadership has not removed concerns about placing sensitive workloads and energy data in external aggregation layers.
Hybrid deployment is projected to grow at a 19.95% CAGR through 2031, making it the fastest-growing deployment mode. The server virtualization energy optimization software market is moving in this direction because enterprises want private control for sensitive environments while still maintaining visibility across public cloud workloads. Broadcom positioned VMware Cloud Foundation 9.1 around that balance by extending carbon transparency and energy-efficient cluster dashboards for mixed AI and non-AI environments. Broadcom also stated in August 2025 that 9 of the top 10 Fortune 500 companies had committed to VMware Cloud Foundation, underscoring the staying power of hybrid architectures in the server virtualization energy-optimization software market.
By Enterprise Size: SME Adoption Accelerates Across SaaS Platforms
Large enterprises held 64.72% of the market share in 2025, which kept them at the center of demand. The server virtualization energy optimization software market benefited from their larger data center footprints, existing automation frameworks, and board-level ESG mandates. Platforms such as IBM Turbonomic and VMware Cloud Foundation are better suited to environments with many VM instances and multiple hypervisors, where optimization decisions have a clearer operational impact. This buyer group also has more established governance paths for approving software spend tied to energy reporting and workload efficiency.
SMEs are projected to grow at a 21.34% CAGR through 2031, making them the fastest-growing segment by enterprise size. The server virtualization energy optimization software market is reaching smaller organizations through SaaS delivery, simpler onboarding, and broader observability suites that combine cost and carbon views. Dynatrace's Cost and Carbon Optimization capability reflects this shift by placing energy tracking within a broader monitoring workflow that smaller IT teams can manage more easily. SME demand is also rising as server refresh cycles move smaller firms away from aging physical infrastructure and toward cloud-native or hyperconverged environments that include energy reporting by default.
By End-User Industry: IT And Telecom Drives Attribution Precision
Industrial manufacturing accounted for 27.63% of the server virtualization energy optimization software market in 2025, making it the largest end-user segment. The server virtualization energy optimization software market saw strong demand here because OT-IT convergence depends on stable virtualized environments that support both production systems and enterprise workloads. In these settings, energy-aware placement helps limit thermal stress without sacrificing uptime, giving efficiency software both an operational and a resilience role. This pattern keeps adoption tied to plant modernization, workload stability, and reporting discipline rather than to energy cost alone.
IT and telecom are projected to grow at a 20.87% CAGR from 2026 to 2031, the fastest pace among end-user industries. The server virtualization energy optimization software industry is closely aligned with this vertical because telecom operators run dense virtualized infrastructure and face direct exposure to electricity costs. Broadcom's VMware Telco Cloud Platform 9, with targeted energy-efficient support for 5G and AI applications through intelligent resource scheduling, underscores the need for more precise attribution in telecom environments. Healthcare, retail, government, and utilities are smaller today, yet the server virtualization energy optimization software market is attracting greater interest from these users as audit-ready Scope 2 reporting becomes harder to defer.
Geography Analysis
North America held 34.56% of the server virtualization energy optimization software market share in 2025, making it the largest region. The region benefits from dense hyperscale and enterprise data center footprints, along with stronger links between energy management and financial reporting. The Congressional Research Service stated that U.S. data center annual energy use reached 176 TWh in 2023, equal to 4.4% of national electricity use, and it noted that the figure could double or triple by 2028. The SEC climate disclosure rule heightened the importance of Scope 1 and Scope 2 tracking for listed companies, strengthening the case for software-based energy attribution. Canada and Mexico remain smaller parts of the regional base, but the server virtualization energy optimization software market is expanding there as digital infrastructure and disclosure expectations become more formal.
Asia-Pacific is projected to grow at 23.78% CAGR through 2031, making it the fastest regional segment. The server virtualization energy optimization software market is gaining momentum here because new data center capacity, sovereign data rules, and tighter efficiency standards are pushing operators to manage power more actively. Singapore, India, China, and Australia are drawing attention because operators need to scale capacity without losing control over utilization, cooling pressure, and reporting quality. This combination gives the server virtualization energy optimization software market a broader runway in Asia-Pacific than in regions with slower infrastructure growth.
Europe is growing more slowly than Asia-Pacific on an absolute basis, yet it remains one of the most durable parts of the server virtualization energy optimization software market because reporting obligations are mandatory rather than optional. The European Commission requires annual performance reporting for data centers above 500 kW, and the reporting cycle that came into force in May 2026 has made compliance a repeat-purchase driver. A July 2025 EU study on the next steps for energy performance and sustainability reporting indicated that the rules will become more demanding over time, while national measures in countries such as Sweden and Germany are already reinforcing that direction. South America, the Middle East, and Africa are still earlier adopters, yet the server virtualization energy optimization software market is beginning to appear in large new-build digital infrastructure projects across those regions.

Competitive Landscape
The server virtualization energy optimization software market remains moderately consolidated, with a small group of infrastructure software vendors controlling deep hypervisor access. Broadcom, IBM, and Nutanix continue to set buyer expectations by linking optimization logic to the virtual infrastructure layer rather than to stand-alone monitoring. Broadcom raised the baseline in June 2025 when VMware Cloud Foundation 9.0 added Energy Efficient Clusters, Energy Efficient Infrastructure, and Carbon Transparency dashboards inside private cloud operations. Specialist vendors such as Nlyte retain room where compliance workflows and data center infrastructure management matter more than broad hypervisor coverage. Even so, the server virtualization energy optimization software market still lacks a single vendor that delivers equally strong support across VMware, Hyper-V, Nutanix AHV, KVM, and public cloud from a single common layer.
Competition is shifting toward automation depth, which is changing how the server virtualization energy optimization software market defines product value. IBM widened Turbonomic's reach in May 2025 by integrating with GitHub and HashiCorp Terraform, pushing optimization into infrastructure-as-code workflows rather than leaving it to manual operations alone. Broadcom's VMware Cloud Foundation 9.1 added intelligent memory tiering and extended sustainability dashboards for mixed AI and non-AI clusters in May 2026, which strengthened its position in dense virtual environments. Nutanix used .NEXT 2026 to extend agentic AI support and hybrid multicloud management, which showed that the server virtualization energy optimization software market is increasingly competing on software intelligence as much as on connectivity.
Dynatrace points in another direction, as its Cost and Carbon Optimization module sits within a broader observability platform and blurs the line between monitoring tools and dedicated energy software. This pressure is forcing smaller vendors in the server virtualization energy optimization software market to widen their use cases or defend specialized niches such as compliance mapping and DCIM alignment. The next competitive contest is likely to center on algorithm quality, cross-hypervisor consistency, and the services ecosystem needed to keep optimization credible over time. That balance explains why the server virtualization energy optimization software market is competitive enough to resist tight control by a single company, yet concentrated enough for a few incumbents to shape architectural standards.
Server Virtualization Energy Optimization Software Industry Leaders
VMware, Inc.
Red Hat, Inc.
Nutanix, Inc.
BMC Software, Inc.
Citrix Systems, Inc.
- *Disclaimer: Major Players sorted in no particular order

Recent Industry Developments
- June 2026: Nutanix held its .NEXT 2026 conference in Chicago, unveiling agentic AI platform enhancements to the Nutanix Cloud Platform, including expanded AMD GPU-accelerated compute server support, zero-copy migration from legacy virtualization platforms, and advanced hybrid multicloud management. These capabilities extend energy-aware workload placement at scale for enterprise and neocloud operators, with the full Agentic AI solution expected in the second half of 2026.
- May 2026: Broadcom announced VMware Cloud Foundation 9.1, delivering up to 40% reduction in server costs through intelligent memory tiering for clusters running mixed AI and non-AI workloads and up to 39% lower storage TCO through enhanced compression and deduplication for AI data pipelines. The release extended VCF's Carbon Transparency and Energy Efficient Clusters dashboards with production AI workload readiness, reinforcing Broadcom's position at the center of the server virtualization energy optimization software market.
- April 2026: SolarWinds launched SW1, an agentic AI teammate available in SolarWinds Observability SaaS and self-hosted IT environments, enabling autonomous operational resilience for virtual machine monitoring, capacity planning, and workload governance. Additional SW1 capabilities are planned for rollout throughout 2026, extending automated energy governance to mid-market and enterprise operators.
- April 2026: Grafana Labs launched Grafana 13 at GrafanaCON 2026, expanding its open observability platform's ability to unify telemetry from compute, network, and energy systems at scale. Grafana Labs serves more than 35 million users and over 7,000 enterprise customers, including Microsoft, NVIDIA, Bloomberg, and Anthropic, underscoring its role as an infrastructure visibility layer for data center energy monitoring.


Global Server Virtualization Energy Optimization Software Market Report Scope
The Server Virtualization Energy Optimization Software market comprises digital platforms and services that reduce energy consumption and improve efficiency in virtualized IT environments. These solutions include VM optimization platforms, resource allocation engines, energy-aware workload balancing, VM consolidation tools, capacity optimization software, and power consumption analytics. By intelligently managing workloads and virtual machines, these systems help organizations lower operational costs, reduce carbon footprints, and enhance sustainability in data center operations.
The Server Virtualization Energy Optimization Software market report is segmented by Component (Software [VM optimization platforms, resource allocation engines, energy-aware workload balancing, VM consolidation tools, capacity optimization software, power consumption analytics], and Services), Deployment Mode (Cloud-Based, On-Premises, and Hybrid), Enterprise Size (Large Enterprises, and Small and Medium Enterprises), End-user Industry (Industrial Manufacturing, Energy and Utilities, BFSI, Retail and Consumer Goods, IT and Telecom, Healthcare and Life Sciences, Government and Public Sector, Transportation and Logistics, and Other End-user Industries), and Geography (North America, South America, Europe, Asia-Pacific, Middle East, and Africa). The Market Forecasts are Provided in Terms of Value (USD).
| Software | VM optimization platforms |
| Resource allocation engines | |
| Energy-aware workload balancing | |
| VM consolidation tools | |
| Capacity optimization software | |
| Power consumption analytics | |
| Services |
| Cloud-Based |
| On-Premises |
| Hybrid |
| Large Enterprises |
| Small and Medium Enterprises |
| Industrial Manufacturing |
| Energy and Utilities |
| BFSI |
| Retail and Consumer Goods |
| IT and Telecom |
| Healthcare and Life Sciences |
| Government and Public Sector |
| Transportation and Logistics |
| Other End-user Industries |
| North America | United States |
| Canada | |
| Mexico | |
| South America | Brazil |
| Argentina | |
| Rest of South America | |
| Europe | Germany |
| United Kingdom | |
| France | |
| Italy | |
| Spain | |
| Russia | |
| Netherlands | |
| Rest of Europe | |
| Asia-Pacific | China |
| Japan | |
| India | |
| South Korea | |
| Australia and New Zealand | |
| Rest of Asia-Pacific | |
| Middle East | Saudi Arabia |
| United Arab Emirates | |
| Rest of Middle East | |
| Africa | South Africa |
| Nigeria | |
| Rest of Africa |
| By Component | Software | VM optimization platforms |
| Resource allocation engines | ||
| Energy-aware workload balancing | ||
| VM consolidation tools | ||
| Capacity optimization software | ||
| Power consumption analytics | ||
| Services | ||
| By Deployment Mode | Cloud-Based | |
| On-Premises | ||
| Hybrid | ||
| By Enterprise Size | Large Enterprises | |
| Small and Medium Enterprises | ||
| By End-user Industry | Industrial Manufacturing | |
| Energy and Utilities | ||
| BFSI | ||
| Retail and Consumer Goods | ||
| IT and Telecom | ||
| Healthcare and Life Sciences | ||
| Government and Public Sector | ||
| Transportation and Logistics | ||
| Other End-user Industries | ||
| By Geography | North America | United States |
| Canada | ||
| Mexico | ||
| South America | Brazil | |
| Argentina | ||
| Rest of South America | ||
| Europe | Germany | |
| United Kingdom | ||
| France | ||
| Italy | ||
| Spain | ||
| Russia | ||
| Netherlands | ||
| Rest of Europe | ||
| Asia-Pacific | China | |
| Japan | ||
| India | ||
| South Korea | ||
| Australia and New Zealand | ||
| Rest of Asia-Pacific | ||
| Middle East | Saudi Arabia | |
| United Arab Emirates | ||
| Rest of Middle East | ||
| Africa | South Africa | |
| Nigeria | ||
| Rest of Africa | ||


Key Questions Answered in the Report
What is the current and forecast value of the server virtualization energy optimization software market?
The market stood at USD 0.90 billion in 2026 and is forecast to reach USD 2.11 billion by 2031, growing at a CAGR of 18.71%.
What is driving growth in this space?
The main drivers are rising rack power density, stronger pressure to reduce data center electricity costs, wider use of hyperconverged infrastructure, and tighter carbon and energy reporting rules.
Which deployment model leads today and which is growing fastest?
Cloud-based deployment led with 66.41% share in 2025, while hybrid deployment is projected to grow fastest at a 19.95% CAGR through 2031.
Which buyer group is expanding fastest?
Large enterprises remained the biggest buyers with 64.72% share in 2025, but SMEs are projected to grow fastest at a 21.34% CAGR through 2031.
Which end-user vertical matters most right now?
Industrial manufacturing led with 27.63% share in 2025 because stable, energy-aware virtual environments are important for production uptime and OT-IT convergence.
Which region leads and which region is growing fastest?
North America led with 34.56% share in 2025, while Asia-Pacific is projected to post the fastest regional CAGR at 23.78% through 2031.
Page last updated on:


