Virtual Client Computing Software Market Size and Share
Market Overview
| Study Period | 2019 - 2030 |
|---|---|
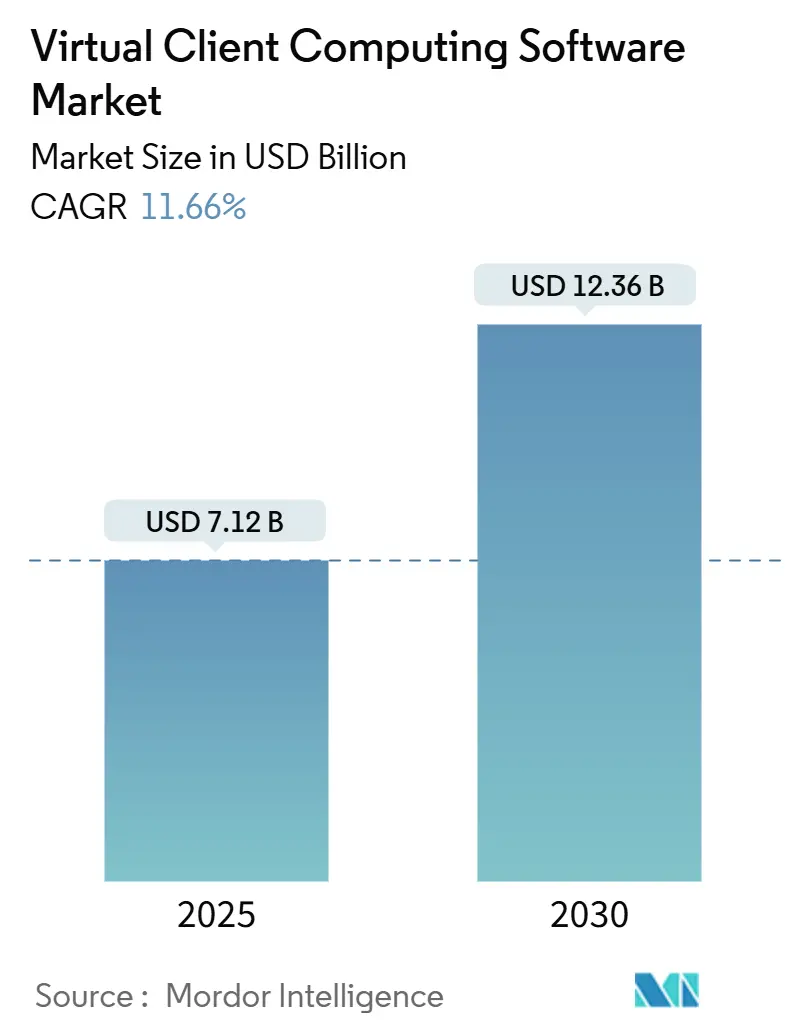
| Market Size (2025) | USD 7.12 Billion |
| Market Size (2030) | USD 12.36 Billion |
| Growth Rate (2025 - 2030) | 11.66% CAGR |
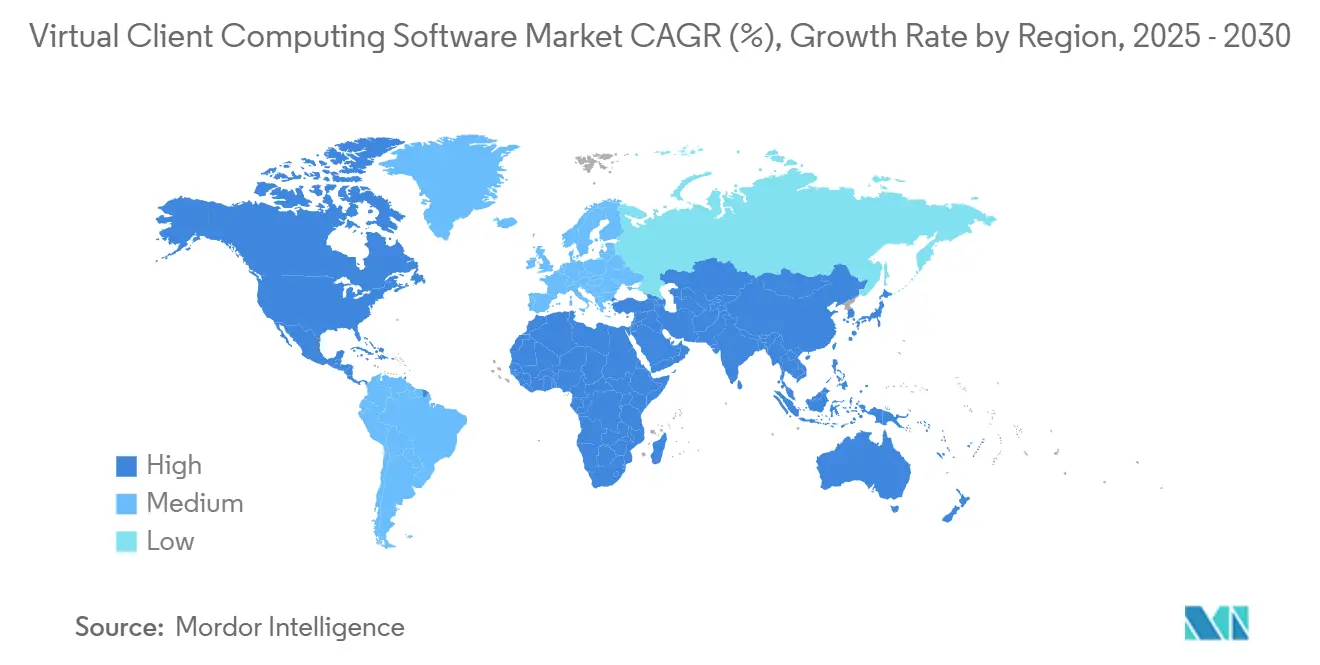
| Fastest Growing Market | Asia Pacific |
| Largest Market | North America |
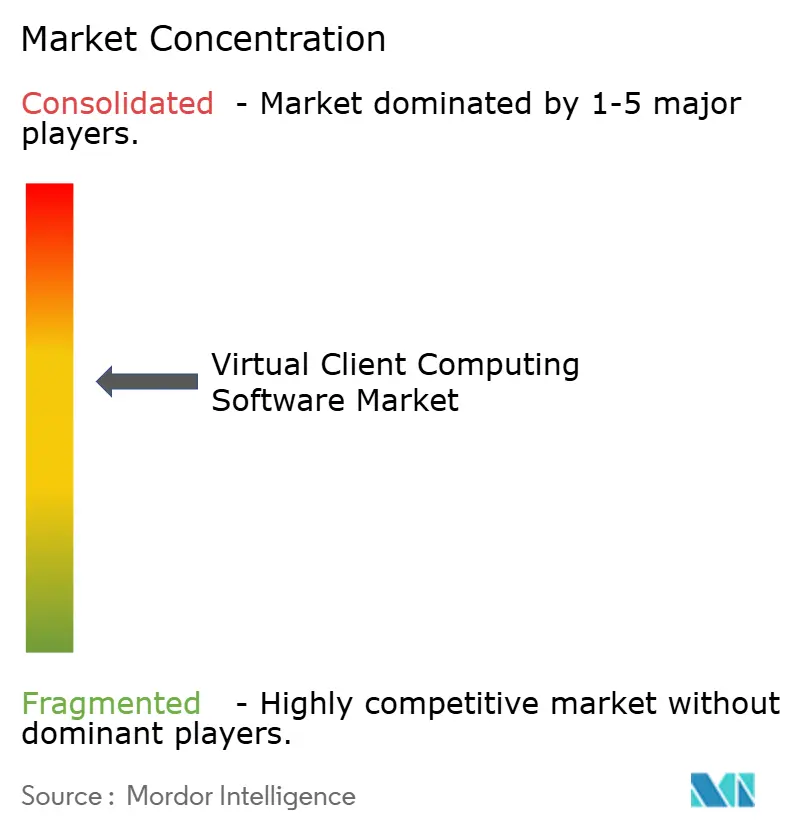
| Market Concentration | Medium |
Major Players *Disclaimer: Major Players sorted in no particular order Image © Mordor Intelligence. Reuse requires attribution under CC BY 4.0. | |
Virtual Client Computing Software Market Analysis by Mordor Intelligence
The virtual client computing software market size is estimated at USD 7.12 billion in 2025 and is projected to reach USD 12.36 billion by 2030, growing at a 11.66% CAGR. Intensifying hybrid work adoption, maturing 5G connectivity, and the arrival of edge-accelerated virtual desktop infrastructure (VDI) now place user experience, security, and compliance on equal footing with cost efficiency for purchasing teams. Enterprises are shifting from device-centric provisioning toward digitally resilient workplaces that allow staff to work productively from any location while meeting industry-specific regulations. As a result, vendors that prove measurable gains in latency-sensitive workloads, endpoint security posture, and audit-grade activity logging gain preference. Ecosystem consolidation is also underway as platform providers fold identity, monitoring, and GPU services into desktop virtualization portfolios, creating unified workspaces that reduce integration risk for customers.
Key Report Takeaways
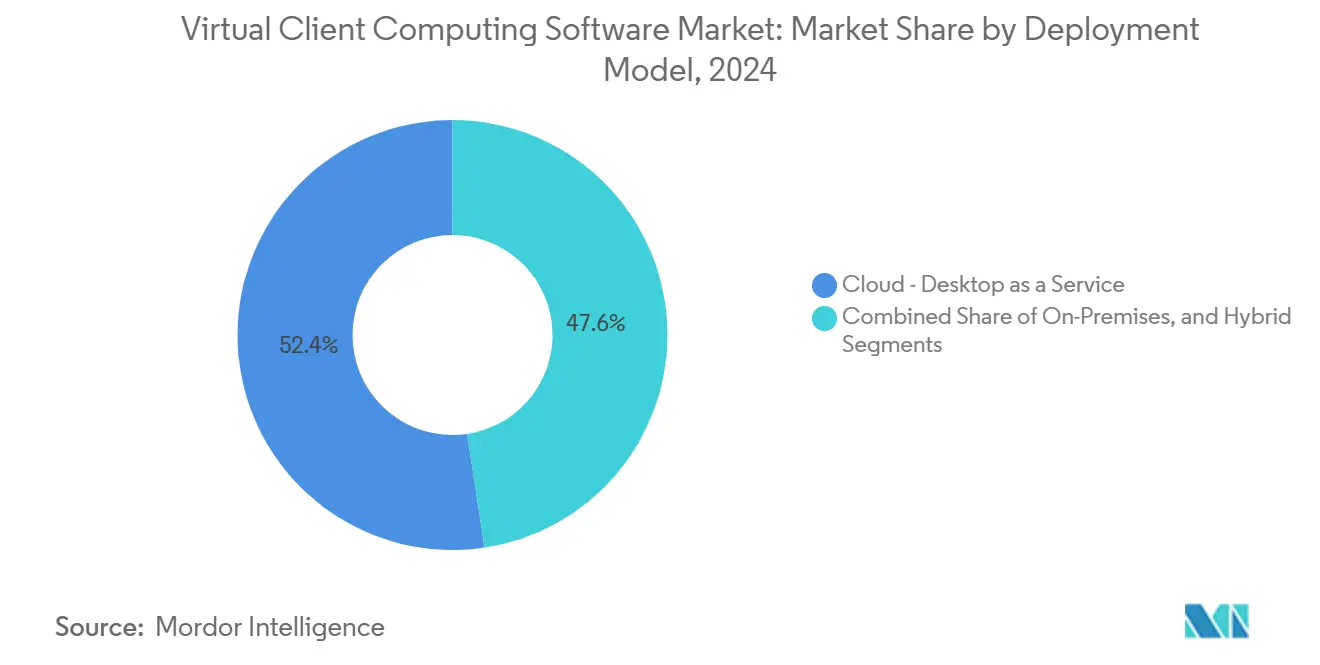
- By deployment model, cloud-based Desktop as a Service held 52.37% revenue share of the virtual client computing software market in 2024. Hybrid and on-premises configurations are expected to post a 13.18% CAGR through 2030 as organizations migrate legacy workloads in phases.
- By organization size, large enterprises accounted for 70.32% of the 2024 virtual client computing software market share. Small and medium enterprises are projected to expand at a 12.21% CAGR through 2030 as simplified subscription bundles cut upfront spending barriers.
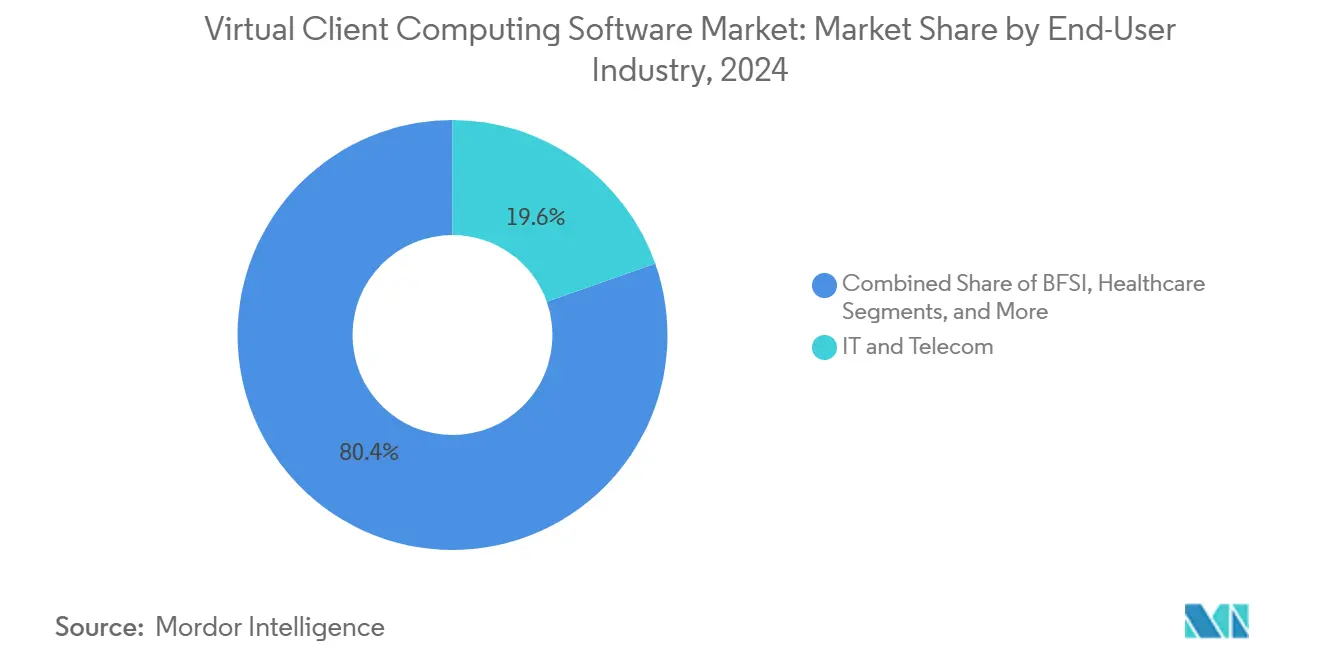
- By end-user industry, the IT and telecom sector led with a 19.61% share in 2024. Healthcare is expected to grow at the fastest rate, with a 13.60% CAGR through 2030, as telemedicine and HIPAA-aligned data governance requirements accelerate the rollout of virtual desktops.
- By technology, Virtual Desktop Infrastructure commanded a 59.74% share in 2024. Access management and monitoring solutions are forecast to register a 14.46% CAGR through 2030, as zero-trust frameworks demand granular identity controls.
- By geography, North America contributed 40.28% revenue in 2024 to the virtual client computing software market. Asia Pacific is on track for a 13.19% CAGR through 2030 as manufacturing and finance enterprises digitize operations to support remote staff.
Note: Market size and forecast figures in this report are generated using Mordor Intelligence’s proprietary estimation framework, updated with the latest available data and insights as of January 2026.
Global Virtual Client Computing Software Market Trends and Insights
Drivers Impact Analysis*
| Driver | (~) % Impact on CAGR Forecast | Geographic Relevance | Impact Timeline |
|---|---|---|---|
| Rising demand for work-from-anywhere solutions | +2.8% | Global with concentration in North America and Europe | Medium term (2-4 years) |
| Accelerated shift toward cloud Desktop as a Service models | +3.2% | Global led by North America, expanding in Asia Pacific | Short term (≤ 2 years) |
| Endpoint security compliance requirements | +1.9% | Global with regulatory emphasis in Europe and North America | Long term (≥ 4 years) |
| Cost optimization initiatives among enterprises | +1.6% | Global with higher impact in emerging markets | Medium term (2-4 years) |
| 5G network deployment enabling low-latency VDI | +1.4% | Asia Pacific core, spill-over to North America and Europe | Long term (≥ 4 years) |
| Sustainability imperatives driving energy-efficient thin clients | +0.7% | Europe and North America, expanding to Asia Pacific | Long term (≥ 4 years) |
| Source: Mordor Intelligence | |||
Rising Demand for Work-From-Anywhere Solutions
Permanent hybrid work policies have elevated desktop virtualization from an IT efficiency project to a strategic pillar of employee experience. Organizations found that traditional VPN tunnels could not scale to deliver consistent performance when entire workforces transitioned to remote work. As a result, they turned to full virtual desktop environments that keep applications and data within a centrally managed infrastructure while allowing secure access from any endpoint. Microsoft reported in its 2024 Work Trend Index that 68% of enterprises plan to maintain flexible work models, reinforcing the need for location-agnostic computing.[1]Microsoft, “Work Trend Index 2024,” microsoft.com Enterprises now evaluate virtual client computing platforms on their ability to sustain low-latency interactions, GPU-accelerated graphics, and unified identity policies across diverse devices. The capability to add or revoke users within minutes further aligns with dynamic staffing needs, strengthening the growth outlook for the virtual client computing software market.
Accelerated Shift Toward Cloud Desktop as a Service Consumption Models
Organizations favor predictable operating expenditure over hardware refresh cycles, pushing Desktop as a Service (DaaS) to the center of modernization roadmaps. Amazon Web Services reported a 47% surge in WorkSpaces usage in 2024, with customers citing rapid rollout and elastic scaling as top motivators, ahead of cost savings. The pay-as-you-go model enables enterprises to match desktop resources to seasonal demand, a benefit particularly suited for retail peaks and project-based teams. Cloud DaaS also shortens acquisition cycles because the provider bundles security, high availability, and compliance certifications into a single solution. Finally, multi-region footprints enable IT teams to deploy desktops near end users, thereby reducing latency without requiring on-premises build-outs. These benefits combine to lift the virtual client computing software market to double-digit growth through the forecast horizon.
Endpoint Security Compliance Requirements
Data governance rules such as the European Union’s NIS2 Directive mandate verifiable control over data access, making unmanaged endpoints a compliance risk. Virtual desktops keep regulated data within data center or sovereign cloud boundaries while granting users screen-pixel access only. Central logging captures every session for audit trails, enabling enterprises to satisfy regulatory requirements. Healthcare providers adopt virtual client computing to meet HIPAA guidelines when clinicians work from personal devices, ensuring that protected health information never resides on local devices. Similar motivations drive adoption across financial services, defense, and government. As more industries adopt zero-trust policies that assume a breach at the endpoint, virtual client computing solutions with embedded identity, conditional access, and multifactor authentication are gaining momentum.
Cost Optimization Initiatives Among Enterprises
Macroeconomic uncertainty continues to put pressure on IT budgets, prompting leaders to consolidate their distributed desktop fleets. Field research conducted by multiple industry associations indicates that centralized image management and automated patching can reduce IT support tickets by one-third compared to traditional laptops. Savings are achieved through reduced desk-side visits, lower theft risk, and longer refresh intervals for thin clients. When combined with pooled software licenses, many enterprises reallocate capital toward strategic analytics or cybersecurity instead. Subscription pricing also aligns costs with headcount, limiting stranded assets after workforce reductions. These fiscal advantages underpin the positive CAGR contribution assigned to cost optimization in the virtual client computing software market.
Restraints Impact Analysis*
| Restraint | (~) % Impact on CAGR Forecast | Geographic Relevance | Impact Timeline |
|---|---|---|---|
| Latency and bandwidth constraints in emerging markets | -1.8% | Asia Pacific emerging markets, Africa, Latin America | Medium term (2-4 years) |
| High upfront infrastructure costs for on-prem VDI | -1.2% | Global with higher impact in cost-sensitive markets | Short term (≤ 2 years) |
| Licensing complexity and vendor lock-in | -0.9% | Global with emphasis in multi-vendor environments | Long term (≥ 4 years) |
| Security breach concerns over multi-tenant DaaS | -0.7% | Global with regulatory focus in Europe and North America | Medium term (2-4 years) |
| Source: Mordor Intelligence | |||
Latency and Bandwidth Constraints in Emerging Markets
Reliable connectivity underpins user satisfaction with virtual desktops, yet many developing regions still face frequent outages and limited last-mile capacity. The International Telecommunication Union reported that 43% of businesses in lower-income nations encounter daily internet interruptions exceeding 30 minutes. Graphics-intensive workloads stall or disconnect under such conditions, harming productivity. Enterprises respond by retaining on-premises servers or delaying full cloud migration until fiber and 5G build-outs mature. Providers that insert edge appliances inside customer premises can alleviate some pain but raise total cost. Consequently, growth in the virtual client computing software market remains tempered in bandwidth-constrained geographies until infrastructure gaps close.
High Upfront Infrastructure Costs for On-Prem VDI
Self-hosted virtual desktop environments require significant investment in servers, storage arrays, GPU accelerators, and high-availability networking before delivering a return on investment. Cisco observed that most organizations require 18–24 months to break even on capital outlays, which is double the payback period for comparable cloud-hosted workspaces.[2] Cisco Systems, “Global Networking Trends Report 2024,” cisco.com Upfront licenses for hypervisor, connection broker, and monitoring tools compound the hurdle. Even with leasing options, finance teams often prefer deferring expenditure or tapping operational budgets through DaaS. As a result, VDI vendors are increasingly introducing consumption-based on-premises offerings to counteract this restraint.
*Our forecasts treat driver/restraint impacts as directional, not additive. The impact forecasts reflect baseline growth, mix effects, and variable interactions.
Segment Analysis
By Deployment Model: Cloud DaaS Gains Strategic Priority
Cloud-based Desktop as a Service (DaaS) captured a 52.37% revenue share within the virtual client computing software market in 2024, reflecting the rapid movement of enterprises toward operational expenditure models. The segment is forecast to expand at a 13.18% CAGR through 2030, as maturing security certifications and multi-region availability alleviate data-residency concerns. Consumption-based billing lets organizations spin up desktops for merger integration teams or seasonal retail staff within hours, an agility that on-premises stacks rarely match. Microsoft’s Windows 365 Government launch in 2024 expanded eligibility for public-sector workloads previously confined to data center VDI. On-premises deployments remain essential for defense, healthcare, and energy operators that must meet air-gapped or latency-sensitive requirements. Hybrid models bridge both worlds, allowing sensitive applications to stay local while burst capacity resides in the cloud.
Enterprises migrating legacy images often adopt a staged approach, starting with contractors or call-center groups before transitioning to knowledge workers. Service providers bundle endpoint management, identity, and help-desk support into fixed-price packages, trimming the staffing burden for customers with limited IT resources. Edge-based DaaS is emerging as a third path, deploying micro-data centers within manufacturing plants to guarantee sub-10 millisecond response for computer-aided-design tasks. Vendors differentiate on provisioning speed, GPU passthrough density, and integration with collaboration suites such as Teams and Zoom. As competition intensifies, price per desktop drops, further increasing the addressable pool of organizations considering cloud DaaS. The expanding footprint of cloud deployments ensures that the virtual client computing software market continues to favor providers with hyperscale infrastructure and strong channel partnerships.


By Organization Size: SMEs Close Capability Gaps
Large enterprises retained 70.32% revenue share of the virtual client computing software market in 2024, thanks to global footprints that demand standardized security postures. They deploy thousands of desktops across multiple regions, integrating virtual workspaces into identity and access management frameworks. However, small and medium enterprises are expected to deliver the highest 12.21% CAGR through 2030, as they leverage turnkey cloud bundles to sidestep capital constraints. Amazon WorkSpaces Core, introduced in 2024, targets organizations with fewer than 500 employees by pre-configuring network, directory, and backup settings. The approach removes the need for specialized virtualization staff and allows firms to pay only for active sessions.
SMEs embrace virtual desktops to recruit talent beyond commuting distance, a benefit previously limited to larger corporations. The model also supports cyber-insurance requirements by centralizing data storage and patch management. Managed service providers add further momentum by offering packaged security, device procurement, and 24×7 support wrapped into per-user fees. These offerings level the playing field, letting smaller firms participate in multinational supply chains that require stringent security attestations. As economies in Asia Pacific and Latin America produce a new cohort of digital-native startups, demand from the SME segment is set to underpin long-run expansion of the virtual client computing software industry.
By End-User Industry: Healthcare Outpaces Other Verticals
IT and telecom accounted for 19.61% of 2024 revenue in the virtual client computing software market, driven by early use cases such as software development sandboxes and multi-tenant support teams. Healthcare is projected to register the highest 13.60% CAGR through 2030, as hospitals and clinics extend telemedicine and electronic health record access to remote staff. The U.S. Department of Veterans Affairs scaled its virtual desktop infrastructure to support 180,000 clinicians and administrators in 2024, validating the feasibility of large-scale deployments in highly regulated environments.[3]U.S. Department of Veterans Affairs, “Virtual Desktop Expansion,” va.gov Virtual desktops keep patient data inside hardened data centers, simplifying HIPAA compliance when practitioners use personal tablets.
Financial institutions adopt virtualization to enforce data-loss prevention policies and aid in disaster recovery drills. Manufacturing leverages secure virtual desktops on ruggedized terminals to enable plant operators to monitor industrial IoT dashboards. Education utilizes multi-session Windows to access shared lab devices, while government agencies prioritize features that enhance sovereignty, such as local key management. As each vertical matures, vendors respond with compliance-ready blueprints and analytics tailored to domain workflows. This specialization deepens penetration and sustains revenue diversity across the virtual client computing software market.
By Technology: Identity-Centric Controls Accelerate
Virtual Desktop Infrastructure remained the foundation of deployments in 2024 with a 59.74% share, yet the fastest growth belongs to access management and monitoring tools projected at a 14.46% CAGR. Zero-trust mandates prompt enterprises to verify every user and device before granting access to applications. Okta’s 2024 State of Zero Trust Security study revealed that 78% of organizations intend to integrate identity-based access controls into virtual desktops within the next two years. Session recording and behavior analytics reveal anomalous activity in real time, closing visibility gaps that plagued early VDI pilots.
Application virtualization persists as a migration bridge for legacy software that cannot yet move to SaaS, enabling Windows-only apps to run on macOS or ChromeOS endpoints. Session-based virtualization supports task workers in healthcare and call centers at a lower resource cost per user. Container-based desktop delivery has entered the pilot phase, promising faster image rebuilds and simplified DevSecOps integration. GPU virtualization continues its evolution with multi-instance partitioning that lets four to eight knowledge workers share a single card without compromising graphics quality. These advances make identity-centric tooling inseparable from the broader technology stack, ensuring sustained demand across the virtual client computing software market.
Geography Analysis
North America accounted for 40.28% of the 2024 revenue in the virtual client computing software market. Enterprises in the United States and Canada demand FedRAMP-ready or SOC 2-certified services that integrate with existing identity and cloud security information event management platforms. The Canadian federal government mandated secure remote access for all civil servants by 2025, accelerating public-sector uptake. U.S. healthcare and financial regulators likewise favor virtualization because it simplifies breach notification and audit log retention. Commercial adoption is further bolstered by the abundance of hyperscale data centers, which provide sub-50 millisecond round-trip times to most population centers.
Asia Pacific records the fastest 13.19% CAGR for the virtual client computing software market through 2030. Governments fund digital nation programs that prioritize virtual desktops to enhance service delivery and workforce flexibility. Singapore earmarked USD 1.2 billion in 2024 for cloud-aligned citizen services, including virtual desktops for public agencies.[4]Government Technology Agency Singapore, “Smart Nation Digital Infrastructure Investment,” tech.gov.sg Japanese manufacturers deploy GPU-accelerated VDI to allow aging engineers to consult remotely. Chinese enterprises invest in domestic virtualization stacks to meet data-localization mandates, while Indian IT outsourcers adopt cloud DaaS to supply secure developer environments for global clients. Telcos in South Korea and Australia bundle 5G-edge VDI for architects and media producers requiring real-time rendering, broadening sector appeal.
Europe exhibits steady but regulated growth. GDPR compels organizations to keep data within the European Economic Area or approved countries, making the location of cloud regions a decisive factor. Energy-efficiency directives push firms to consolidate desktops into data centers that can be powered by renewable sources. Germany’s automotive sector uses virtual desktops for secure access to production line dashboards, and the United Kingdom’s finance sector integrates virtualization into resilience planning scenarios. The European Commission’s Digital Decade policy targets 75% enterprise cloud adoption by 2030, indirectly boosting the virtual client computing software market. Southern European nations follow suit as pandemic recovery funds subsidize school and healthcare modernization. Emerging regions in South America, the Middle East, and Africa begin pilots but still face bandwidth and cost obstacles that limit scale in the near term.

Competitive Landscape
The virtual client computing software market features a blend of diversified platform giants and niche innovators. Microsoft capitalizes on its Microsoft 365 ecosystem by embedding Windows 365 desktops inside Teams, OneDrive, and Azure Active Directory. VMware emphasizes hybrid freedom, allowing customers to burst workloads from vSphere clusters to VMware Cloud on AWS or Azure VMware Solution without re-architecting images. Citrix, now reinforced by its Lakeside Software acquisition, markets automated user-experience analytics that remediate issues before employees open support tickets. Amazon Web Services scales WorkSpaces across fifteen global regions, courting defense and public-sector deals with its GovCloud enclaves. Google Cloud joined the fray through a USD 600 million partnership with Parallels to serve small businesses seeking simplicity.
Specialized vendors focus on vertical compliance or emerging architectures. IGEL ships secure Linux-based thin-client firmware with zero-trust network access baked in, attracting healthcare and finance customers wary of device tampering. Stratodesk promotes hardware-agnostic endpoint OS images that extend the life of existing PCs. Red Hat promotes container-native virtualization that integrates seamlessly into Kubernetes pipelines, appealing to DevOps teams. In the GPU domain, NVIDIA partners with VMware and Nutanix to enable AI-driven workload placement that minimizes frame-drop incidents. Start-ups building browser-based desktop delivery and streaming protocols continue to enter, lured by opportunities to strip out hypervisor layers and cut cost.
Competitive dynamics increasingly emphasize customer success metrics such as log-in time, frames per second, and compliance-audit pass rates rather than raw virtual machine density. Vendors that integrate endpoint analytics, self-heal configuration drifts, and expose REST APIs for workflow automation command premium pricing. Strategic alliances with telecom operators for 5G edge nodes and with identity-as-a-service platforms for single sign-on are common. Although no single firm holds more than 25% global share, the top five players collectively exceed 60%, signaling moderate concentration. Continuous innovation in AI-powered optimization, container conversion, and sovereign-cloud controls will shape the next phase of differentiation in the virtual client computing software market.
Virtual Client Computing Software Industry Leaders
VMware Inc.
Citrix Systems Inc.
Microsoft Corporation
Amazon Web Services Inc.
Nutanix Inc.
- *Disclaimer: Major Players sorted in no particular order

Recent Industry Developments
- September 2025: Microsoft committed USD 3.2 billion to expand Azure Virtual Desktop capacity across Japan, South Korea, and Australia, adding GPU-accelerated instances for design and engineering workloads.
- August 2025: VMware and NVIDIA embedded AI-powered workload optimization into vSphere VDI, enabling predictive resource allocation for consistent frame rates.
- July 2025: Amazon Web Services won a USD 1.8 billion U.S. Department of Defense contract to deliver secure virtual desktops to 500,000 personnel worldwide via AWS GovCloud.
- June 2025: Citrix acquired Lakeside Software for USD 1.1 billion, integrating proactive user-experience analytics into its desktop platform.


Global Virtual Client Computing Software Market Report Scope
| On-Premises |
| Cloud - Desktop as a Service (DaaS) |
| Hybrid |
| Small and Medium Enterprises |
| Large Enterprises |
| IT and Telecom |
| BFSI |
| Healthcare |
| Education |
| Government |
| Manufacturing |
| Retail and eCommerce |
| Other End-User Industries |
| Virtual Desktop Infrastructure (VDI) |
| Application Virtualization |
| Session Virtualization / Terminal Services |
| Access Management and Monitoring |
| North America | United States |
| Canada | |
| Mexico | |
| South America | Brazil |
| Argentina | |
| Rest of South America | |
| Europe | Germany |
| United Kingdom | |
| France | |
| Italy | |
| Spain | |
| Russia | |
| Rest of Europe | |
| Asia Pacific | China |
| Japan | |
| India | |
| South Korea | |
| Australia and New Zealand | |
| Rest of Asia Pacific | |
| Middle East | Saudi Arabia |
| United Arab Emirates | |
| Turkey | |
| Rest of Middle East | |
| Africa | South Africa |
| Nigeria | |
| Kenya | |
| Rest of Africa |
| By Deployment Model | On-Premises | |
| Cloud - Desktop as a Service (DaaS) | ||
| Hybrid | ||
| By Organization Size | Small and Medium Enterprises | |
| Large Enterprises | ||
| By End-User Industry | IT and Telecom | |
| BFSI | ||
| Healthcare | ||
| Education | ||
| Government | ||
| Manufacturing | ||
| Retail and eCommerce | ||
| Other End-User Industries | ||
| By Technology | Virtual Desktop Infrastructure (VDI) | |
| Application Virtualization | ||
| Session Virtualization / Terminal Services | ||
| Access Management and Monitoring | ||
| By Geography | North America | United States |
| Canada | ||
| Mexico | ||
| South America | Brazil | |
| Argentina | ||
| Rest of South America | ||
| Europe | Germany | |
| United Kingdom | ||
| France | ||
| Italy | ||
| Spain | ||
| Russia | ||
| Rest of Europe | ||
| Asia Pacific | China | |
| Japan | ||
| India | ||
| South Korea | ||
| Australia and New Zealand | ||
| Rest of Asia Pacific | ||
| Middle East | Saudi Arabia | |
| United Arab Emirates | ||
| Turkey | ||
| Rest of Middle East | ||
| Africa | South Africa | |
| Nigeria | ||
| Kenya | ||
| Rest of Africa | ||


Key Questions Answered in the Report
What is the current value of the virtual client computing software market?
The market stands at USD 7.12 billion in 2025 and is projected to reach USD 12.36 billion by 2030.
Which deployment model is growing fastest?
Cloud-based Desktop as a Service is expanding at 13.18% CAGR through 2030.
Why are healthcare organizations accelerating adoption?
Telemedicine rollouts and strict HIPAA compliance requirements make centralized virtual desktops an efficient way to protect patient data.
Which region offers the strongest growth outlook?
Asia Pacific leads with a forecast 13.19% CAGR, driven by government digital initiatives and expanding 5G coverage.
How do virtual desktops improve security compliance?
They keep regulated data in secure data centers, enforce identity-based access, and generate detailed audit logs needed for regulations such as NIS2 and HIPAA.
Page last updated on:


