Web3 Market Size and Share
Market Overview
| Study Period | 2020 - 2031 |
|---|---|
| Market Size (2026) | USD 4.97 Billion |
| Market Size (2031) | USD 29.97 Billion |
| Growth Rate (2026 - 2031) | 43.21% CAGR |
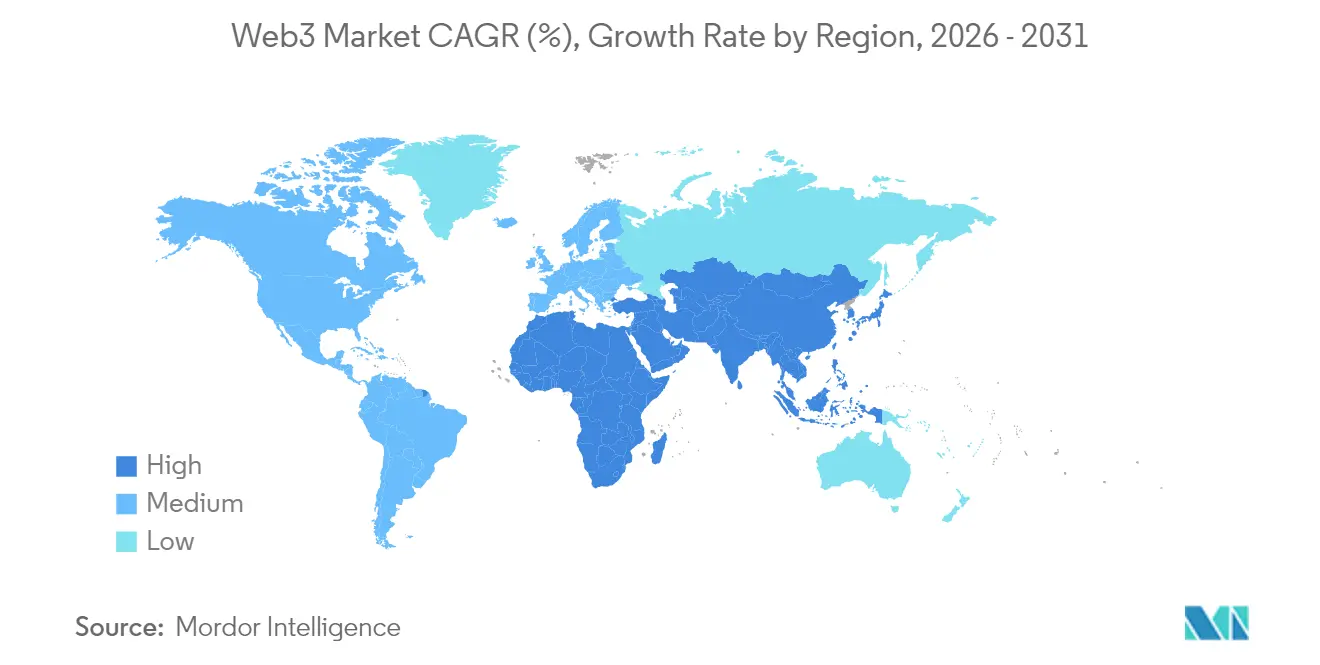
| Fastest Growing Market | Asia Pacific |
| Largest Market | North America |
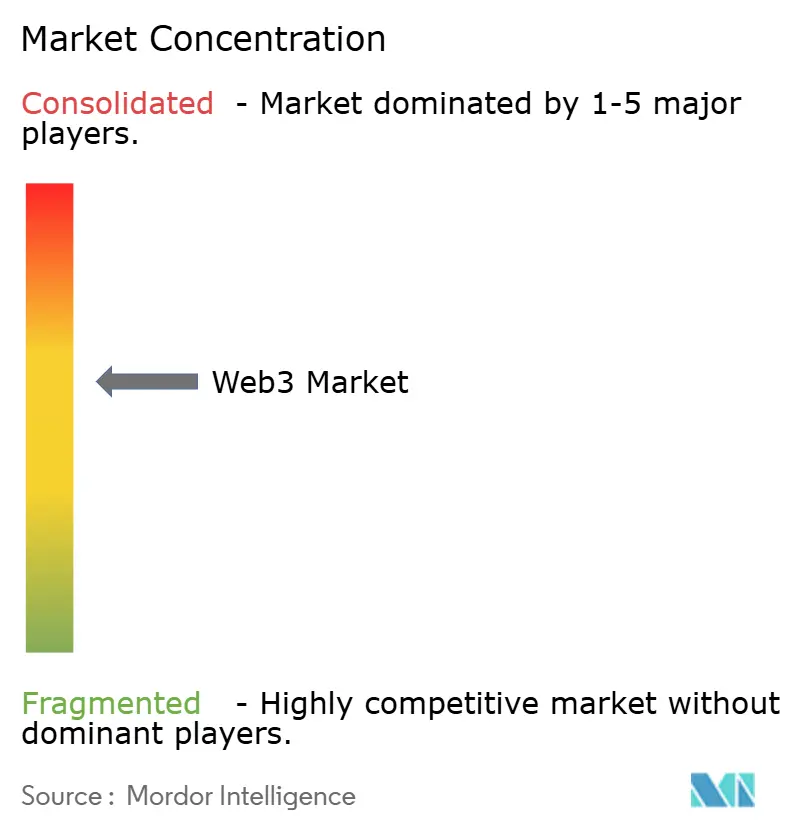
| Market Concentration | Medium |
Major Players *Disclaimer: Major Players sorted in no particular order Image © Mordor Intelligence. Reuse requires attribution under CC BY 4.0. | |
Web3 Market Analysis by Mordor Intelligence
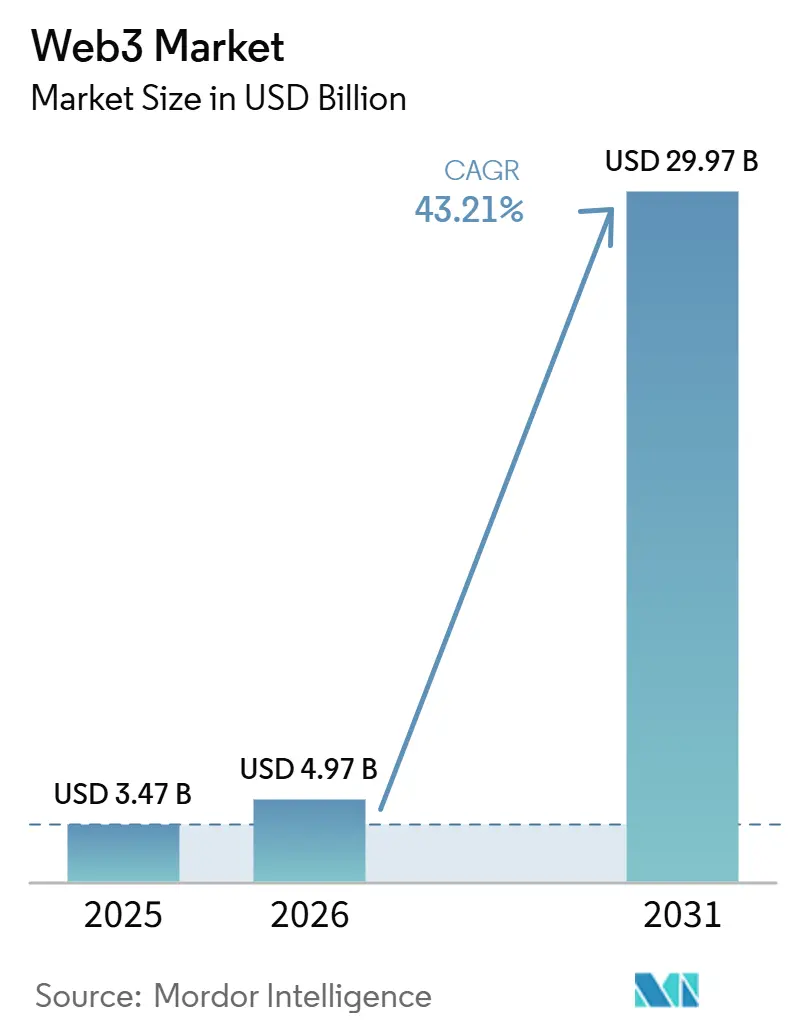
The Web3 Market size is projected to expand from USD 3.47 billion in 2025 and USD 4.97 billion in 2026 to USD 29.97 billion by 2031, registering a CAGR of 43.21% between 2026 to 2031.
Rapid scaling reflects the shift of blockchain from proofs-of-concept to core enterprise systems, stronger regulatory frameworks in G20 economies, and maturing developer tooling. Institutional players deploy blockchain for real-time settlement, tokenized assets, and digital identity, pushing spending from piloting budgets into mainstream IT allocations. Cost-efficient Layer-2 networks have removed critical barriers, while zero-knowledge proofs unlock privacy-preserving use cases. Venture investment remains robust, yet acquisitions by technology incumbents point to rising consolidation as platforms race to secure developer loyalty.
Key Report Takeaways
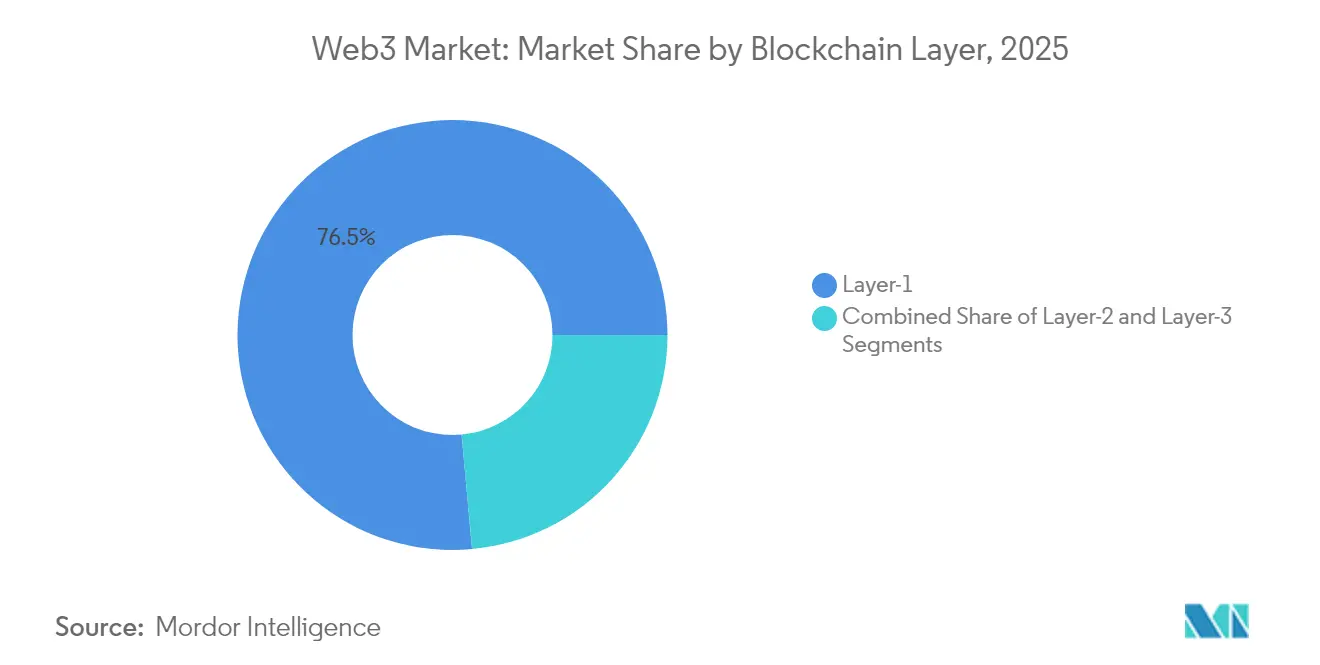
- By blockchain layer, Layer-1 protocols controlled 76.45% Web3 market share in 2025, whereas Layer-3 architectures are projected to compound at 46.40% CAGR to 2031.
- By application, cryptocurrency payments and exchanges held 65.05% of the Web3 market size in 2025, while decentralized finance is forecast to post a 44.00% CAGR through 2031.
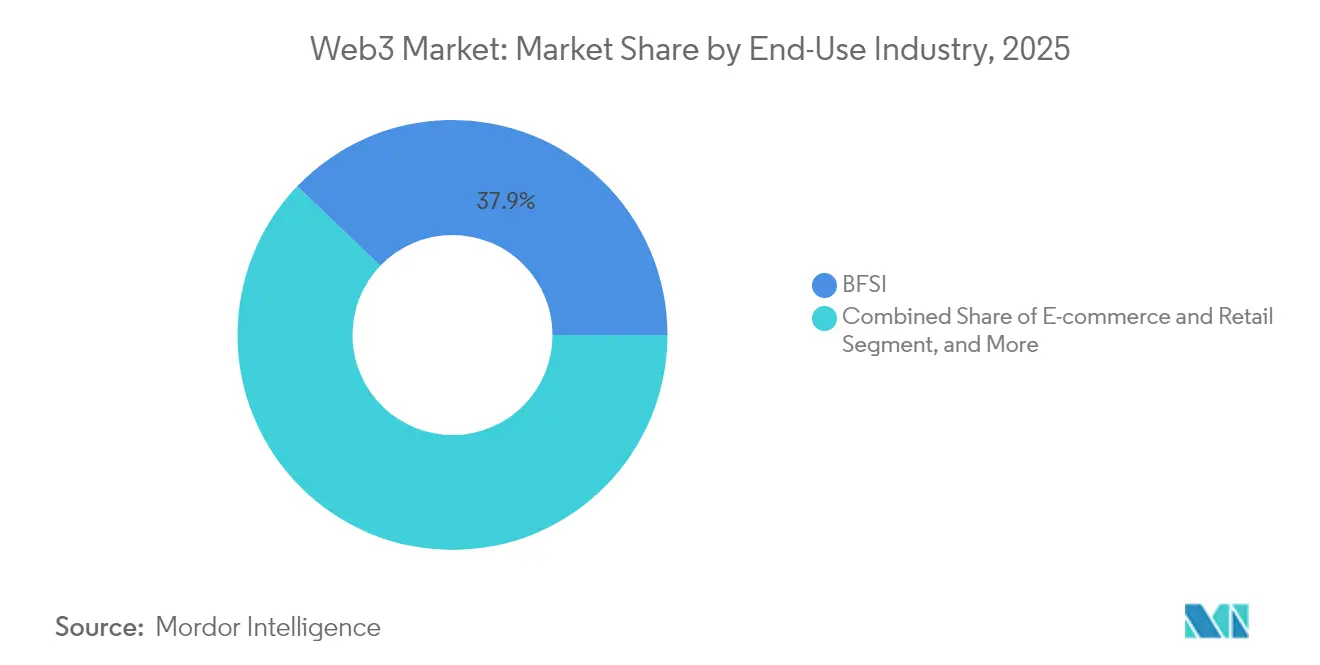
- By end-use industry, banking, financial services, and insurance commanded 37.85% Web3 market share in 2025; e-commerce and retail are set to grow the fastest at 45.00% CAGR up to 2031.
- By deployment model, public permissionless chains accounted for 83.55% of the Web3 market size in 2025, yet consortium and hybrid chains will expand at 45.20% CAGR over the forecast period.
- By geography, North America led with 39.05% revenue share in 2025, whereas Asia-Pacific is projected to increase at a 45.90% CAGR through 2031.
Note: Market size and forecast figures in this report are generated using Mordor Intelligence’s proprietary estimation framework, updated with the latest available data and insights as of 2026.
Global Web3 Market Trends and Insights
Drivers Impact Analysis*
| Driver | (~) % Impact on CAGR Forecast | Geographic Relevance | Impact Timeline |
|---|---|---|---|
| Rising enterprise blockchain adoption | +8.2% | Global; strong in North America and Europe | Medium term (2-4 years) |
| Surge in DeFi and NFT transactions | +7.1% | Global; led by Asia-Pacific and North America | Short term (≤ 2 years) |
| Growing regulatory clarity in G20 economies | +6.8% | Global; early gains in EU, Singapore, Japan | Long term (≥ 4 years) |
| Layer-2 scaling cuts transaction costs | +9.3% | Global; most felt on Ethereum | Short term (≤ 2 years) |
| Government rollout of decentralized IDs | +5.4% | North America, EU, Brazil | Long term (≥ 4 years) |
| Composable AI agents in blockchain stacks | +4.7% | Major technology hubs | Medium term (2-4 years) |
| Source: Mordor Intelligence | |||
Rising Enterprise Blockchain Adoption
Global corporations now deploy blockchain for supply-chain, settlement, and identity, transitioning from pilots to production. Coinbase captured USD 2.03 billion institutional revenue in Q1 2025, confirming the scale of corporate demand for compliant crypto rails [1]Coinbase, “Q1 2025 Shareholder Letter,” coinbase.com. JPMorgan’s Onyx platform extends beyond internal transfers, offering tokenized settlement to clients, while California’s DMV digitized 42 million car titles on Avalanche, illustrating government use cases. Mature APIs reduce integration costs, and enterprise middleware abstracts protocol complexity, allowing traditional IT teams to onboard blockchain safely.
Surge in DeFi and NFT Transactions
Institutional allocations above USD 100 billion flowed into DeFi during 2024 as asset managers tokenized funds and provided liquidity, stabilizing yields. NFT volumes rebounded in 2025 on utility-driven programs by brands such as Nike, integrating tokens into loyalty ecosystems. Cross-pollination of DeFi and NFTs underpins new products like NFT-collateralized loans, broadening the Web3 market addressable base. Account abstraction and gasless transactions elevate user experience, driving retail participation.
Growing Regulatory Clarity in G20 Economies
The European Union’s Markets in Crypto-Assets regulation offers unified licensing and operational rules, mitigating compliance ambiguity. Japan’s tax reforms and sandboxes court blockchain innovators, while Singapore provides a clear custody and token issuance framework [2]Monetary Authority of Singapore, “Digital Asset Framework,” mas.gov.sg. Such certainty shortens enterprise sales cycles and encourages long-term capital expenditure on blockchain infrastructure.
Layer-2 Scaling Cuts Transaction Costs
Ethereum rollups processed over 1.3 billion transactions in the past year, trimming gas fees by up to 90% while inheriting Layer-1 security. Polygon’s AggLayer unifies liquidity across chains, easing composability. Lower fees transform use cases—micropayments, gaming, and social interactions—previously blocked by cost, making blockchain viable for frequent-volume traffic.
Restraints Impact Analysis*
| Restraint | (~) % Impact on CAGR Forecast | Geographic Relevance | Impact Timeline |
|---|---|---|---|
| Evolving multi-jurisdictional compliance | -5.8% | Global; highest in cross-border operations | Long term (≥ 4 years) |
| High-profile smart-contract exploits | -4.2% | Global; concentrated in DeFi protocols | Short term (≤ 2 years) |
| ESG-driven energy-consumption scrutiny | -3.1% | Global; focus on proof-of-work networks | Medium term (2-4 years) |
| Reliance on limited infrastructure gateways | -2.9% | Global; developer platforms | Medium term (2-4 years) |
| Source: Mordor Intelligence | |||
Evolving Multi-Jurisdictional Compliance Burden
Disparate data-protection, tax, and securities rules oblige firms to tailor deployments country by country, inflating legal overheads. GDPR’s erasure provisions collide with blockchain immutability, forcing technical workarounds such as off-chain storage pointers. Smaller providers struggle to fund compliance, widening the gap between incumbents and start-ups.
High-Profile Smart-Contract Exploits
Repeated protocol hacks erode institutional confidence and prompt stricter oversight. The audit talent shortage and rapid code pushes heighten vulnerability exposure. Limited insurance capacity further constrains fiduciary-bound institutions, tempering DeFi capital inflows until robust security frameworks mature.
*Our forecasts treat driver/restraint impacts as directional, not additive. The impact forecasts reflect baseline growth, mix effects, and variable interactions.
Segment Analysis
By Blockchain Layer: Enterprise Focus Shifts Toward Layer-3 Customization
Layer-1 chains retained 76.45% revenue in 2025, yet Layer-3 solutions now record a 46.40% CAGR. The Web3 market size for specialized Layer-3 chains is expected to expand rapidly as firms seek tailored governance and compliance features. Bitcoin remains the dominant value store, while Ethereum’s proof-of-stake model supports complex smart-contract logic. Solana’s high throughput attracts gaming platforms, though its past network outages limit regulated-sector uptake. Avalanche and Cardano pursue sector-specific rollouts, including government registries and academic pilots. Continued demand for customization underscores why Layer-3 design is outpacing generic Layer-2 scaling in enterprise roadmaps.
Demand for seamless liquidity drives projects like Polygon’s AggLayer, which combines multiple execution layers into one ecosystem, lowering developer fragmentation. Alchemy supports more than 1 million smart accounts across Layer-1 and Layer-2 networks, enabling rapid experimentation. The Web3 market is therefore bifurcating: one track optimizes global decentralization, the other maximizes sector fit via nested chains.


By Application: DeFi Institutions Anchor Growth Momentum
Cryptocurrency payments and exchanges commanded 65.05% of the Web3 market size in 2025 as stablecoins became the de-facto digital settlement layer. Decentralized finance follows with the highest 44.00% CAGR, led by tokenized treasuries, on-chain repo, and yield strategies attractive to cash-rich corporates. Protocol integrations by PayPal and Stripe into traditional checkout flows signal mainstream payment acceptance. NFT platforms have moved from collectibles to verification tools in ticketing, luxury goods, and fan engagement.
Web3 gaming introduces player-owned asset models, though regulatory clarity on token classification remains a gating factor. Supply-chain provenance systems relied on blockchain to track pharmaceuticals and food safety, drawing interest from Walmart and leading drug manufacturers. As account abstraction reduces mnemonic-based onboarding, consumer apps see conversion improvements, broadening Web3 market penetration.
By End-Use Industry: Retail Overtakes Early Financial Leads
Banking, financial services, and insurance represented 37.85% Web3 market share in 2025, leveraging blockchain for cross-border settlement and regulatory reporting. Retail and e-commerce, however, are poised to climb at a 45.00% CAGR as token-based loyalty and direct creator commerce grow in popularity. Nike’s NFT-enabled loyalty platform illustrates how brands merge physical and digital engagement within their consumer strategies.
Media, sports, and entertainment exploit NFTs and fan tokens to sustain audience interaction and open fresh revenue streams. Healthcare pilots examine patient-owned data vaults and drug traceability, though stringent privacy laws slow broad deployment. Government agencies—such as the U.S. Customs and Border Protection—adopt Decentralized Identifiers, indicating future administrative digitization paths.
By Deployment Model: Hybrid Chains Balance Governance and Openness
Public permissionless networks held 83.55% of the Web3 market size in 2025, underpinning DeFi and consumer applications. Hybrid and consortium chains will outpace pure public growth, expanding at 45.20% CAGR as enterprises blend transparency with participant controls. The model leverages public settlement layers while confining sensitive data to permissioned execution, satisfying governance and audit demands.
Cross-chain bridges and interoperability standards reduce vendor lock-in, letting firms combine multiple deployment models to optimize cost, performance, and compliance. AWS and Microsoft now offer managed blockchain services that integrate with both permissioned and permissionless stacks, making hybrid adoption easier for corporate IT teams. This flexibility sustains momentum in the Web3 market as regulatory scrutiny rises.
Geography Analysis
North America contributed 39.05% of 2025 revenue due to robust venture funding, deep developer talent, and enterprise blockchain initiatives. Coinbase’s USD 2.03 billion institutional revenue highlights liquidity concentration, while AWS’s managed blockchain services offer familiar deployment environments for corporate clients. California’s DMV blockchain rollout demonstrates government appetite for decentralized registries, reinforcing regional leadership.
Asia-Pacific is the fastest-growing Web3 market, forecast to rise at 45.90% CAGR. Singapore’s licensing regime and investment incentives attract exchanges and custodians, creating an innovation nucleus. Japan’s tax relief and national Web3 roadmap spurred Sony’s USD 3.5 million stake in Startale Labs, validating corporate commitment . India and Indonesia rank first and third globally for crypto adoption volumes, underlining massive consumer bases for forthcoming applications.
Europe benefits from MiCA-driven regulatory certainty. The framework aligns with blockchain’s emphasis on user control over data, encouraging identity and privacy products tailored to GDPR. South America pilots decentralized IDs in Brazil and explores remittance solutions in Mexico. The Middle East and Africa focus on financial inclusion and CBDC research, though fragmented rules temper near-term scaling.

Competitive Landscape
The Web3 market shows moderate fragmentation with early consolidation. Infrastructure specialists such as Alchemy streamline developer operations across multiple chains, while AWS embeds blockchain modules into cloud portfolios, ensuring sticky enterprise demand. Stripe’s USD 1.1 billion acquisition of Bridge reveals how fintech incumbents accelerate time-to-market through M&A.
Three strategic archetypes dominate competition. Pure-play blockchain firms, including ConsenSys and Polygon Labs, iterate core protocols. Technology majors, led by AWS and Microsoft, integrate blockchain as a service within existing cloud infrastructure. Meanwhile, financial institutions like JPMorgan build proprietary solutions for client settlement, often on private or consortium networks.
White-space lies in cross-chain interoperability, AI-augmented developer tooling, and sector-specific compliance layers. Zero-knowledge proof vendors target privacy-sensitive industries, anticipating stricter data regulations. Government adoption of W3C standards for decentralized identifiers encourages interoperability, shaping vendor roadmaps and reinforcing open-standard alignment.
Web3 Industry Leaders
Binance Holdings Ltd.
Coinbase Global Inc.
ConsenSys Software Inc.
Polygon Labs Ltd.
Chainlink Labs Ltd.
- *Disclaimer: Major Players sorted in no particular order

Recent Industry Developments
- June 2025: FIFA launched a dedicated blockchain using Avalanche Subnet technology, enabling full control over digital collectibles, games, and fan platforms.
- June 2025: Aptos Labs and Jump Crypto introduced a cloud-based storage network for Web3 and decentralized applications.
- June 2025: Spekter Games Inc. raised USD 5 million pre-seed funding led by a16z speedrun and launched its debut title, Spekter Agency.
- January 2025: Sony unveiled a blockchain-centric Web3 solution and invested USD 3.5 million in Startale Labs.


Global Web3 Market Report Scope
Web 3.0, also referred to as Web3, represents the third generation of the World Wide Web. It is characterized by its decentralized nature, universal accessibility, and foundation in blockchain technologies. Web 3.0 builds upon developments in the Semantic Web, which envisions the internet as a network of meaningfully interconnected data. This new iteration aims to create a more open and user-centric online environment, utilizing a bottom-up design approach.
The Web3 market is segmented by application (cryptocurrency, conversational AI, data and transaction storage, payments, smart contract, others), by end user (BFSI, e-commerce and retail, media and entertainment, healthcare and pharmaceutical, IT and telecom, others) and by geography (North America [United States, Canada], Europe [Germany, United Kingdom, France], Asia Pacific [China, India, Japan], Latin America [Brazil, Mexico], Middle East and Africa [Saudi Arabia, UAE, South Africa]). The report offers market forecasts and size in value (USD) for all the above segments.
| Layer-1 |
| Layer-2 |
| Layer-3 |
| Cryptocurrency Payments and Exchange |
| Decentralised Finance (DeFi) |
| NFTs and Digital Collectibles |
| Web3 Gaming and Metaverse |
| Social and Creator Economy |
| Supply-chain and Provenance |
| Identity and Privacy |
| BFSI |
| E-commerce and Retail |
| Media, Entertainment and Sports |
| Healthcare and Life Sciences |
| IT and Telecom |
| Government and Public Sector |
| Public / Permissionless Chains |
| Private / Permissioned Chains |
| Consortium / Hybrid Chains |
| North America | United States | |
| Canada | ||
| Mexico | ||
| South America | Brazil | |
| Argentina | ||
| Rest of South America | ||
| Europe | Germany | |
| United Kingdom | ||
| France | ||
| Italy | ||
| Spain | ||
| Russia | ||
| Rest of Europe | ||
| Asia-Pacific | China | |
| Japan | ||
| India | ||
| South Korea | ||
| Australia and New Zealand | ||
| Rest of Asia-Pacific | ||
| Middle East and Africa | Middle East | Saudi Arabia |
| United Arab Emirates | ||
| Turkey | ||
| Rest of Middle East | ||
| Africa | South Africa | |
| Nigeria | ||
| Egypt | ||
| Rest of Africa | ||
| By Blockchain Layer | Layer-1 | ||
| Layer-2 | |||
| Layer-3 | |||
| By Application | Cryptocurrency Payments and Exchange | ||
| Decentralised Finance (DeFi) | |||
| NFTs and Digital Collectibles | |||
| Web3 Gaming and Metaverse | |||
| Social and Creator Economy | |||
| Supply-chain and Provenance | |||
| Identity and Privacy | |||
| By End-use Industry | BFSI | ||
| E-commerce and Retail | |||
| Media, Entertainment and Sports | |||
| Healthcare and Life Sciences | |||
| IT and Telecom | |||
| Government and Public Sector | |||
| By Deployment Model | Public / Permissionless Chains | ||
| Private / Permissioned Chains | |||
| Consortium / Hybrid Chains | |||
| Geography | North America | United States | |
| Canada | |||
| Mexico | |||
| South America | Brazil | ||
| Argentina | |||
| Rest of South America | |||
| Europe | Germany | ||
| United Kingdom | |||
| France | |||
| Italy | |||
| Spain | |||
| Russia | |||
| Rest of Europe | |||
| Asia-Pacific | China | ||
| Japan | |||
| India | |||
| South Korea | |||
| Australia and New Zealand | |||
| Rest of Asia-Pacific | |||
| Middle East and Africa | Middle East | Saudi Arabia | |
| United Arab Emirates | |||
| Turkey | |||
| Rest of Middle East | |||
| Africa | South Africa | ||
| Nigeria | |||
| Egypt | |||
| Rest of Africa | |||


Key Questions Answered in the Report
What is the projected value of the Web3 market by 2031?
The market is forecast to reach USD 29.97 billion by 2031, reflecting a 43.21% CAGR over the 2026-2031 period.
Which blockchain layer is expanding the quickest?
Layer-3 chains are the fastest‐growing layer, poised to compound at 46.40% CAGR as enterprises seek application-specific governance and compliance features.
Why is decentralized finance (DeFi) central to Web3 growth?
Institutional capital exceeding USD 100 billion flowed into DeFi protocols in 2024, driving yield products and tokenized assets that anchor long-term liquidity.
How are enterprises addressing blockchain transaction costs?
Adoption of Ethereum rollups and other Layer-2 scaling solutions has cut gas fees by up to 90%, enabling cost-effective, high-volume use cases.
Page last updated on:


