Web Development Market Size and Share
Market Overview
| Study Period | 2020 - 2031 |
|---|---|
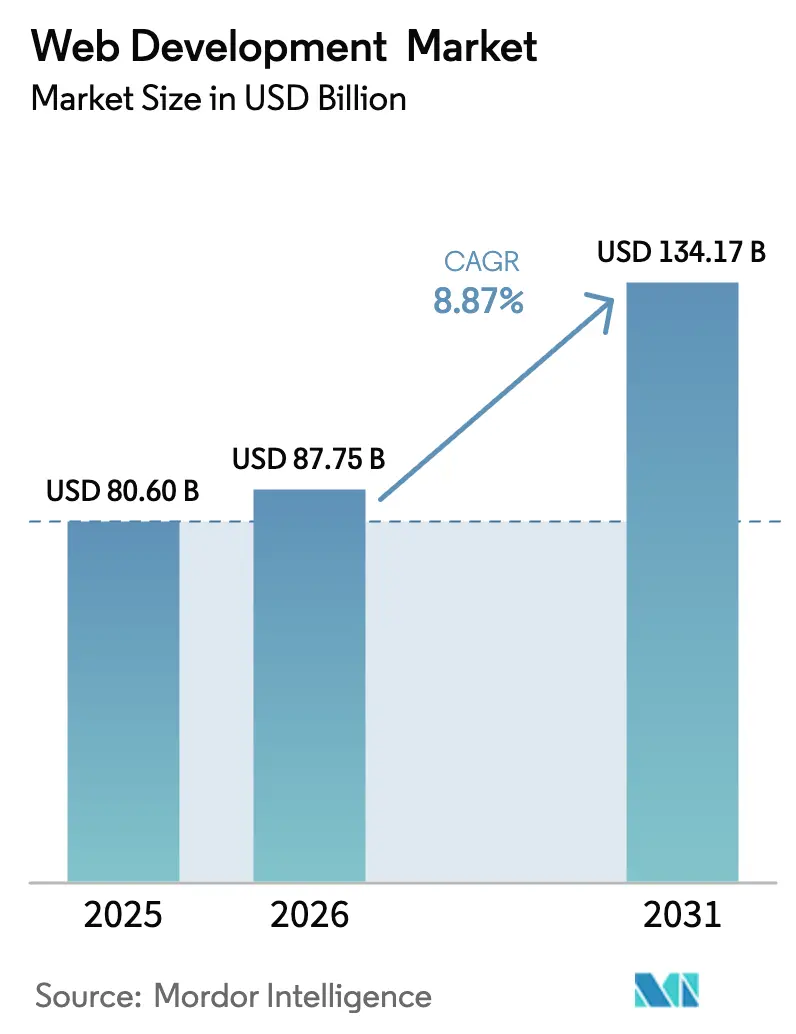
| Market Size (2026) | USD 87.75 Billion |
| Market Size (2031) | USD 134.17 Billion |
| Growth Rate (2026 - 2031) | 8.87% CAGR |
| Fastest Growing Market | Asia Pacific |
| Largest Market | North America |
| Market Concentration | Low |
Major Players*Disclaimer: Major Players sorted in no particular order Image © Mordor Intelligence. Reuse requires attribution under CC BY 4.0. |
|
Web Development Market Analysis by Mordor Intelligence
The web development services market size was valued at USD 80.6 billion in 2025 and estimated to grow from USD 87.75 billion in 2026 to reach USD 134.17 billion by 2031, at a CAGR of 8.87% during the forecast period (2026-2031). Continuous digital-transformation mandates, rising cloud adoption, and the need to embed generative-AI features directly inside customer-facing portals keep budgets resilient despite broader cost controls. Large enterprises are prioritizing composable and headless architectures to shorten release cycles, while small firms use low-code platforms to close capability gaps without adding full-time developers. The accelerating shift from desktop to mobile, backed by stricter accessibility and privacy rules, is also steering investments toward performance-centric frameworks that deliver fast, standards-compliant experiences. Finally, value-chain collaborations between hyperscale cloud vendors and global systems integrators are amplifying service depth, giving buyers one-stop access to strategy, build, and manage offerings within the web development services market.[1]Tata Consultancy Services, “TCS Bets Big on Azure Open AI: Plans to Train 25,000 Engineers,” tcs.com
Key Report Takeaways
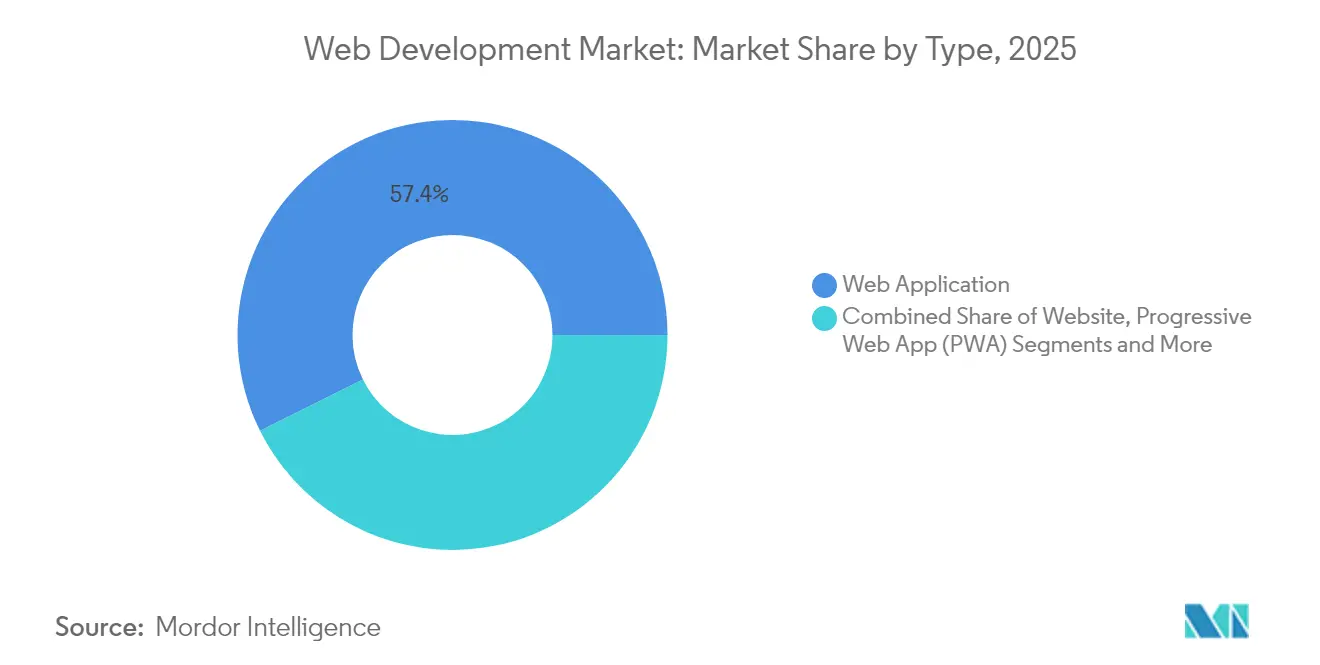
- By type, web applications led with 57.35% of web development services market share in 2025; Progressive Web Apps are growing the fastest at 13.45% CAGR to 2031.
- By deployment model, cloud-based solutions held 69.20% of the web development services market size in 2025, while serverless architectures post the top CAGR at 18.10% through 2031.
- By enterprise size, large enterprises controlled 62.40% share in 2025, yet small and medium enterprises expand at an 10.85% CAGR on rising low-code adoption.
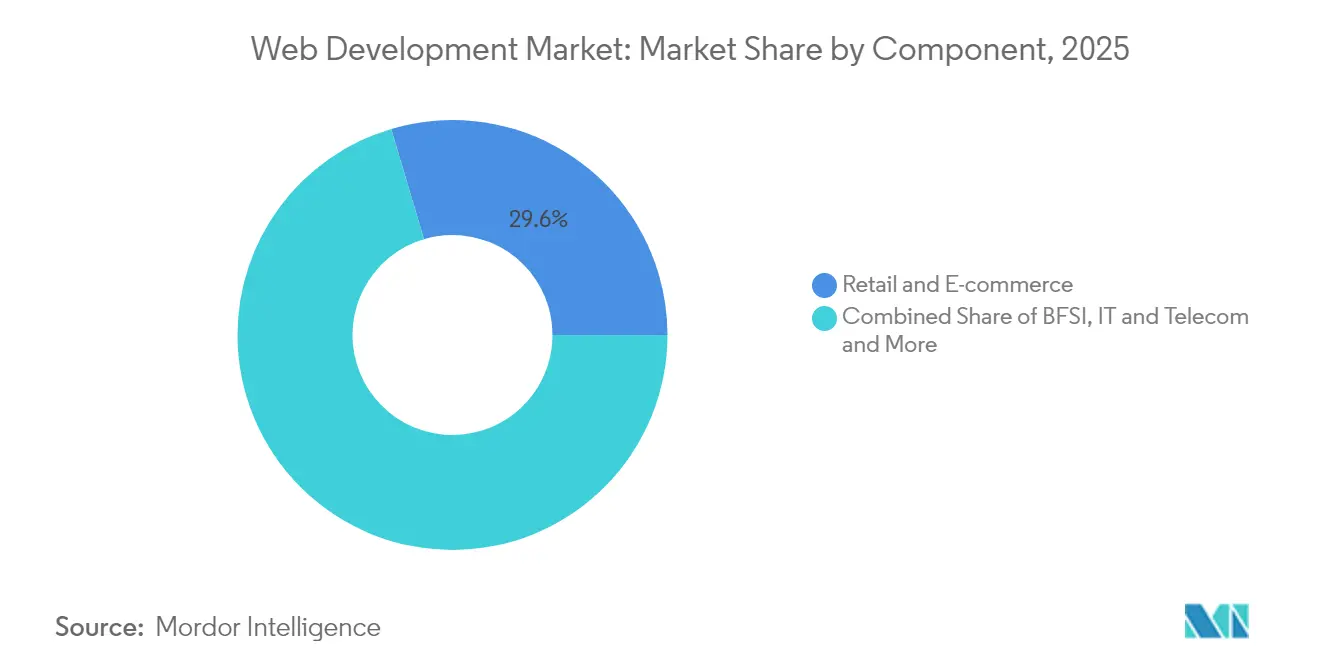
- By end-user vertical, retail and e-commerce commanded a 29.60% slice of the market in 2025; healthcare is the fastest-advancing customer group at 14.05% CAGR out to 2031.
- By technology stack, React-based front-ends owned 32.50% share in 2025, whereas headless CMS tools advance at 15.45% CAGR as firms seek composable delivery models.
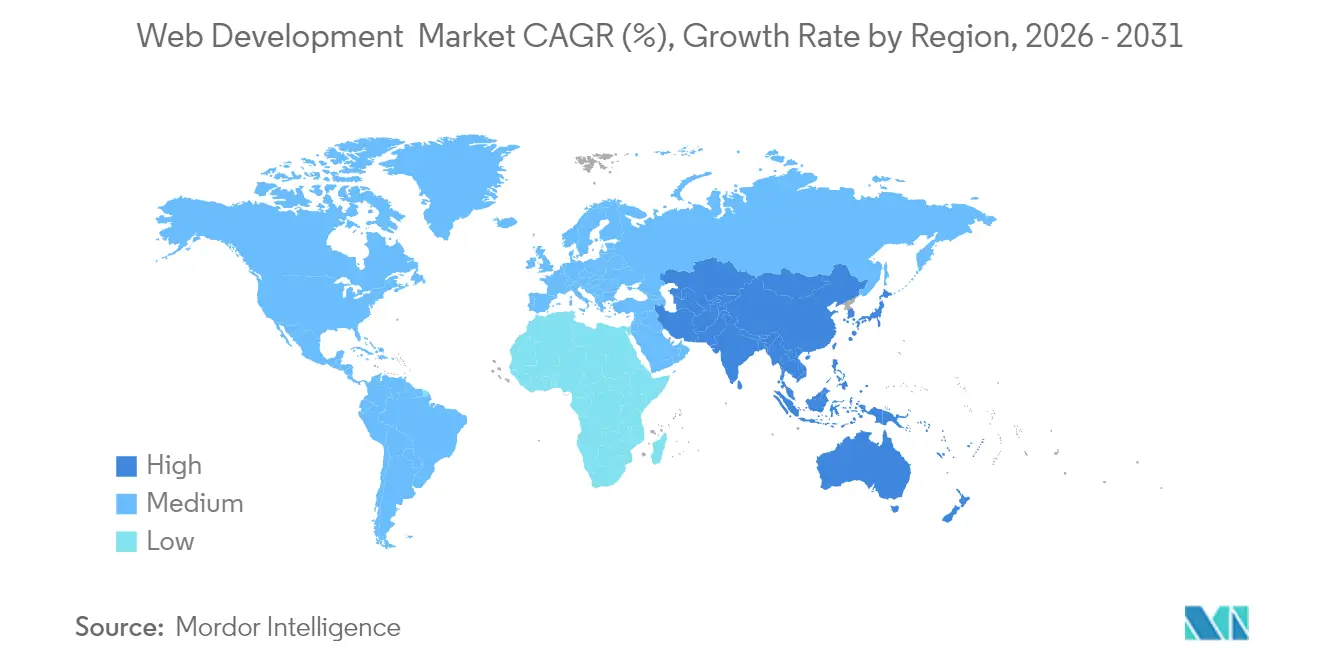
- By geography, North America captured 39.40% of market revenue in 2025, but Asia-Pacific registers the quickest regional expansion at 17.05% CAGR thanks to hyperscale data-center buildouts.
Note: Market size and forecast figures in this report are generated using Mordor Intelligence’s proprietary estimation framework, updated with the latest available data and insights as of 2026.
Global Web Development Market Trends and Insights
Drivers Impact Analysis*
| Driver | ( ~ ) % Impact on CAGR Forecast | Geographic Relevance | Impact Timeline |
|---|---|---|---|
| E-commerce and omnichannel boom | +2.1% | Worldwide; especially North America and Asia-Pacific | Medium term (2-4 years) |
| Enterprise digital-transformation budgets | +1.8% | Predominantly North America and Europe | Long term (≥ 4 years) |
| Mobile-first and PWA adoption | +1.5% | Global, fastest in emerging Asia-Pacific | Short term (≤ 2 years) |
| AI-powered chatbots and personalization | +1.4% | North America and Europe core, spreading to Asia-Pacific | Medium term (2-4 years) |
| Headless CMS and composable architectures | +1.2% | North America and Europe, selective uptake in Asia-Pacific | Long term (≥ 4 years) |
| Accessibility regulation (WCAG 3.0) deadlines | +0.8% | Regulation-led markets in North America and Europe | Short term (≤ 2 years) |
| Source: Mordor Intelligence | |||
E-commerce & Omnichannel Boom
Retailers now regard site reliability as a growth lever rather than a maintenance concern after peak-season outages erased millions in one-day revenue losses in 2024. Leading merchants are adopting composable commerce to swap individual services—search, cart, payments—without disrupting the core checkout flow, trimming release cycles from weeks to days. Retail case studies show that well-designed Progressive Web Apps can lift mobile conversion rates fourfold, reinforcing why decision makers view web development as a direct revenue driver. With ordering, loyalty, and fulfillment data flowing through a single stack, platform extensibility becomes a boardroom metric, further raising demand for the web development services market.
Enterprise Digital-Transformation Budgets
C-suite urgency around customer-experience parity with digital-native competitors keeps web budgets intact even when discretionary IT spending tightens. Global systems integrators are winning multi-year managed-services deals that embed AI, data fabric, and design capabilities in one contract, locking in predictable fee streams. The typical Fortune 500 client now allocates double-digit share of its tech budget to web-facing initiatives, seeking expertise in cloud refactoring and privacy-centric architecture. Those priorities sustain premium pricing power inside the web development services market.
Mobile-First & PWA Adoption
Mobile accounts for roughly 60% of total traffic, while abandonment climbs when sites fail to load within three seconds. Enterprises therefore fast-track PWAs to blend near-native speed with browser reach, cutting separate iOS and Android codebases. Results include notable file-size drops that save bandwidth in emerging markets and enable offline browsing to support last-mile commerce. These performance wins show why PWAs are the fastest-growing service line for vendors inside the web development services market.
AI-Powered Chatbots & Personalization
Generative-AI chat interfaces now manage routine queries and nudge upsell conversions while feeding analytics models with new conversational data. A Fortune 200 healthcare insurer recently pushed 80% of first-contact volume to an AI bot that triages claims in seconds, raising customer-satisfaction metrics by double digits. Such outcomes spark demand for developers skilled in natural-language processing, vector-database orchestration, and privacy controls talent clusters that command premium bill rates across the web development services market.[2]Accenture plc, “Value From Every Angle | FY 2024 Annual Report,” accenture.com
Restraints Impact Analysis*
| Restraint | (~) % Impact on CAGR Forecast | Geographic Relevance | Impact Timeline |
|---|---|---|---|
| Cross-Browser / Device Fragmentation | -1.3% | Global small and midsize projects feel it most | Short term (≤ 2 years) |
| Global Talent Shortage & Rising Developer Costs | -2.2% | Worldwide, most acute in North America and Europe | Long term (≥ 4 years) |
| Expanding data-privacy rules (GDPR, CPRA) raise compliance work | -0.9% | Europe and North America regulatory markets | Medium term (2-4 years) |
| Carbon-footprint audits push greener web builds | -0.6% | Europe and North America, starting to spread to Asia-Pacific | Long term (≥ 4 years) |
| Source: Mordor Intelligence | |||
Cross-Browser / Device Fragmentation
Inconsistent CSS and JavaScript behavior across browsers extends QA cycles and forces polyfills that bloat payload sizes, driving up hosting bills. Safari and Internet Explorer display layout quirks that require conditional stylesheets, burdensome for teams lacking automated test rigs. Fragmentation escalates on mobile where hundreds of screen sizes and chipset variants complicate performance tuning. SMEs feel the pinch because they cannot absorb added hours, tempering uptake for web development services.
Global Talent Shortage & Rising Developer Costs
Mid-career full-stack salaries rose more than 40% in the past two years, while AI specialists fetch even higher premiums as enterprises scramble to embed generative models. Inflationary wage trends squeeze project margins and widen delivery lead times. To offset scarcity, outsourcers are expanding near-shore centers and investing heavily in internal training, yet supply still trails need. This imbalance limits the velocity at which the web development services market can scale and occasionally persuades buyers to postpone feature roadmaps.
*Our forecasts treat driver/restraint impacts as directional, not additive. The impact forecasts reflect baseline growth, mix effects, and variable interactions.
Segment Analysis
By Type: The PWA Upswing
The segment that groups classic web applications retained 57.35% revenue in 2025 thanks to entrenched enterprise workflows that rely on robust server-rendered stacks. That dominance translated into USD 46.2 billion of the web development services market size in the base year. Progressive Web Apps, however, expanded at 13.45% CAGR and are projected to narrow the gap rapidly. PWAs lower total cost of ownership by eliminating separate native builds while delivering push notifications and offline caching that heighten engagement. Early adopters within retail and travel note that bounce rates fall when customers can resume sessions without reinstalling apps. In parallel, low-code site builders keep attracting micro-enterprises seeking brochure-style pages, yet they rarely satisfy security, compliance, or multi-region traffic needs at the enterprise tier.
PWA success stories resonate across boardrooms: brands report double-digit revenue lifts after converting sites to service-worker-enabled architectures. Technology vendors are now bundling turnkey PWA accelerators with headless CMS licenses, compressing deployment from months to weeks. As a result, professional-services partners are packaging “PWA in a box” offerings that promise predictable budgets and outcomes, adding fuel to the web development services market.


By Enterprise Size: Dual-Track Momentum
Large corporations commanded 62.40% of 2025 billings, equal to USD 50.3 billion of web development services market share, because they outsource global rollouts that span hundreds of microsites and localized portals. They also require multilayer security assessments, content governance, and multi-cloud resilience—needs best met by tier-one integrators. Yet small and medium enterprises are the faster mover, expanding at 10.85% CAGR on the back of SaaS toolkits and pay-as-you-go cloud that cut initial outlays by a third. SMEs prize serverless back-ends for eliminating server patching and benefiting from usage-linked pricing, freeing scarce capital for marketing spend.
The ability to experiment cheaply levels the playing field: a 20-employee retailer can launch AI-assisted chat ordering capability in weeks by licensing pretrained models through an API. Vendors serving this cohort assemble standardized template libraries and managed-hosting bundles that deliver enterprise-grade uptime without enterprise overhead. These dynamics ensure balanced growth across client sizes within the web development services market.
By End-User Vertical: Healthcare’s Digital Leap
Retail and e-commerce users retained 29.60% revenue share in 2025 given their early embrace of omnichannel storefronts. By contrast, healthcare registers the steepest climb at 14.05% CAGR to 2031 as telemedicine and patient-engagement portals move from pilot to standard of care. Teleconsultations surged after reimbursement codes expanded in 2024, spurring hospitals to contract specialized vendors for HIPAA-compliant video, scheduling, and records integration. Banking, financial-services, and insurance firms similarly escalate spending to meet rising digital-onboarding and fraud-mitigation needs.
Regulatory frameworks amplify complexity: healthcare developers must validate code against stringent data-protection rules, driving multiyear maintenance retainers. Those factors translate into premium rates and enlarge the total addressable pie for the web development services market.
By Technology Stack: React plus Headless Wins
React frameworks accounted for 32.50% of implementations in 2025, credited to a mature ecosystem, vibrant talent community, and seamless integration with GraphQL APIs. Subsequent performance gains from React Server Components make the library even more attractive for content-rich sites. Meanwhile, headless CMS adoption grows 15.45% annually as content teams demand omnichannel syndication without tethering to a single front-end technology. Microservices back-ends anchored on Node.js or Go underpin many of these builds, while edge-rendering via CDN points slashes latency for global visitors.
Suppliers are therefore investing in React component libraries and GraphQL accelerators to meet rising demand. Certification programs tied to headless CMS vendors help partners assure delivery quality, strengthening the value proposition of the web development services market.
By Deployment Model: Serverless on the Rise
Cloud remains the default footing with 69.20% share, translating into the largest spend pool for the web development services industry. Yet serverless workloads expand at 18.10% CAGR because event-driven billing aligns spend tightly with traffic spikes, curbing idle costs. Enterprises that migrated image-processing micro-services to Function-as-a-Service models report 35% lower monthly bills and faster releases because DevOps teams no longer patch VMs. Hybrid topologies blend serverless APIs with containerized analytics engines that require GPU acceleration, illustrating architectural pluralism.
Vendors differentiate by offering reference blueprints and 24 × 7 observability services that tame serverless complexity. Mastery of cold-start mitigation, concurrency limits, and distributed-tracing tools becomes a new selection criterion as buyers pursue efficiency inside the web development services market.
Geography Analysis
North America safeguarded 39.40% of global billings in 2025 as entrenched enterprises pursued aggressive modernization programs underpinned by generous cloud credits from hyperscalers. Clients value local regulatory clarity and broad talent pools, allowing rapid experimentation with AI-as-a-Service offerings. The United States alone saw multiple nine-figure deals where customers outsourced legacy portal re-platforming to a single services partner who manages cloud costs, security, and DevSecOps at scale. Canada’s immigration-friendly policies complement that dynamic by channeling high-skill developers into local delivery centers, reinforcing supply for the web development services market.
Asia-Pacific represents the fastest regional climb with a 17.05% CAGR. India anchors growth following multibillion-dollar data-center commitments that double rack capacity and reduce latency for domestic traffic. The rise of India-built Digital Public Infrastructure APIs makes onboarding payments, identity, and document storage straightforward, lowering entry barriers for startups who then contract external agencies to build compliant front-ends. In China, official blueprints to lift the digital-economy share of GDP unlock public incentives for AI-centric commerce platforms, channeling spend toward vendors versed in low-code, headless, and edge-rendered architectures. Japan’s national Society 5.0 policy, backed by subsidy programs for AI testbeds, injects fresh demand for accessibility-compliant corporate portals, diversifying addressable revenue. Europe delivers steady mid-single-digit growth on the back of GDPR refinements and new accessibility directives that mandate inclusive user journeys. Enterprises put a premium on host-in-region data stores and audit trails, spawning opportunities for vendors that bundle sovereign-cloud hosting with turnkey WCAG-3.0 remediation. Elsewhere, Latin America benefits from Brazilian e-commerce momentum, while select Gulf Cooperation Council states fund “smart city” rollouts that integrate citizen services via web dashboards. Together these pockets sustain a globally diversified web development services market.

Competitive Landscape
The playing field blends tier-one IT-services conglomerates, mid-sized digital specialists, and boutique agencies. Tata Consultancy Services reported USD 29.1 billion in annual revenue and retrained 25,000 engineers on Azure OpenAI tooling, illustrating the scale at which incumbents marshal talent. Accenture logged USD 64.9 billion in fiscal 2024 sales with USD 81.2 billion in bookings and plans to double its Data & AI headcount to 80,000 by 2026, underscoring appetite for cognitive projects. IBM forecasts AI-led growth above market averages and doubled generative-AI revenue in Q4 2024, confirming large-vendor momentum.[3]"IBM forecasts annual revenue growth above estimates on AI adoption rush."
Mid-caps such as EPAM Systems and Thoughtworks carve out niches by delivering design-thinking workshops and cloud-native accelerators with faster decision cycles than mega-vendors. Boutiques target headless CMS, serverless, or sector-specific certifications; for instance, health-tech specialists hold HITRUST and SOC 2 badges that appeal to hospital buyers. Alliances with infrastructure providers are becoming pivotal: partners that rack up AWS, Microsoft, or Google cloud certifications secure co-marketing funds that offset lead-generation costs, tightening competition.
M&A persists as large firms buy capability and client portfolios: Accenture’s recent purchase of Tokyo-based Yumemi adds 400 product-design experts, while Snowflake’s bid for Crunchy Data extends its reach into Postgres-oriented AI data services.[4]CNBC LLC, “Snowflake to Buy Crunchy Data,” cnbc.com Within hosting, World Host Group’s acquisition of A2 Hosting underscores vertical consolidation. These moves indicate a moderate concentration trend but leave ample headroom for innovators, sustaining healthy rivalry inside the web development services market.
Web Development Industry Leaders
-
Unified Infotech
-
SDLC Corporation
-
instinctools GmbH
-
Softnix Infotech
-
Openxcell
- *Disclaimer: Major Players sorted in no particular order


Recent Industry Developments
- June 2025: Meta invested USD 14.3 billion for a 49% stake in Scale AI and hired its CEO to spearhead super-intelligence research, boosting demand for high-fidelity data-labeling pipelines.
- June 2025: Snowflake agreed to acquire Crunchy Data for USD 250 million, bolstering enterprise-grade PostgreSQL support and AI-ready transactional capabilities.
- May 2025: OpenAI completed a USD 3 billion purchase of Windsurf to scale AI-assisted coding, creating new integration hooks for web-development pipelines.
- May 2025: Accenture acquired Tokyo-based Yumemi to enhance rapid product-design delivery with 400 specialists joining Accenture Song.


Research Methodology Framework and Report Scope
Market Definitions and Key Coverage
Our study defines the web development market as fee-based design, build, and maintenance of browser-delivered websites and web applications, including progressive web apps and low/no-code site builders, across cloud, on-premise, and hybrid deployments. Revenue streams captured are project fees, recurring hosting and maintenance contracts, and subscription licensing attached to proprietary frameworks.
Scope Exclusion: Pure-play mobile-only app creation and standalone hosting colocation services are out of scope.
Segmentation Overview
-
By Type
- Website
- Web Application
- Progressive Web App (PWA)
- Low-/No-Code Site Builder
-
By Enterprise Size
- Small and Medium-sized Enterprises (SMEs)
- Large Enterprises
-
By End-user Vertical
- Retail and E-commerce
- BFSI
- Healthcare and Life Sciences
- IT and Telecom
- Media and Entertainment
- Government and Public Sector
- Education
- Travel and Hospitality
-
By Technology Stack
- Front-end Framework (React, Angular, Vue)
- Back-end Framework (Node, Django, .NET)
- Headless CMS / Composable
- API-first and Serverless
-
By Deployment Model
- Cloud-based
- On-premise
- Hybrid
-
By Geography
-
North America
- United States
- Canada
- Mexico
-
South America
- Brazil
- Argentina
- Rest of South America
-
Europe
- Germany
- United Kingdom
- France
- Spain
- Italy
- Rest of Europe
-
Asia-Pacific
- China
- India
- Japan
- South Korea
- Australia
- Rest of Asia-Pacific
-
Middle East
- Israel
- Saudi Arabia
- United Arab Emirates
- Turkey
- Rest of Middle East
-
Africa
- South Africa
- Egypt
- Nigeria
- Rest of Africa
-
North America
Detailed Research Methodology and Data Validation
Primary Research
Phone and video interviews with agency founders, in-house engineering leads, cloud platform resellers, and procurement heads across North America, Europe, and Asia-Pacific helped validate average project values, labor mix shifts toward low-code tools, and region-specific growth triggers that desk sources only hint at.
Desk Research
Mordor analysts first map the demand pool through open datasets such as ITU internet-user counts, W3Techs technology usage shares, UN Comtrade software export codes, and developer employment statistics from the US Bureau of Labor Statistics, which together show the addressable base and spending intensity. Company filings and investor presentations enrich pricing and contract length indicators, while news feeds from Dow Jones Factiva and company snapshots in D&B Hoovers are tapped to spot large multi-year web build deals. Patent landscapes from Questel highlight emerging headless CMS and serverless patterns.
A wide range of other secondary materials, including trade association briefs, academic journals, and reputable press releases, were also referenced; the list above is illustrative, not exhaustive.
Market-Sizing & Forecasting
A top-down build begins with worldwide business IT spend on digital presence, reconstructed from national accounts and domain-registration data, which is then split by end-user vertical using web traffic analytics and e-commerce GMV shares. Supplier roll-ups of sampled average selling price multiplied by project volumes provide a bottom-up checkpoint before final reconciliation. Key variables tracked include active domain additions, CMS adoption rates, developer salary indices, cloud infrastructure spend, and smartphone share of web traffic. Multivariate regression with scenario analysis projects each driver to 2030; gaps in granular supplier data are bridged with region-weighted ASP proxies vetted during primary research.
Data Validation & Update Cycle
Outputs pass a three-level analyst review, variance tests against independent indicators, and anomaly callbacks with external experts. The model is refreshed every twelve months, with interim revisions triggered by major funding rounds, regulatory shifts, or technology inflection points.
Why Mordor's Web Development Baseline Earns Trust
Published estimates often differ; scope choices, pricing assumptions, and refresh timing usually explain the spread.
Key gap drivers here include whether maintenance retainers are counted, if low-code platform fees are bundled, geographic cut-offs, and currency conversion practices. Mordor's study reports a balanced base-year value, uses dual-path validation, and updates annually, while many peers rely on static vendor surveys or extrapolate from historical hosting data.
Benchmark comparison
| Market Size | Anonymized source | Primary gap driver |
|---|---|---|
| USD 80.60 B (2025) | Mordor Intelligence | - |
| USD 55.12 B (2024) | Global Consultancy A | Excludes post-launch maintenance; older base year inflates growth perception |
| USD 76.27 B (2025) | Industry Association B | Treats single-country freelancer revenue as global, limited primary validation |
| USD 19.8 B (2024, US only) | Regional Consultancy C | Geography-limited scope reported as total market, no global extrapolation |
Taken together, the comparison shows that Mordor's disciplined scope selection, current-year baseline, and mixed-method validation provide a dependable, transparent reference point for strategic planning.


Key Questions Answered in the Report
What is the current size of the web development services market and how fast is it growing?
The market is valued at USD 87.75 billion in 2026 and is projected to reach USD 134.17 billion by 2031, reflecting a 8.87% CAGR.
Which solution type is expanding the quickest?
Progressive Web Apps lead growth at a 13.45% CAGR because they deliver native-like performance without the cost of separate iOS and Android builds.
Which region shows the highest future growth rate?
Asia-Pacific is the fastest-growing geography, advancing at a 17.05% CAGR as hyperscale cloud providers expand data-center capacity across India, China, and Japan.
What deployment model is gaining the most traction?
Serverless-first architectures are rising at an 18.10% CAGR, cutting infrastructure costs by roughly 38% for small and medium enterprises.
Why is healthcare a priority end-user vertical?
Healthcare services post a 14.05% CAGR due to telemedicine, electronic health records, and AI diagnostics that demand secure, compliant web portals.
How does the developer talent shortage influence project budgets?
Mid-level and senior salaries have climbed more than 40% since 2023, and AI skill premiums add pressure, lifting overall web development costs by 10–15% each year.
Page last updated on:


