Super Apps Market Size and Share
Market Overview
| Study Period | 2020 - 2031 |
|---|---|
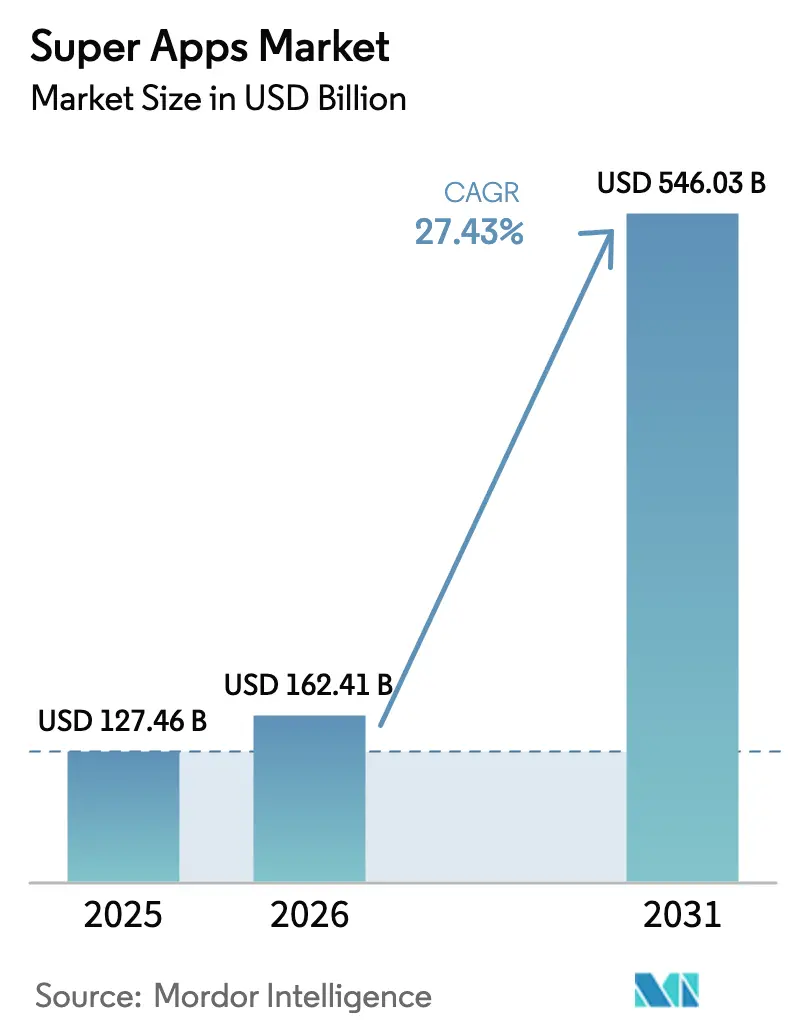
| Market Size (2026) | USD 162.41 Billion |
| Market Size (2031) | USD 546.03 Billion |
| Growth Rate (2026 - 2031) | 27.43% CAGR |
| Fastest Growing Market | Africa |
| Largest Market | Asia Pacific |
| Market Concentration | Medium |
Major Players *Disclaimer: Major Players sorted in no particular order Image © Mordor Intelligence. Reuse requires attribution under CC BY 4.0. | |
Super Apps Market Analysis by Mordor Intelligence
The super apps market size is expected to grow from USD 127.46 billion in 2025 to USD 162.41 billion in 2026 and is forecast to reach USD 546.03 billion by 2031 at 27.43% CAGR over 2026-2031. A mobile-first population, government programs that accelerate cash-lite economies, and mature API architectures that let hundreds of third-party services plug into a single front end make unified platforms more attractive than ever. Asia-Pacific leads adoption, yet Africa is becoming the fastest-moving region as low-cost smartphones and 4G/5G rollouts shorten the digital inclusion gap. Players with embedded payments at their core enjoy higher retention because payments create daily touchpoints that feed data back into AI engines for personalised cross-selling. Competition is intensifying as Western incumbents experiment with “super-app-lite” strategies that meet stricter privacy rules while still bundling commerce, content and financial services.
Key Report Takeaways
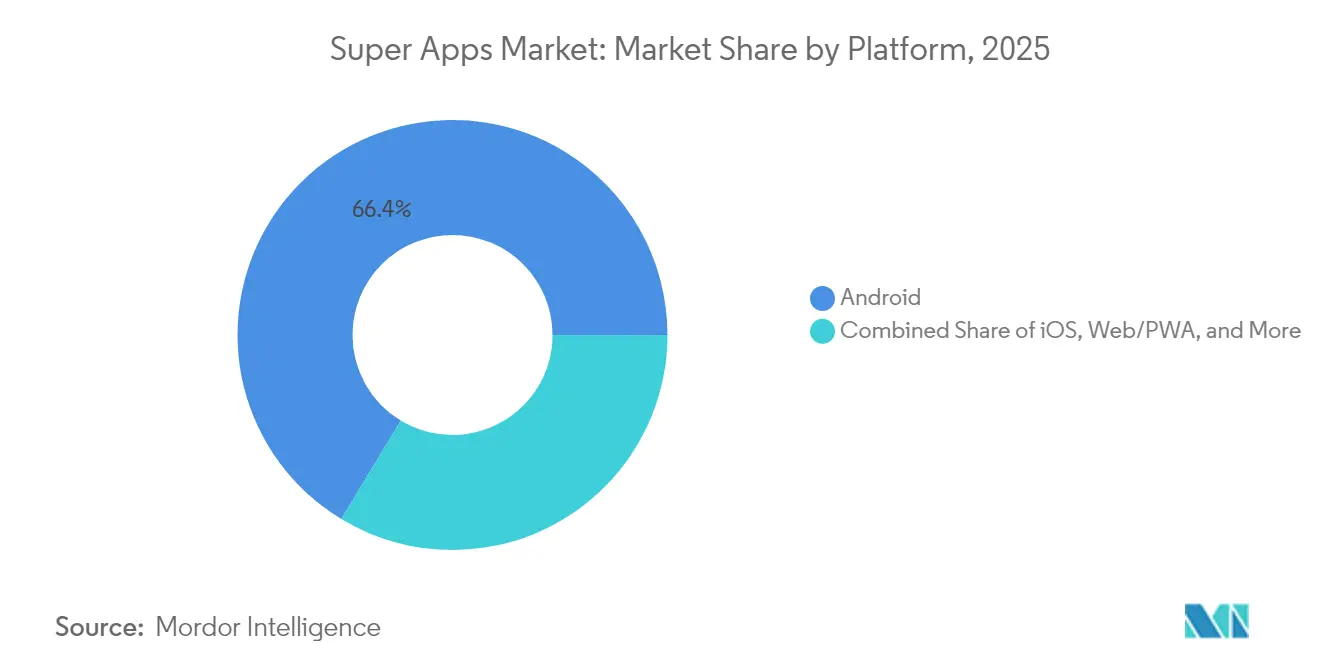
- By platform, Android commanded 66.35% of super apps market share in 2025; hybrid operating systems are projected to expand at a 31.74% CAGR through 2031.
- By device, smartphones accounted for 81.25% share of the super apps market size in 2025, while wearables and IoT devices register the fastest 29.94% CAGR to 2031.
- By deployment type, cloud infrastructure held 84.25% revenue share in 2025 and is set to grow at 28.41% CAGR to 2031.
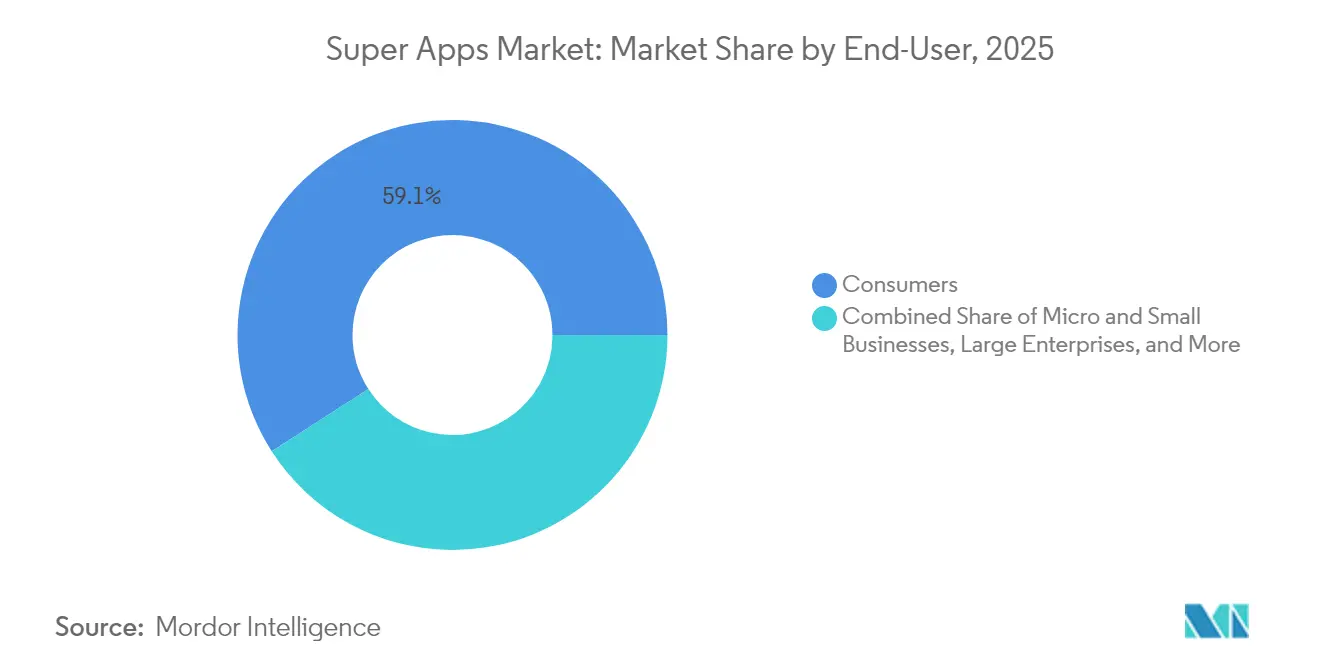
- By end-user, the consumer segment captured 59.10% of the market in 2025; government and public-sector agencies exhibit the highest 27.67% CAGR through 2031.
- By application, financial services and wallets led with 37.80% share in 2025, yet healthcare and wellness is tracking a 32.96% CAGR to 2031.
- By geography, Asia-Pacific dominated with 53.10% share in 2025, whereas Africa is forecast to post the fastest 30.34% CAGR to 2031.
Note: Market size and forecast figures in this report are generated using Mordor Intelligence’s proprietary estimation framework, updated with the latest available data and insights as of 2026.
Global Super Apps Market Trends and Insights
Driver Impact Analyis*
| Driver | (~) % Impact on CAGR Forecast | Geographic Relevance | Impact Timeline |
|---|---|---|---|
| Rising smartphone and mobile-data penetration | +6.8% | Global (highest in Asia-Pacific and Africa) | Medium term (2-4 years) |
| Shift toward digital payments and e-commerce | +7.2% | Global (led by Asia-Pacific and Latin America) | Short term (≤2 years) |
| Demand for integrated “all-in-one” user experience | +5.5% | Global (especially emerging markets) | Medium term (2-4 years) |
| Government push for cash-lite digital ecosystems | +4.3% | Asia-Pacific core, spill-over to MEA and Latin America | Long term (≥4 years) |
| Open-banking and API-first regulation | +3.8% | North America and EU, spreading to Asia-Pacific | Medium term (2-4 years) |
| Mini-app ecosystems unlocking SME monetisation | +2.9% | Asia-Pacific core, early Latin America | Long term (≥4 years) |
| Source: Mordor Intelligence | |||
Rising smartphone and mobile-data penetration
Smartphone ownership is on course to reach 92% across Latin America by 2030, and data-only packages already connect 65% of its people to the internet. Faster networks and cheaper handsets make mobile the default gateway, allowing super apps to leapfrog desktop-era financial services. Latency-sensitive payments, real-time ride-hailing and IoT home control, once confined to advanced economies, are now mainstream in growth markets. The change resets consumer expectations from “transactional” to “experiential,” deepening demand for unified ecosystems over fragmented single-purpose apps.
Shift toward digital payments and e-commerce
China’s digital payment value is forecast to jump from USD4.86 trillion in 2025 to USD10.06 trillion by 2030, while India’s UPI processed 18.68 billion transfers in May 2025 alone. Central-bank digital currencies and stablecoins—projected to hit USD1.6 trillion by 2030—slash cross-border fees, further strengthening network effects around payment-centric super apps [1]Citigroup Global Perspectives, “The Future of Money: Crypto, CBDCs and Digital Cash,” citigroup.com.
Demand for integrated “all-in-one” user experience
Seven in ten users now prefer one application that covers daily needs, citing “app fatigue” as the main reason to consolidate digital habits. Platforms able to pre-empt rather than react to customer intent—through AI predictions based on a single data lake—achieve higher lifetime value. Healthcare modules are a key differentiator; 89% of doctors and 75% of patients surveyed in 2024 favoured a super-app interface for record access and teleconsultation.
Government push for cash-lite digital ecosystems
Singapore’s Singpass Pay links verified digital IDs with instant payments, lowering fraud and onboarding times across public and private services. Indonesia is merging 27,000 disparate government apps into a unified citizen platform that embeds identity, taxation and social benefits in one wallet [2]Ministry of Communication and Informatics Indonesia, “Integrating 27,000 Government Apps,” kominfo.go.id. State backing accelerates adoption because regulatory clarity and trust grow in tandem with functionality.
Restraints Impact Analysis*
| Restraint | (~) % Impact on CAGR Forecast | Geographic Relevance | Impact Timeline |
|---|---|---|---|
| Privacy and data-security concerns | -3.2% | Global, chiefly North America and EU | Short term (≤2 years) |
| Multijurisdictional regulatory complexity | -2.8% | Global, highest in cross-border ops | Medium term (2-4 years) |
| “App fatigue” fueling preference for specialised apps | -1.9% | North America and EU | Medium term (2-4 years) |
| Intensifying antitrust scrutiny on bundling practices | -2.1% | North America and EU, going global | Long term (≥4 years) |
| Source: Mordor Intelligence | |||
Privacy and data-security concerns
Unified platforms pool financial, social and biometric data, exposing operators to penalties of up to 4% of worldwide revenue under GDPR if breaches occur. Compliance costs in Europe are rising while consumer awareness of data monetisation is strengthening, limiting willingness to grant wide-ranging permissions.
Multijurisdictional regulatory complexity
Payment, lending and crypto rules vary by country, forcing super apps to maintain separate licences and data centres. The EU Digital Markets Act and similar initiatives aim squarely at “gatekeeper” platforms, potentially restricting cross-service tying—one of the levers that make super apps sticky.
*Our forecasts treat driver/restraint impacts as directional, not additive. The impact forecasts reflect baseline growth, mix effects, and variable interactions.
Segment Analysis
By Platform: Android dominance drives emerging-market penetration
Android secured 66.35% of the super apps market share in 2025, benefiting from an open ecosystem that lets developers embed payments and mini-apps at the system level. Google Play’s deep localisation and the availability of low-cost handsets anchor its lead in India, Southeast Asia, and Africa. In contrast, iOS maintains strength in high-income markets but faces tighter in-app payment rules that curb super-app economics. Hybrid operating systems—built with cross-platform toolkits—will post a 31.74% CAGR to 2031 as brands seek one-code-base rollouts across multiple devices.
Hybrid frameworks reduce total cost of ownership, speed up feature parity releases, and allow super apps to offer near-native user experience on competing stores. Rapid 5G adoption and edge computing shrink latency gaps that once favoured pure native builds. Tencent’s AI-powered updates now reach both Android and iOS simultaneously, illustrating why a balanced code strategy is gaining favour.


By Device: Smartphones lead while wearables signal future integration
Smartphones represented 81.25% of the super apps market size in 2025, reflecting their role as the primary identity and payment token for most consumers. High-resolution screens, biometric sensors, and NFC chips create an ideal canvas for multi-service orchestration. Yet wearables and IoT endpoints are on course to grow at 29.94% CAGR to 2031, adding ambient-computing touchpoints that drive habitual engagement.
Smartwatches equipped with ECG and SpO₂ sensors funnel wellness data into health modules, while connected cars and smart-home devices trigger contextual commerce inside the same super app. 5G’s low-latency backbone supports on-device decisioning, allowing super-apps to deliver personalised prompts, such as insurance quotes when a driver enters a high-risk zone—without round-trip lag.
By Deployment Type: Cloud infrastructure enables scalable integration
Cloud models controlled 84.25% revenue share in 2025 and will grow 28.41% CAGR as operators lean on elastic computing to accommodate flash-sale traffic spikes and video streaming. Multicloud and regionally distributed zones address data-sovereignty laws while maintaining a unified DevOps pipeline.
Edge services, pushed by hyperscalers into telecom base stations, keep AI inference close to the user and cut response times for instant remittances or ride allocation. Alibaba’s ongoing USD 53 billion outlay on AI-centric cloud clusters exemplifies the capital race to underpin super app ambitions . Where sovereignty rules demand, hybrid models park sensitive datasets on-premise yet burst to public cloud for compute-heavy analytics.
By End-user: Consumer focus shifts toward government adoption
Consumers still account for 59.10% of spending, valuing one login for everything from banking to groceries. Small businesses increasingly rely on built-in point-of-sale and inventory plug-ins to formalise operations without large IT budgets. Large enterprises pilot workforce-service hubs but remain cautious due to security requirements.
Notably, government agencies represent the fastest-expanding audience, posting a 27.67% CAGR as public portals consolidate identity, licensing and payments. Indonesia’s plan to fold 27,000 apps into a single citizen interface underlines the administrative savings and transparency benefits motivating this trend.
By Application: Healthcare disruption accelerates beyond financial services
Payments, wallets and adjacent financial services retained 37.80% share in 2025, reaffirming that money movement remains the engine of user acquisition. Once a wallet is in place, lending, investment and insurance cross-sell lift revenue per user.
Healthcare is the breakout field, with a 32.96% CAGR expected through 2031. Teleconsultations, pharmacy e-commerce and preventative wellness coaching ride on the same identity and payment rails. Integration with wearables feeds real-time vitals into AI triage bots, presenting a powerful proposition in regions where clinical capacity is scarce. Governments also bundle public insurance claims into super-app wallets, further blurring the line between private and public service delivery.
Geography Analysis
Asia-Pacific held 53.10% of global revenue in 2025, fuelled by China’s 1.079 billion internet users and 87.5% digital payment adoption. WeChat alone served 1.671 billion monthly active users and generated USD 17.49 billion in platform revenue, illustrating network effects at a continental scale. India’s UPI has normalised instant peer-to-merchant payments, giving local super apps the rails to bolt on credit, gaming, and health insurance. Regional central-bank cooperation on QR code standards makes cross-border payments inside super apps close to real-time.
Africa is the fastest-growing region at a 30.34% CAGR. Mobile-money pioneers such as M-Pesa have laid payment rails that now extend into commerce, micro-lending, and government subsidy disbursement. Youthful demographics, a high entrepreneurial rate, and limited branch-banking infrastructure let super apps become primary gateways to financial inclusion. Donor agencies and NGOs increasingly channel aid through government-endorsed super-app wallets, ensuring traceability and lowering leakage.
North America and Europe remain opportunity pockets rather than volume drivers. Mature card networks and app-store rules make full-spectrum bundling harder, but vertical super-apps are emerging in travel, media and B2B spend management. The European Union’s eIDAS framework could open new ground once harmonised identity verification is in place, provided platforms stay within GDPR boundaries.


Competitive Landscape
The market is moderately concentrated. Tencent’s WeChat continues to demonstrate scale advantage with 1.671 billion monthly users and USD 17.49 billion annual revenue. MercadoLibre’s MercadoPago processes USD 58.3 billion in quarterly payments, proving that regional champions can thrive beside global giants.
Western entrants are testing modular paths: one example is X, which is fusing social media, digital wallets, and streaming to approximate super-app utility while respecting local payment-licence ceilings. Funding is pouring into niche challengers such as Bling, whose EUR 11.2 million round will finance a family-centric platform in Europe’s underserved youth segment.
Technology differentiation now orbits AI personalisation, synthetic-data-driven credit underwriting, and blockchain-anchored identity nodes. Alibaba’s USD 53 billion bet on AI-rich cloud services and Tencent’s on-device AI messaging upgrade signal that compute access is a competitive moat as important as user base size. Concurrently, the EU Digital Markets Act and the US Department of Justice antitrust probes may compel structural unbundling, favouring smaller specialists that can partner rather than own every service layer.
Super Apps Industry Leaders
Tencent Holdings Ltd.
PhonePe Pvt Ltd.
Grab Holdings Ltd.
Alibaba Group Holding Ltd. (Alipay)
GoTo Group (Gojek)
- *Disclaimer: Major Players sorted in no particular order

Recent Industry Developments
- June 2025: Grab denied reports of a USD7 billion acquisition of GoTo, underscoring consolidation pressures in Southeast Asia.
- April 2025: Lebanon confirmed a nationwide government services super app under its 2020-2030 Digital Transformation Strategy.
- March 2025: Wonder purchased Tastemade for USD90 million to blend content creation with food delivery inside its mealtime super app.
- January 2025: X declared ambitions to reach super-app status by rolling out X Money and X TV with AI-driven features.


Research Methodology Framework and Report Scope
Market Definitions and Key Coverage
Our study defines the super-apps market as the gross yearly revenue earned by multi-service mobile or web platforms that bundle at least three high-frequency services, including digital payments, ride hailing, food delivery, social networking, or retail checkout, within one login that also hosts third-party mini-apps.
Scope exclusion: single-purpose apps and private, closed-loop enterprise super-apps are outside the study.
Segmentation Overview
- By Platform
- Android
- iOS
- Web/PWA
- Hybrid OS
- By Device
- Smartphone
- Tablet
- Wearable and IoT
- By Deployment Type
- Cloud
- On-premise
- By End-user
- Consumers
- Micro and Small Businesses
- Large Enterprises
- Government and Public-sector Agencies
- Others
- By Application
- Financial Services and Wallets
- Transportation and Logistics
- E-commerce and Retail
- Social Media and Messaging
- Healthcare and Wellness
- Government and Civic Services
- Entertainment and Streaming
- By Geography
- North America
- United States
- Canada
- Mexico
- South America
- Brazil
- Argentina
- Rest of South America
- Europe
- Germany
- United Kingdom
- France
- Italy
- Spain
- Russia
- Rest of Europe
- Asia-Pacific
- China
- Japan
- India
- South Korea
- Australia and New Zealand
- Rest of Asia-Pacific
- Middle East and Africa
- Middle East
- Saudi Arabia
- UAE
- Turkey
- Rest of Middle East
- Africa
- South Africa
- Nigeria
- Kenya
- Rest of Africa
- Middle East
- North America
Detailed Research Methodology and Data Validation
Primary Research
Mordor analysts held structured conversations with payment processors, mobility aggregators, digital-ad sellers, and regulators across Asia-Pacific, the Americas, Africa, and Europe. Their insights confirmed active-user ratios, typical commission ladders, and upcoming policy shifts, letting us adjust early desk inputs.
Desk Research
We gathered smartphone adoption, mobile-money value, and retail e-commerce turnover from open bodies such as the International Telecommunication Union, World Bank Global Findex, GSMA Mobile Money, and several central-bank dashboards. Company filings, IPO papers, and Dow Jones Factiva news feeds mapped platform take rates and advertising share. Questel patent pulls plus Volza shipment logs signaled feature pipelines and cross-border commerce. These sources illustrate our base, while many other public datasets helped us refine numbers.
Market-Sizing & Forecasting
We begin with a top-down build that multiplies each region's smartphone base by super-app penetration and by average yearly revenue per engaged user, then split totals across core service buckets. Targeted bottom-up checks, such as supplier rollups and sampled commission-times-volume math, tighten results. Key variables tracked include monthly active users, digital payment value, in-app CPMs, fee caps, smartphone penetration, and income growth. A multivariate regression projects these drivers to 2030, and scenario analysis tests high-growth African paths.
Data Validation & Update Cycle
Outputs pass variance filters against independent payment and ad-spend series before a multi-analyst review. Reports refresh every twelve months, with interim updates when funding rounds, mergers, or new fee ceilings reshape assumptions.
Why Mordor's Super Apps Baseline Commands Reliability
Published estimates often differ because firms choose dissimilar revenue baskets, geography mixes, and refresh cadences.
Our disciplined scope, driver set, and annual updates keep figures aligned with real usage signals.
Benchmark comparison
| Market Size | Anonymized source | Primary gap driver |
|---|---|---|
| USD 127.46 B (2025) | Mordor Intelligence | |
| USD 76.50 B (2023) | Global Consultancy A | Excludes ads and commissions |
| USD 94.90 B (2024) | Industry Publisher B | Africa omitted; limited primary proof |
| USD 95.83 B (2024) | Trade Journal C | Static base; rare refresh |
Taken together, the comparison shows how our wider revenue coverage and step-wise validation give decision-makers a transparent, reproducible baseline they can trust.


Key Questions Answered in the Report
Which region leads adoption of super apps?
Asia-Pacific holds 53.10% of global revenue thanks to entrenched ecosystems such as WeChat and India’s UPI-backed platforms.
Which application segment is growing the fastest?
Healthcare and wellness modules show the highest 32.96% CAGR to 2031, benefiting from telemedicine, wearable integration and AI-driven analytics.
How important are cloud deployments for super apps?
Cloud models make up 84.25% of deployments and are expanding at 28.41% CAGR, providing elasticity, global reach and built-in AI services.
Why are governments interested in super apps?
Integrated platforms cut administrative costs and improve citizen satisfaction; public-sector adoption is rising at 27.67% CAGR.
What are the main barriers to super app expansion in Western markets?
Stricter privacy rules, fragmented financial regulation and consumer preference for specialised apps limit full-stack bundling.
Page last updated on:


