Search Engine Optimization (SEO) Services Market Size and Share
Market Overview
| Study Period | 2020 - 2031 |
|---|---|
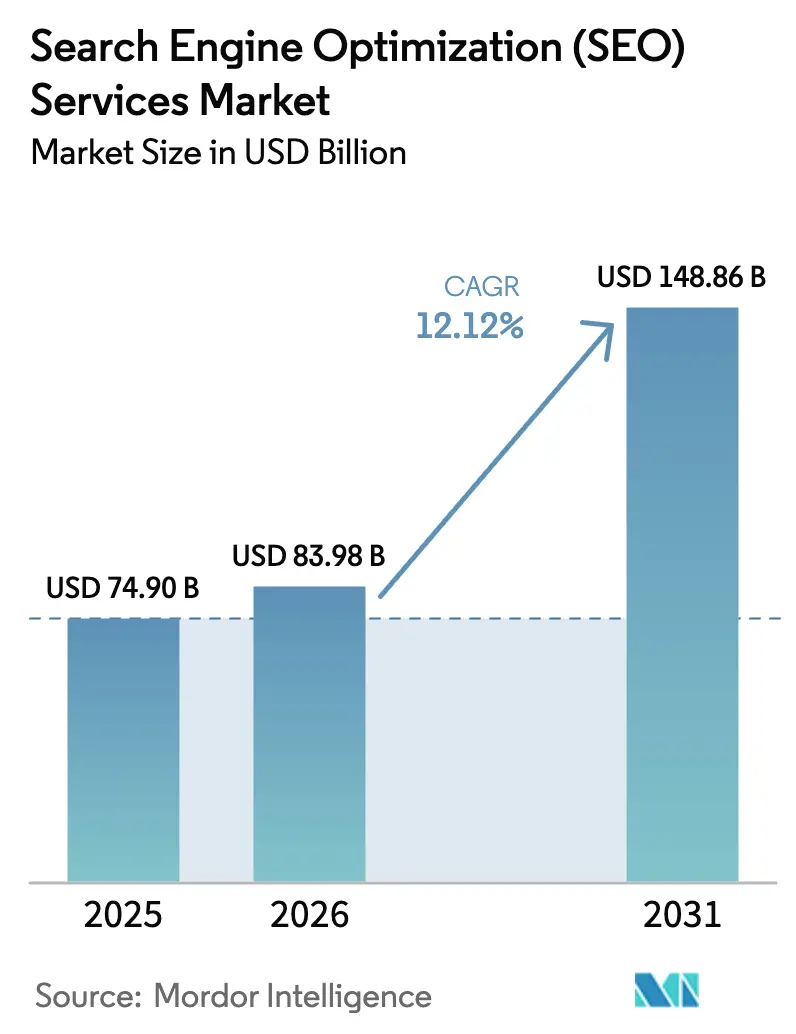
| Market Size (2026) | USD 83.98 Billion |
| Market Size (2031) | USD 148.86 Billion |
| Growth Rate (2026 - 2031) | 12.12% CAGR |
| Fastest Growing Market | Asia Pacific |
| Largest Market | North America |
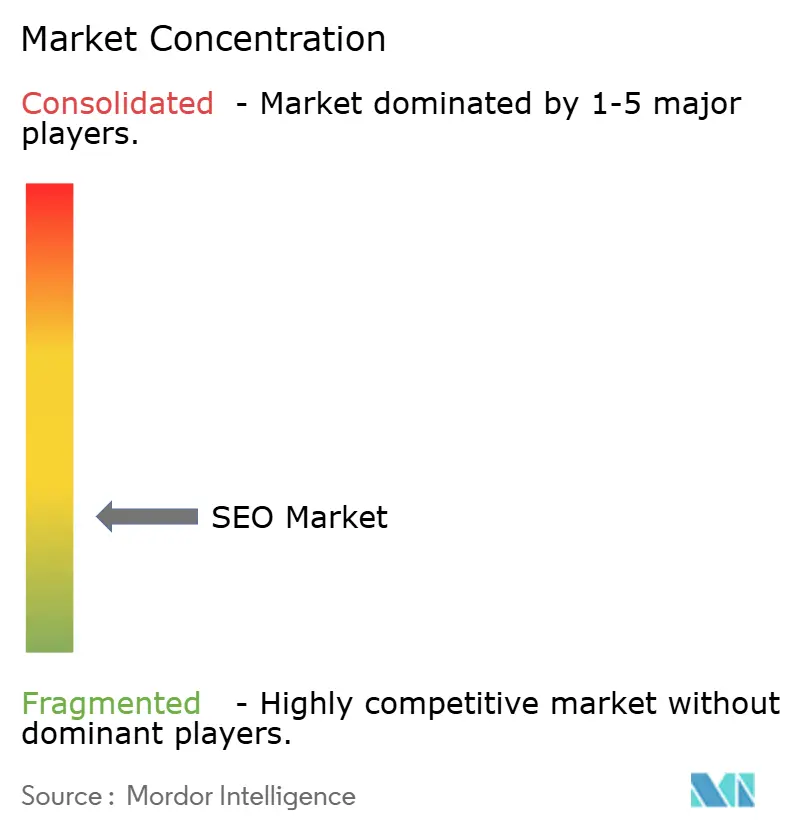
| Market Concentration | Low |
Major Players
*Disclaimer: Major Players sorted in no particular order Image © Mordor Intelligence. Reuse requires attribution under CC BY 4.0. |
|
Search Engine Optimization (SEO) Services Market Analysis by Mordor Intelligence
The search engine optimization (SEO) services market size in 2026 is estimated at USD 83.98 billion, growing from 2025 value of USD 74.9 billion with 2031 projections showing USD 148.86 billion, growing at 12.12% CAGR over 2026-2031. The rising dependence on organic search for revenue generation, combined with Google’s increasingly complex algorithm, is prompting both enterprises and small businesses to outsource advanced optimization skills. Demand is further buoyed by the growth of performance-linked pricing models, the expansion of voice and visual search, and shifts in digital advertising budgets driven by privacy concerns. Intensifying competition among digital-first retailers, the influx of AI-driven ranking factors, and the need for global, multi-language campaigns all expand the addressable client base, keeping service providers in constant innovation mode. With North America still delivering the single-largest revenue pool and APAC adding the fastest net new spend, providers capable of blending technical depth with geographic nuance are best positioned to capture share.
Key Report Takeaways
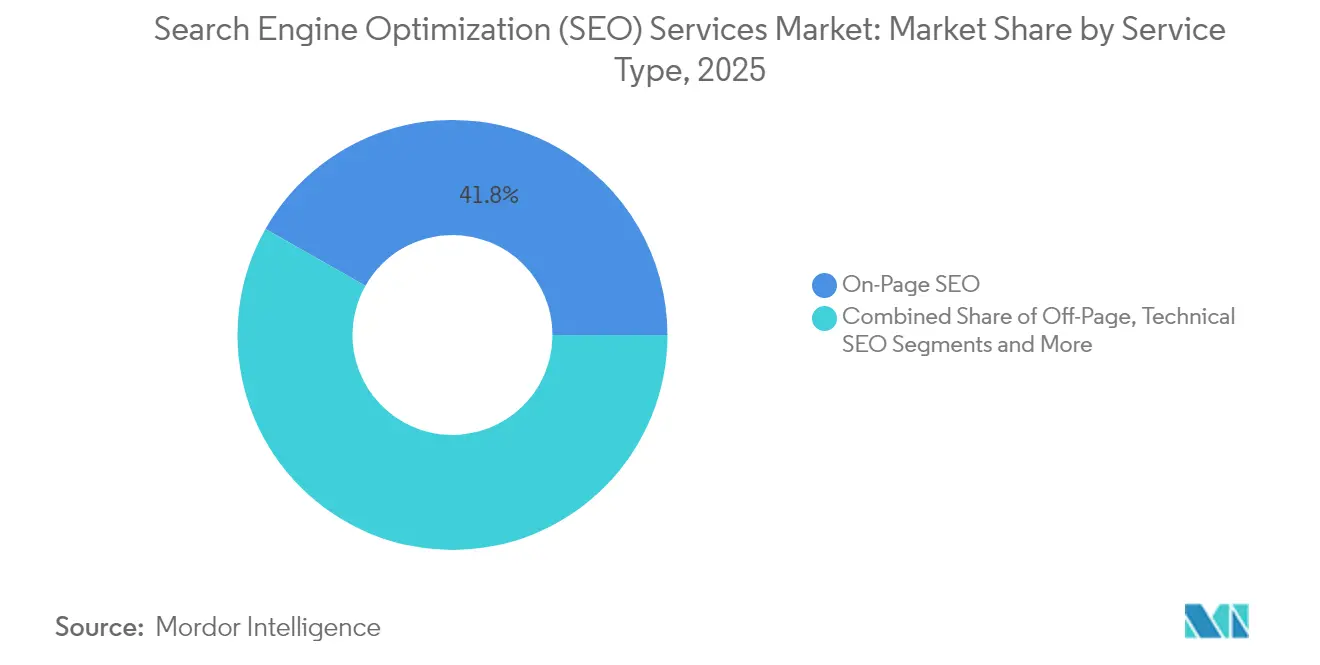
- By service type, On-Page SEO led with 41.80% revenue share in 2025, while voice and visual search SEO is set to outpace peers at a 20.10% CAGR to 2031.
- By organization size, small and medium enterprises accounted for 58.40% of the search engine optimization services market share in 2025; multinational/enterprise demand is expected to expand at a 16.10% CAGR through 2031.
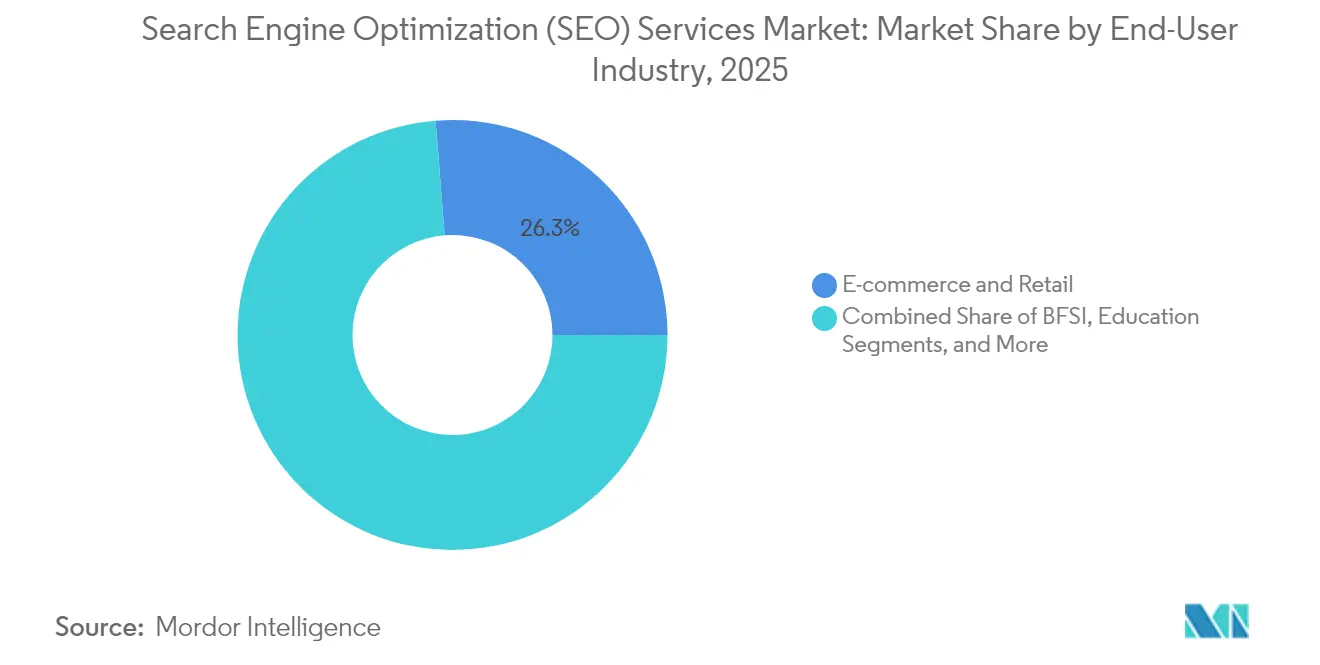
- By end-user industry, e-commerce and retail commanded 26.25% share of the search engine optimization services market size in 2025, whereas healthcare and life-sciences is advancing at a 17.40% CAGR to 2031.
- By service model, retainer/subscription agreements accounted for 61.95% of 2025 revenue, while outcome-based contracts are accelerating at a 18.40% CAGR, underscoring the client's appetite for accountable delivery.
- By geography, North America contributed 33.90% revenue share in 2025; APAC is forecast to record the fastest 13.55% CAGR between 2026-2031.
Note: Market size and forecast figures in this report are generated using Mordor Intelligence’s proprietary estimation framework, updated with the latest available data and insights as of 2026.
Global Search Engine Optimization (SEO) Services Market Trends and Insights
Drivers Impact Analysis*
| Driver | (~) % Impact on CAGR Forecast | Geographic Relevance | Impact Timeline |
|---|---|---|---|
| Rising global e-commerce and digital-ad spend | +2.8% | Global, APAC in the lead | Medium term (2-4 years) |
| Growing mobile internet and smartphone use | +2.1% | APAC core, MEA spill-over | Long term (≥ 4 years) |
| Content-led inbound marketing adoption | +1.9% | North America and EU | Medium term (2-4 years) |
| AI-driven algorithm updates raising complexity | +2.4% | Global | Short term (≤ 2 years) |
| Surge in voice and visual search (schema-first SEO) | +1.6% | North America, APAC expansion | Long term (≥ 4 years) |
| Cookie-less web pushing budgets toward SEO | +1.8% | Global, GDPR-led EU | Medium term (2-4 years) |
| Source: Mordor Intelligence | |||
Rising Global E-commerce and Digital-Ad Spend
Explosive online retail growth is sharpening the focus on cost-efficient customer acquisition, making organic search visibility indispensable for businesses scaling cross-border operations. Digital health innovators, for instance, have achieved 25X traffic lifts and 150%+ ROI once comprehensive SEO programs went live. Governments are echoing this emphasis; the US International Trade Administration notes that SEO is now integral to achieving export-oriented sales goals.[1]International Trade Administration, “eCommerce SEO,” trade.gov Content-rich health sites receive 1,134% more visits than static alternatives, illustrating how sustained content marketing can magnify organic reach. Search intent continues to dominate the patient journey; 77% of people consult a search engine before scheduling care, and providers pay an average of USD 53.53 per lead, cementing SEO as an ROI-positive budget line. As more retailers and healthcare brands compete for the top spot, service spending rises in lockstep.
AI-Driven Algorithm Updates Raising Complexity
Google’s integration of RankBrain, BERT and Gemini has shifted ranking signals from keyword density to intent modeling, forcing marketers to master vector search, entity relationships and schema depth. The arrival of Generative Engine Optimization (GEO) is already altering playbooks, with JPMorgan Chase predicting traditional search traffic will dip 25% by 2026 as conversational answer engines steal queries.[2]Danny Sullivan, “Google Algorithm Updates: The Complete History,” searchengineland.com Adobe’s 2025 C-suite poll found 65% of executives see AI analytics as revenue catalysts, yet only 12% can quantify returns, underscoring the implementation gap. That knowledge gap propels enterprises toward specialized providers able to translate AI insight into ranking wins, sustaining premium engagement fees.
Content-Led Inbound Marketing Adoption
Inbound programs are reframing SEO as a strategic storytelling function rather than a technical afterthought. In healthcare, 72% of marketers rank content creation as the top SEO lever. Physicians themselves consult search engines daily, pressuring pharmaceutical firms to publish authoritative material that answers nuanced clinical questions.[3]Brainers Hub. "HCP Digital Marketing: SEO, Social, Video, Email & More ..." Expertise in regulated vocabulary, citation discipline and medical review workflows is scarce, giving rise to boutique agencies specializing in life-sciences search.
Surge in Voice and Visual Search (Schema-First SEO)
Smart speakers, mobile assistants and camera-based lookup tools are shifting query formats from typed phrases to natural language and images. Structured data, featured snippets and conversational keyphrase mapping now decide whether a brand surfaces in spoken answers or image discovery. This schema-first imperative demands technical teams fluent in JSON-LD, rich results testing and Core Web Vitals, spurring a fresh layer of niche service offerings focused on multi-modal optimization.
Restraints Impact Analysis*
| Restraint | (~) % Impact on CAGR Forecast | Geographic Relevance | Impact Timeline |
|---|---|---|---|
| Frequent search-algorithm volatility | -1.4% | Global | Short term (≤ 2 years) |
| Stricter data-privacy regulations (GDPR/CCPA etc.) | -1.8% | EU and North America | Medium term (2-4 years) |
| Generative-AI answer engines cutting SERP clicks | -2.1% | Global, developed markets first | Long term (≥ 4 years) |
| Marketplace ecosystems fragmenting search traffic | -1.2% | Global, e-commerce focus | Medium term (2-4 years) |
| Source: Mordor Intelligence | |||
Frequent Search-Algorithm Volatility
Google released 4,725 tweaks in 2022—nearly 13 per day—forcing agencies into a perpetual monitoring cycle that raises labor and tooling costs. Abrupt shifts, like the March 2024 Helpful Content Update, can erase months of progress overnight, straining client trust and widening performance variance.
Generative-AI Answer Engines Cutting SERP Clicks
Features such as Google’s AI Overview now satisfy queries directly on the results page, trimming outbound clicks and diluting the historic link between rank position and traffic yield. Providers must pivot toward snippet ownership, brand-embedded answers and GEO to preserve visibility, adding measurement complexity and pressuring legacy pricing models that reference traffic metrics.
*Our forecasts treat driver/restraint impacts as directional, not additive. The impact forecasts reflect baseline growth, mix effects, and variable interactions.
Segment Analysis
By Service Type: On-Page Foundations Counter Rising Voice and Visual Complexity
On-Page SEO anchored 41.80% of 2025 revenue, underlining the continued importance of optimizing copy, tags, and internal link logic for crawl equity. The segment forms the bedrock for every campaign, ensuring that content relevance, semantic breadth, and user experience satisfy quality signals. In dollar terms, On-Page activities accounted for USD 31.29 billion of the search engine optimization services market size in 2025, and the practice remains non-negotiable for all verticals. Yet innovation pressure is shifting spend toward new specialisms. Voice and Visual Search SEO, expanding at 20.10% CAGR, exploits schema markup, entity detection, and multi-modal file optimization to ride the proliferation of assistants and camera-based lookup features. Service providers able to translate spoken queries into structured data and pair images with rich metadata are capturing premium contracts, especially from retailers with large catalogues seeking incremental conversion from voice prompts.
Off-Page and link-earning retain a defensive role, but their relative growth is moderating as algorithms prioritize contextual relevance over raw backlink volume. Technical SEO, covering performance tuning and structured data validation, is regaining prominence amid Google’s Page Experience signals, while Local SEO gains traction as businesses chase zero-click map packs. Parallel to these shifts, Generative Engine Optimization (GEO) is emerging as a billable line item. Agencies are now fine-tuning knowledge graphs and prompt surfaces so that brand content feeds LLM answer engines, a service increasingly earmarked by enterprise retainers valued above USD 50,000 annually. Together, these sub-disciplines knit a layered portfolio that enables vendors to upsell existing accounts and raise average contract value throughout the forecast window.


By Organization Size: SME Breadth Meets Enterprise Budget Surge
SMEs contributed 58.40% of total 2025 billings, validating that smaller firms view organic search as a leveler against better-funded rivals. Lean internal teams also prefer outsourcing technical expertise rather than building in-house capability, making packaged SEO solutions attractive. Despite their volume advantage, SME budgets remain sensitive to economic fluctuations, resulting in higher churn and shorter contract terms. In contrast, the enterprise and multinational tier is accelerating at 16.10% CAGR, fueled by global site architectures, multi-language rollouts, and complex compliance mandates. Semrush recently disclosed that customers paying upward of USD 50,000 per year jumped 86%, lifting enterprise annual recurring revenue to USD 424.7 million in Q1 2025.
Large enterprises, situated between these two extremes, pursue multi-channel content orchestration and require granular reporting to reconcile the impact of SEO with omnichannel KPIs. Micro businesses are the beneficiaries of democratized SaaS toolkits that lower the entry bar; however, they often engage via project-based gigs rather than multi-year retainers, limiting predictable revenue. Providers that tier their offers from templated starter packs to bespoke global retainers achieve broader wallet share and cushion cyclical budget shifts across client sizes.
By End-User Industry: Commerce Scale Versus Healthcare Specialization
E-commerce and Retail held 26.25% of sector revenue in 2025 as merchants race to outrank competitors and offset paid-search inflation. Marketplace SEO, focusing on Amazon A9 or Walmart Connect ranking factors, is now bundled with broader organic strategies to protect share of voice across every buying channel. Healthcare and Life-Sciences, expanding at 17.40% CAGR, exemplifies how regulated content demands breed specialist agencies. Stringent compliance with patient privacy rules and medical review boards narrows the talent pool able to produce search-safe copy, enabling premium pricing and stickier relationships. In this setting, the search engine optimization services market size for healthcare is projected to reach a multi-billion-dollar level by 2030, underpinning a multi-billion-dollar sub-opportunity for vendors with clinical writing credentials.
IT and Telecom remains a technology-driven mainstay, focusing on developer audience outreach and high-intent keyword capture around SaaS subscriptions. Hospitality and Travel, rebounding post-pandemic, is leaning on local and voice search to convert spontaneous, near-me queries. BFSI players prioritize trust signals, E-A-T (Expertise, Authoritativeness, Trustworthiness) compliance and content security given the sensitivity of financial data. Each vertical's nuance encourages service providers to form industry pods with domain-specific strategists and, in some cases, proprietary keyword taxonomies that act as competitive moats.
By Service Model: Predictable Retainers Face Outcome-Based Momentum
Retainer/Subscription contracts still represent 61.95% of spend because continuous algorithm shifts require ongoing monitoring, content refreshes and technical upkeep. Clients appreciate stable monthly fees that map to known deliverables, and agencies rely on the recurring revenue to fund RandD and staff training. Outcome-Based pricing, however, is growing fastest at 18.40% CAGR as buyers demand proof of ROI. These agreements tie compensation to rankings, traffic uplift or lead volume, transferring risk to providers but also enabling premium upside. Firms deploying proprietary analytics platforms can more confidently commit to performance thresholds, using data transparency as a selling point.
Project-Based work caters to defined milestones such as site migrations or accessibility overhauls, while Hourly-Based consulting persists for discrete audits and emergency troubleshooting. Hybrid models are emerging in which a small retainer ensures baseline service and a performance kicker rewards above-plan results, aligning incentives without overexposing the agency to exogenous algorithm shocks.
By Access Channel: Mobile First, Voice Next
Mobile devices accounted for 63.5% of organic traffic in 2024, validating Google’s mobile-first indexing doctrine. Page speed, responsive layout and intuitive navigation now dictate crawl equity, amplifying demand for developers who can harmonize UX, Core Web Vitals and structured data. Voice search, climbing at 22.6% CAGR, builds on this mobile dominance. Conversational phrasing, local intent and zero-result answers reshape keyword research as assistants interpret natural language. Desktop usage remains critical for B2B research, longer content formats and conversion events requiring form fills. For agencies, mastering cross-device technical nuance is non-negotiable if they hope to defend premium retainers from pure-play specialists.
Geography Analysis
North America captured 33.90% of global revenue in 2025, reflecting entrenched digital marketing sophistication and the presence of major technology platforms that constantly redefine best practice. The United States holds the lion's share thanks to large enterprise budgets and high regulatory compliance standards that value advanced reporting and data governance. Canada adds incremental upside through cross-border optimization requirements and bilingual content mandates. Regulatory frameworks such as CCPA mirror GDPR's privacy orientation, steering budgets toward specialized service providers that can balance performance with consent management needs. Enterprise clients frequently demand multi-business-unit rollouts, propelling long-term retainers that bundle technical SEO, content strategy and site architecture consulting.
APAC is the growth powerhouse, projected to clock a 13.55% CAGR through 2031. Smartphone adoption rates surpass global averages, and digital advertising spend grew 11.1% year over year in 2024, with search absorbing 47% of budgets. Markets from India to Indonesia rely heavily on mobile search for product discovery, motivating local merchants to invest in visibility. China's Baidu-centric ecosystem demands native language optimization, ICP licensing, and firewall latency mitigation. Vendors that pair Mandarin-fluent strategists with local hosting solutions can unlock sizable contracts from cross-border brands. Japan and South Korea, while mature, maintain premium retainer potential due to sophisticated e-commerce sectors and early adoption of voice-controlled shopping.
Europe showcases a balanced but compliance-intensive environment. GDPR drove early investment in consent management platforms and privacy-safe analytics, opening niches for agencies experienced in lawful data processing. Multi-language optimization remains a perennial challenge across 24 official EU languages, reinforcing the value of localization expertise. Germany, the United Kingdom and France anchor regional spend, whereas the Nordics and Benelux reward providers who excel at ethical linking and sustainability messaging. The confluence of strong consumer rights, stringent data rules and fast-moving AI guidelines positions Europe as a proving ground for privacy-preserving SEO, knowledge that agencies can later export to other regions as regulations tighten globally.


Competitive Landscape
The search engine optimization services market remains fragmented, yet the flight to quality is unmistakable. Hundreds of small consultancies offer basic audits and keyword research, but mid-tier and enterprise clients increasingly gravitate toward full-stack providers bundling platform technology with strategic consulting. Semrush's acquisition of Search Engine Land strengthened its content authority by embedding tools within a news ecosystem, a move that consolidated its influence over both practitioners and best-practice discourse. The conductor's earlier takeover of Searchmetrics expanded its European reach and bolstered AI diagnostics, indicating that scale and IP ownership are becoming entry tickets to Fortune 1000 engagements.
Private equity is fueling roll-ups that focus on vertical expertise. Trinity Hunt Partners launched a healthcare-focused platform by investing in TNT Dental to pursue cross-sell synergies across medical, legal, and dental niches. Bridgepoint's acquisition of The MTM Agency through IDHL reflects a similar thesis around integrated performance marketing at scale. Providers tout proprietary crawlers, automated content briefs, and predictive rank-shift models as differentiators. The entrance of AI-native start-ups specializing in GEO and voice-query optimization threatens incumbents that fail to refresh their tech stack.
White-space remains in highly regulated sectors. Agencies boasting HIPAA-compliant analytics pipelines, multilingual medical writers and schema-rich dosage data can charge premium retainers. Performance-linked pricing, although only 19% of spend, is expanding as clients seek accountability. Vendors with deep data lakes and transparent reporting frameworks are positioned to absorb that risk. Overall, the top five global players collectively control well under 30% of industry billings, indicating ample runway for both consolidation and niche challenger growth.
Search Engine Optimization (SEO) Services Industry Leaders
-
Ahrefs Pte. Ltd.
-
iCONQUER Ltd
-
Mangools
-
Semrush
-
Surfer SEO
- *Disclaimer: Major Players sorted in no particular order

Recent Industry Developments
- March 2025: Trinity Hunt Partners invested in TNT Dental to build a vertical digital marketing platform targeting healthcare, legal and medical practices, underscoring private-equity interest in specialized SEO roll-ups.
- February 2025: IDHL acquired The MTM Agency, adding 80 employees and broadening UK reach, as Bridgepoint accelerates the formation of an integrated performance-marketing group.
- February 2025: Semrush posted Q4 2024 revenue of USD 102.6 million and full-year revenue of USD 376.8 million, a 22% jump, while confirming continued AI tooling investments and a CEO succession plan.
- January 2025: Marketing-services MandA volume surpassed pre-covid levels, with notable deals such as DealerOn buying Sincro and Hibu securing RevLocal to deepen local SEO capabilities.


Research Methodology Framework and Report Scope
Market Definitions and Key Coverage
Our study defines the search engine optimization services market as fee-based activities that boost a client's organic visibility on general-purpose search engines. We cover on-page, technical, off-page, local, ecommerce, voice, and visual search optimization work delivered by agencies or specialized consultants worldwide.
Scope exclusion: Spend on paid search advertising and stand-alone SEO software licenses is left outside this assessment.
Segmentation Overview
-
By Service Type
- On-Page SEO
- Off-Page / Link-Building SEO
- Technical SEO
- Local and Hyperlocal SEO
- E-commerce / Marketplace SEO
- Voice and Visual Search SEO
- Video and Image SEO
-
By Organization Size
- Small and Medium Enterprises
- Large Enterprises
-
By End-User Industry
- E-commerce and Retail
- IT and Telecom
- Hospitality and Travel
- Real Estate and Construction
- Healthcare and Life-Sciences
- BFSI
- Education
- Media and Entertainment
- Others
-
By Service Model
- Subscription / Retainer
- Project-Based
- Hourly-Based
- Performance / Outcome-Based
-
By Access Channel
- Desktop Search
- Mobile Search
- Voice Search
-
By Geography
-
North America
- United States
- Canada
- Mexico
-
South America
- Brazil
- Argentina
- Rest of South America
-
Europe
- Germany
- United Kingdom
- France
- Italy
- Spain
- Rest of Europe
-
Asia-Pacific
- China
- India
- Japan
- South Korea
- Australia and New Zealand
- Rest of Asia-Pacific
-
Middle East
- Israel
- Saudi Arabia
- United Arab Emirates
- Turkey
- Rest of Middle East
-
Africa
- South Africa
- Nigeria
- Egypt
- Rest of Africa
-
North America
Detailed Research Methodology and Data Validation
Primary Research
We spoke with independent consultants, global agency executives, in-house marketing leads across ecommerce, healthcare, travel, and SaaS, and regional trade bodies in North America, Europe, Asia-Pacific, and MENA. Their insights confirmed price bands, typical project counts, channel-adoption shifts, and the rising tilt toward performance-linked retainers.
Desk Research
We began with public datasets that trace the digital economy, such as International Telecommunication Union internet-user counts, World Bank SME numbers, IAB organic-traffic benchmarks, W3Techs adoption ratios, and customs logs that hint at hosting hardware flows. D&B Hoovers company filings and Dow Jones Factiva news helped us flag revenue breakouts from leading agencies, anchoring regional splits, while national portals like the US Bureau of Labor Statistics and India's MCA supplied wage norms that enrich cost models. Patent repositories accessed through Questel showed how voice and visual search tools diffuse, offering extra context for growth rates. These references are illustrative only; many other open and paid sources informed data collection and checks.
Market-Sizing & Forecasting
The top-down model starts with worldwide online marketing budgets, removes paid media to isolate the organic search pool, then applies penetration factors by firm size and industry. Sampled average selling price multiplied by active client volumes from surveyed agencies serves as a bottom-up check, and any gap is smoothed through midpoint weighting. Key variables include global internet-user growth, mobile share of query volume, average SEO contract value, major algorithm update frequency, and GDP-weighted ecommerce sales. A multivariate regression using mobile share and ecommerce value drives the forecast, which experts adjust under conservative, base, and optimistic scenarios.
Data Validation & Update Cycle
Mordor analysts test outputs against historic agency disclosures, ITU traffic data, and Google Trend indices. We review variances above five percent, rerun interviews if needed, and submit the file for a senior peer check. Reports refresh annually, with interim updates when material events such as large algorithm changes or mergers surface.
Why Our SEO Baseline Commands Reliability
Published estimates often diverge because each firm slices the market and timelines differently, and SEO spend sits inside broader marketing buckets that are hard to untangle. Big gaps appear when studies mix software fees with service retainers, apply uniform pricing to every region, overlook freelance work, or convert currencies only once a year.
According to Mordor Intelligence, we separate software and convert quarterly, keeping our 2025 base of USD 74.90 billion grounded, and we refresh after every major Google core update.
Benchmark comparison
| Market Size | Anonymized source | Primary gap driver |
|---|---|---|
| 74.90 bn (2025) | Mordor Intelligence | - |
| 92.74 bn (2025) | Global Consultancy A | Bundles software platforms with service fees |
| 81.46 bn (2024) | Industry Research Firm B | Single annual currency conversion, limited freelance coverage |
| 89.10 bn (2024) | Trade Journal C | Relies on advertiser surveys skewed toward large US agencies |
The comparison shows that once scope creep and conversion effects are stripped away, Mordor's disciplined segmentation and rolling checks deliver a balanced, transparent baseline that decision-makers can trust.


Key Questions Answered in the Report
What is the current value of the search engine optimization services market?
The sector generated USD 83.98 billion in 2026 and is tracking toward USD 148.86 billion by 2031 on a 12.12% CAGR trajectory.
Which service type generates the most revenue today?
On-Page SEO remains the largest slice, contributing 41.80% of 2025 revenue, although Voice and Visual Search SEO is growing fastest at 20.10% CAGR.
Why is APAC viewed as the highest-growth region?
Rapid smartphone uptake, 11.1% annual growth in digital-ad spend and the dominance of mobile search underpin APAC’s projected 13.55% CAGR through 2031.
How are pricing models evolving in the industry?
Retainers still account for 61.95% of spend, yet outcome-based contracts are scaling at 18.40% CAGR as clients push for performance accountability.
What impact will AI answer engines have on SEO ROI?
Generative features that surface direct answers may trim click-throughs, prompting providers to optimize for snippets and generative engine visibility to safeguard traffic value.
Which vertical is forecast to expand fastest?
Healthcare and Life-Sciences is projected to rise at 17.40% CAGR to 2031, driven by patient search behavior and stringent content-quality requirements.
Page last updated on:


