
Technology, Media and Telecom
5th MayPricing Strategy for Semiconductor Components
3 Min Read
The Sales Intelligence Market is Segmented by Component (Solutions [Platform-Based Solutions, and More], Services [Professional Services, and More]), Deployment (Cloud, On-Premises, and Hybrid), Enterprise Size (SMEs, Large Enterprises), Sales Channel / Function (B2B Direct Sales, and More), End-User Industry (IT and Telecom, BFSI, and More), Subscription / Pricing Model (Annual Subscription, and More), and Geography.
Market Overview
| Study Period | 2020 - 2031 |
|---|---|
| Market Size (2026) | USD 4.99 Billion |
| Market Size (2031) | USD 9.15 Billion |
| Growth Rate (2026 - 2031) | 12.89 % CAGR |
| Fastest Growing Market | Asia Pacific |
| Largest Market | North America |
| Market Concentration | Medium |
Major Players *Disclaimer: Major Players sorted in no particular order. Image © Mordor Intelligence. Reuse requires attribution under CC BY 4.0. |
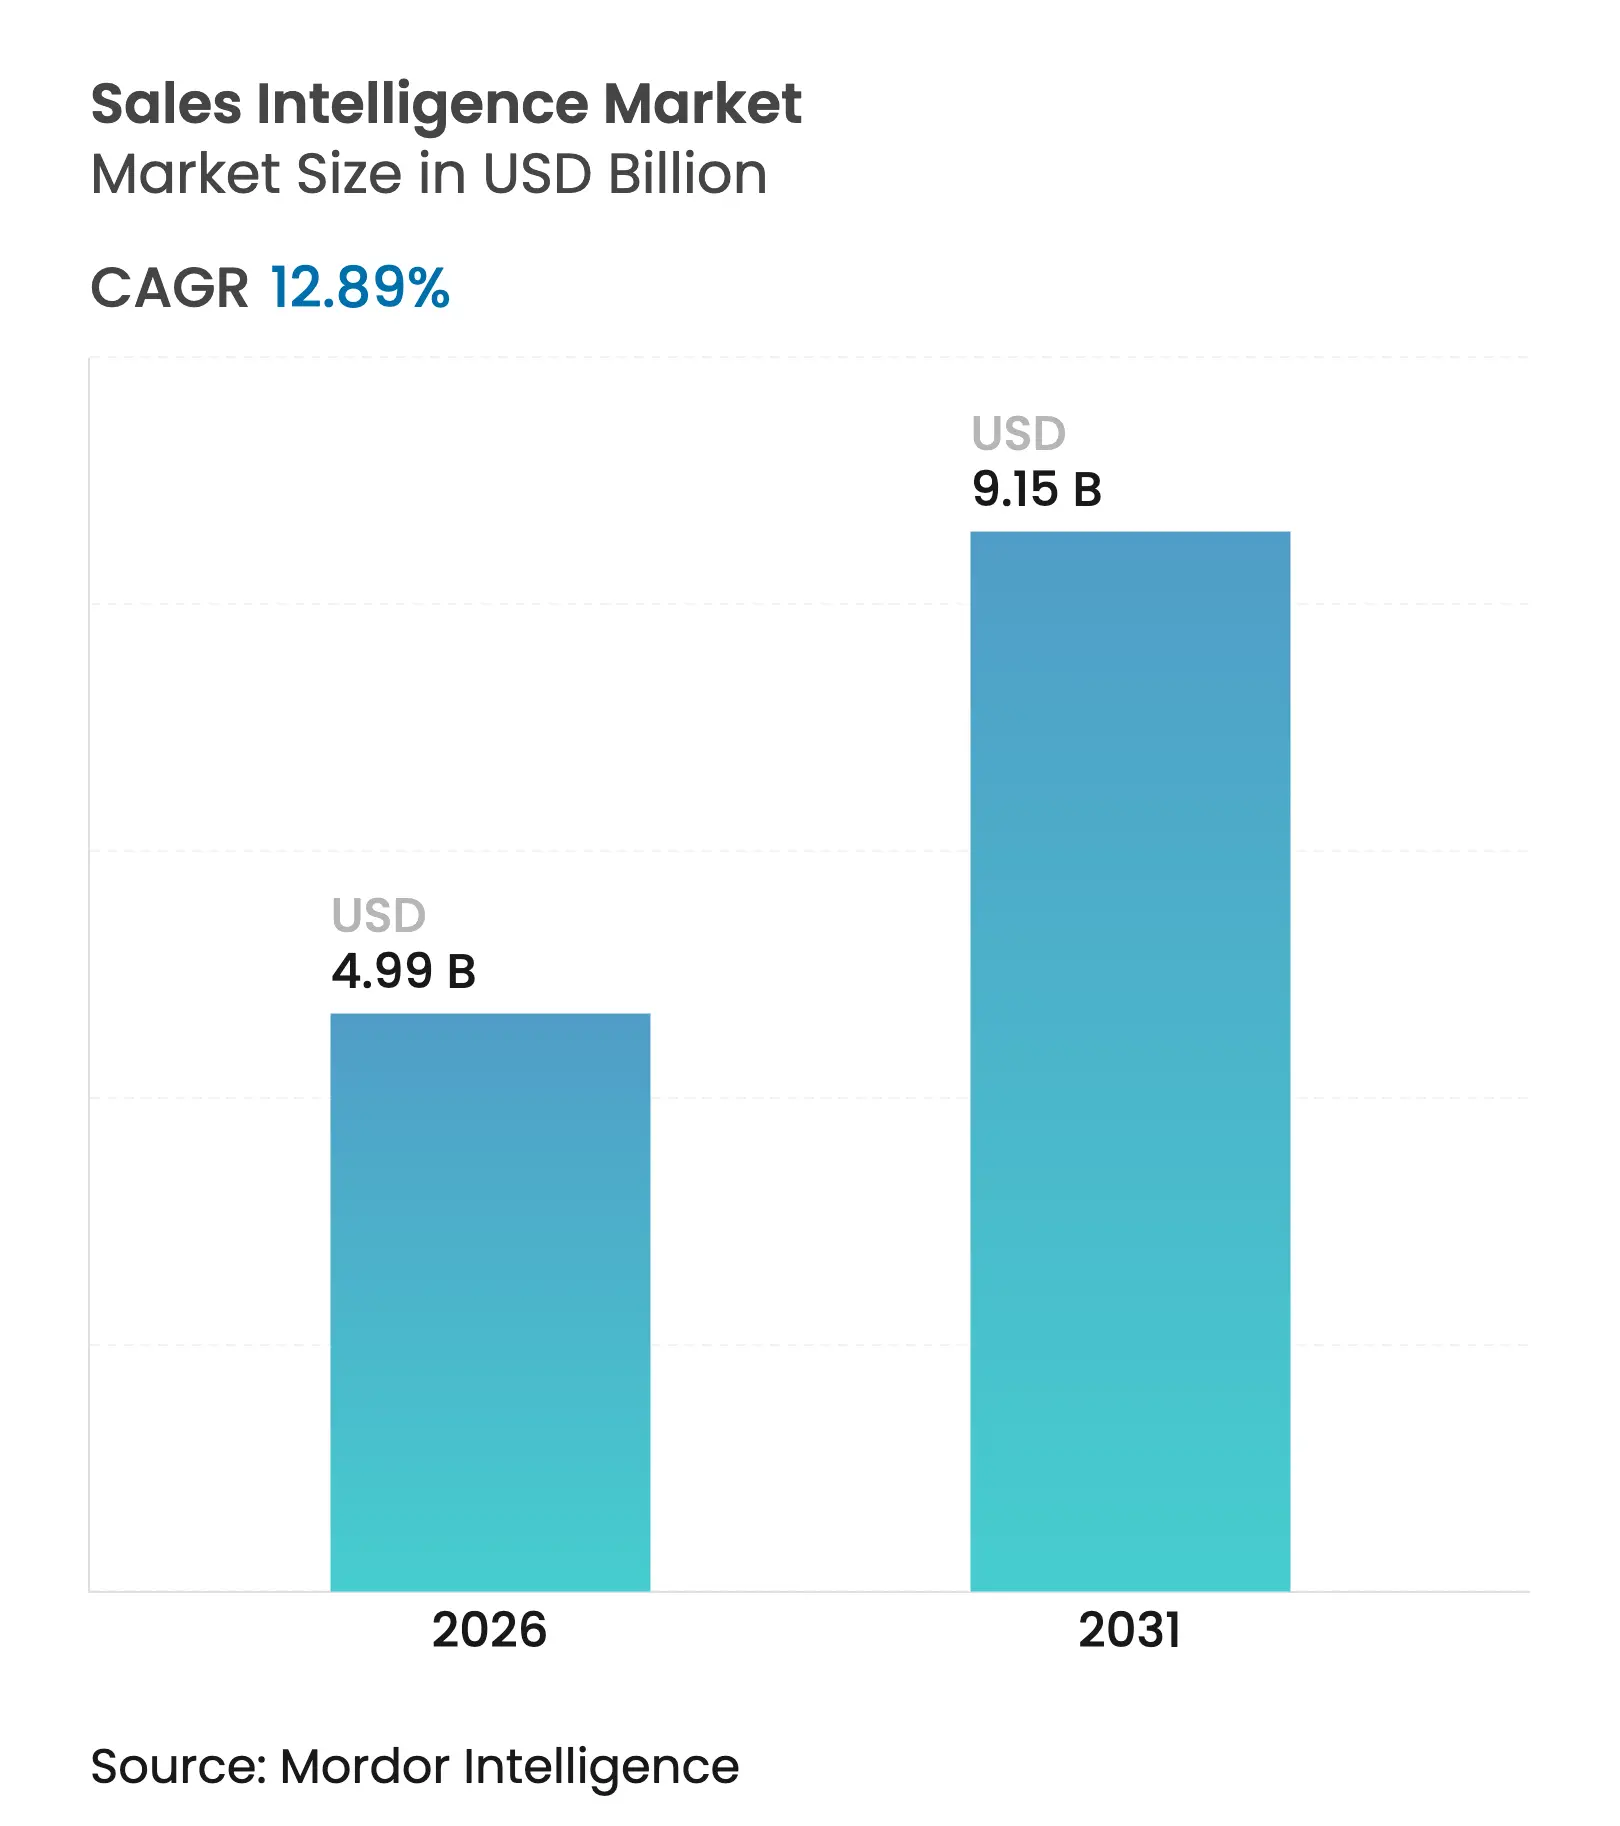
The sales intelligence market size is expected to grow from USD 4.42 billion in 2025 to USD 4.99 billion in 2026 and is forecast to reach USD 9.15 billion by 2031 at 12.89% CAGR over 2026-2031. Demand accelerates as artificial intelligence shortens prospect-research cycles from 3–5 hours to 10–15 minutes by digesting intent signals from more than 100,000 sources. Revenue-operations alignment continues to reshape competitive positioning because 75% of high-growth companies plan to formalize RevOps by 2025. Cloud deployment dominates today, yet enterprises are pivoting toward hybrid models that balance sovereignty with scalability, and pay-as-you-go pricing brings enterprise-grade capabilities to smaller firms. Geographically, North America holds the lion’s share, while Asia-Pacific registers the fastest compound growth as organizations leapfrog to AI-native sales stacks.
Key Report Takeaways
Note: Market size and forecast figures in this report are generated using Mordor Intelligence's proprietary estimation framework, updated with the latest available data and insights as of 2026.
Driver Impact Analyis
| Driver | (~) % Impact on CAGR Forecast | Geographic Relevance | Impact Timeline | |||
|---|---|---|---|---|---|---|
Increasing demand for improved customer targeting
Increasing demand for improved customer targeting
| +3.2% | Global, highest in North America and EU | Medium term (2-4 years) |
(~) % Impact on CAGR Forecast
:
+3.2%
|
Geographic Relevance
:
Global, highest in North America and EU
|
Impact Timeline
:
Medium term (2-4 years)
|
Growing need for data enrichment and content optimization
Growing need for data enrichment and content optimization
| +2.8% | Global, strong in Asia-Pacific | Short term (≤ 2 years) | |||
AI/ML-driven predictive sales analytics adoption
AI/ML-driven predictive sales analytics adoption
| +4.1% | Global, led by North America | Medium term (2-4 years) | |||
Integration of niche buyer-intent data co-ops
Integration of niche buyer-intent data co-ops
| +1.9% | North America and EU, expanding to Asia-Pacific | Long term (≥ 4 years) | |||
Privacy-preserving synthetic data for B2B contact intel
Privacy-preserving synthetic data for B2B contact intel
| +1.4% | EU and North America | Long term (≥ 4 years) | |||
Rise of RevOps driving unified intelligence stacks
Rise of RevOps driving unified intelligence stacks
| +3.7% | Global, strongest in enterprise-heavy markets | Medium term (2-4 years) | |||
| Source: Mordor Intelligence | ||||||
Growing Need for Data Enrichment and Content Optimization
B2B contact records now decay at a 30% annual rate, forcing companies to refresh databases continuously or risk mis-targeted campaigns. Healthcare adoption is especially strong because providers such as Ampliz supply physician-level insights that generalist datasets overlook cognism. Enrichment also underpins account-based marketing, a strategy already active at 70% of B2B organizations. Continuous refresh cycles improve email deliverability, shorten sales cycles, and safeguard sender reputations that would otherwise suffer from outdated data.
AI/ML-Driven Predictive Sales Analytics Adoption
Microsoft’s AI business crossed a USD 13 billion annual run rate with 175% year-over-year growth, proving that enterprises increasingly embed predictive engines directly in sales workflows [1]Microsoft Corporation, “AI Business Momentum,” microsoft.com. Generative AI now drafts hyper-personalized outreach by evaluating real-time browsing and engagement signals instead of static firmographics. Providers report tenfold gains in research throughput and an 8.75x uplift in qualified-meeting generation after deploying agentic AI that automates prospect discovery. These performance improvements encourage board-level investment, especially in technology hubs where buyers expect immediate, data-driven engagement. As predictive models mature, sales teams rely less on manual list building and more on algorithmic scoring that recalibrates after every buyer interaction. The result is a virtuous cycle of higher win rates feeding larger training datasets that further raise model accuracy.
Integration of Niche Buyer-Intent Data Co-ops
Cognism’s alliance with Bombora highlights how third-party intent pools help sellers detect in-market accounts months before an RFP surfaces. Demandbase scores engagement by benchmarking content consumption among peer accounts, enabling precise sequencing that centers outreach on the most purchase-ready prospects. Trending-intent functions, which spotlight emerging topics, allow reps to target sudden spikes in interest and capture deals during early evaluation phases. Intent co-ops, therefore, shift the competitive clock forward, permitting smaller teams to pre-empt incumbents despite leaner resources. For enterprises, the upside lies in reallocating budget toward high-probability accounts, trimming low-value activity, and boosting overall pipeline velocity.
Rise of RevOps Driving Unified Intelligence Stacks
Organizations that deploy revenue-operations frameworks grow 19% faster and log 15% higher profitability compared with siloed peers. Microsoft’s Dynamics 365 embedding of AI illustrates how a single data layer feeds forecasting, enablement, and post-sale success analytics. RevOps removes conflicting metrics, replacing disparate dashboards with a shared source of truth that spans marketing and customer success. The result is sharper quota planning, better renewal targeting, and smoother expansion motions. The talent market underscores maturity: companies now recruit “Go-to-Market engineers” who blend process re-design with platform administration. As adoption spreads, vendors integrate CPQ, enrichment, and conversation intelligence into one interface, making platform consolidation a central buying criterion.
Restraint Impact Analysis
| Restraint | (~) % Impact on CAGR Forecast | Geographic Relevance | Impact Timeline | |||
|---|---|---|---|---|---|---|
Data privacy and compliance risks
Data privacy and compliance risks
| −2.1% | EU and North America, expanding globally | Short term (≤ 2 years) |
(~) % Impact on CAGR Forecast
:
−2.1%
|
Geographic Relevance
:
EU and North America, expanding globally
|
Impact Timeline
:
Short term (≤ 2 years)
|
High cost/complexity of real-time data refresh
High cost/complexity of real-time data refresh
| −1.8% | Global, impacting SMEs | Medium term (2-4 years) | |||
API rate-limit constraints from core data platforms
API rate-limit constraints from core data platforms
| −1.3% | Global | Short term (≤ 2 years) | |||
Outreach noise diminishing actionable signals
Outreach noise diminishing actionable signals
| −0.9% | North America and EU | Long term (≥ 4 years) | |||
| Source: Mordor Intelligence | ||||||
Data Privacy and Compliance Risks
Nineteen US states enacted comprehensive consumer-privacy bills in 2024, producing a patchwork that sales-intelligence vendors must navigate during data collection and processing. The IAB reports that 71% of companies intend to grow first-party data reservoirs because third-party cookies are eroding and regulators scrutinize cross-domain tracking. Providers experiment with privacy-preserving synthetic data, yet validation hurdles slow near-term roll-out. Firms, therefore, devote additional budget to legal review, consent management, and audit trails, which can crowd out discretionary technology spending and temper upgrade cycles.
API Rate-Limit Constraints from Core Data Platforms
Large tech ecosystems have tightened API throughput in order to control commercialization of their user graphs. LinkedIn’s gated integration with Dynamics 365 exemplifies how platform owners privilege their own environments via bundled licenses. Rate caps throttle live-enrichment cycles, compelling vendors to cache snapshots that may grow stale in fast-moving deal cycles. Businesses suffer when lead-scoring models rely on outdated job titles or funding events, and smaller providers struggle to negotiate enterprise-grade quotas. Workarounds such as browser extensions introduce security concerns, while bespoke partnerships increase cost. The ongoing centralization of data under big-tech umbrellas therefore creates single-point-of-failure risk that purchasers must weigh when short-listing suppliers.
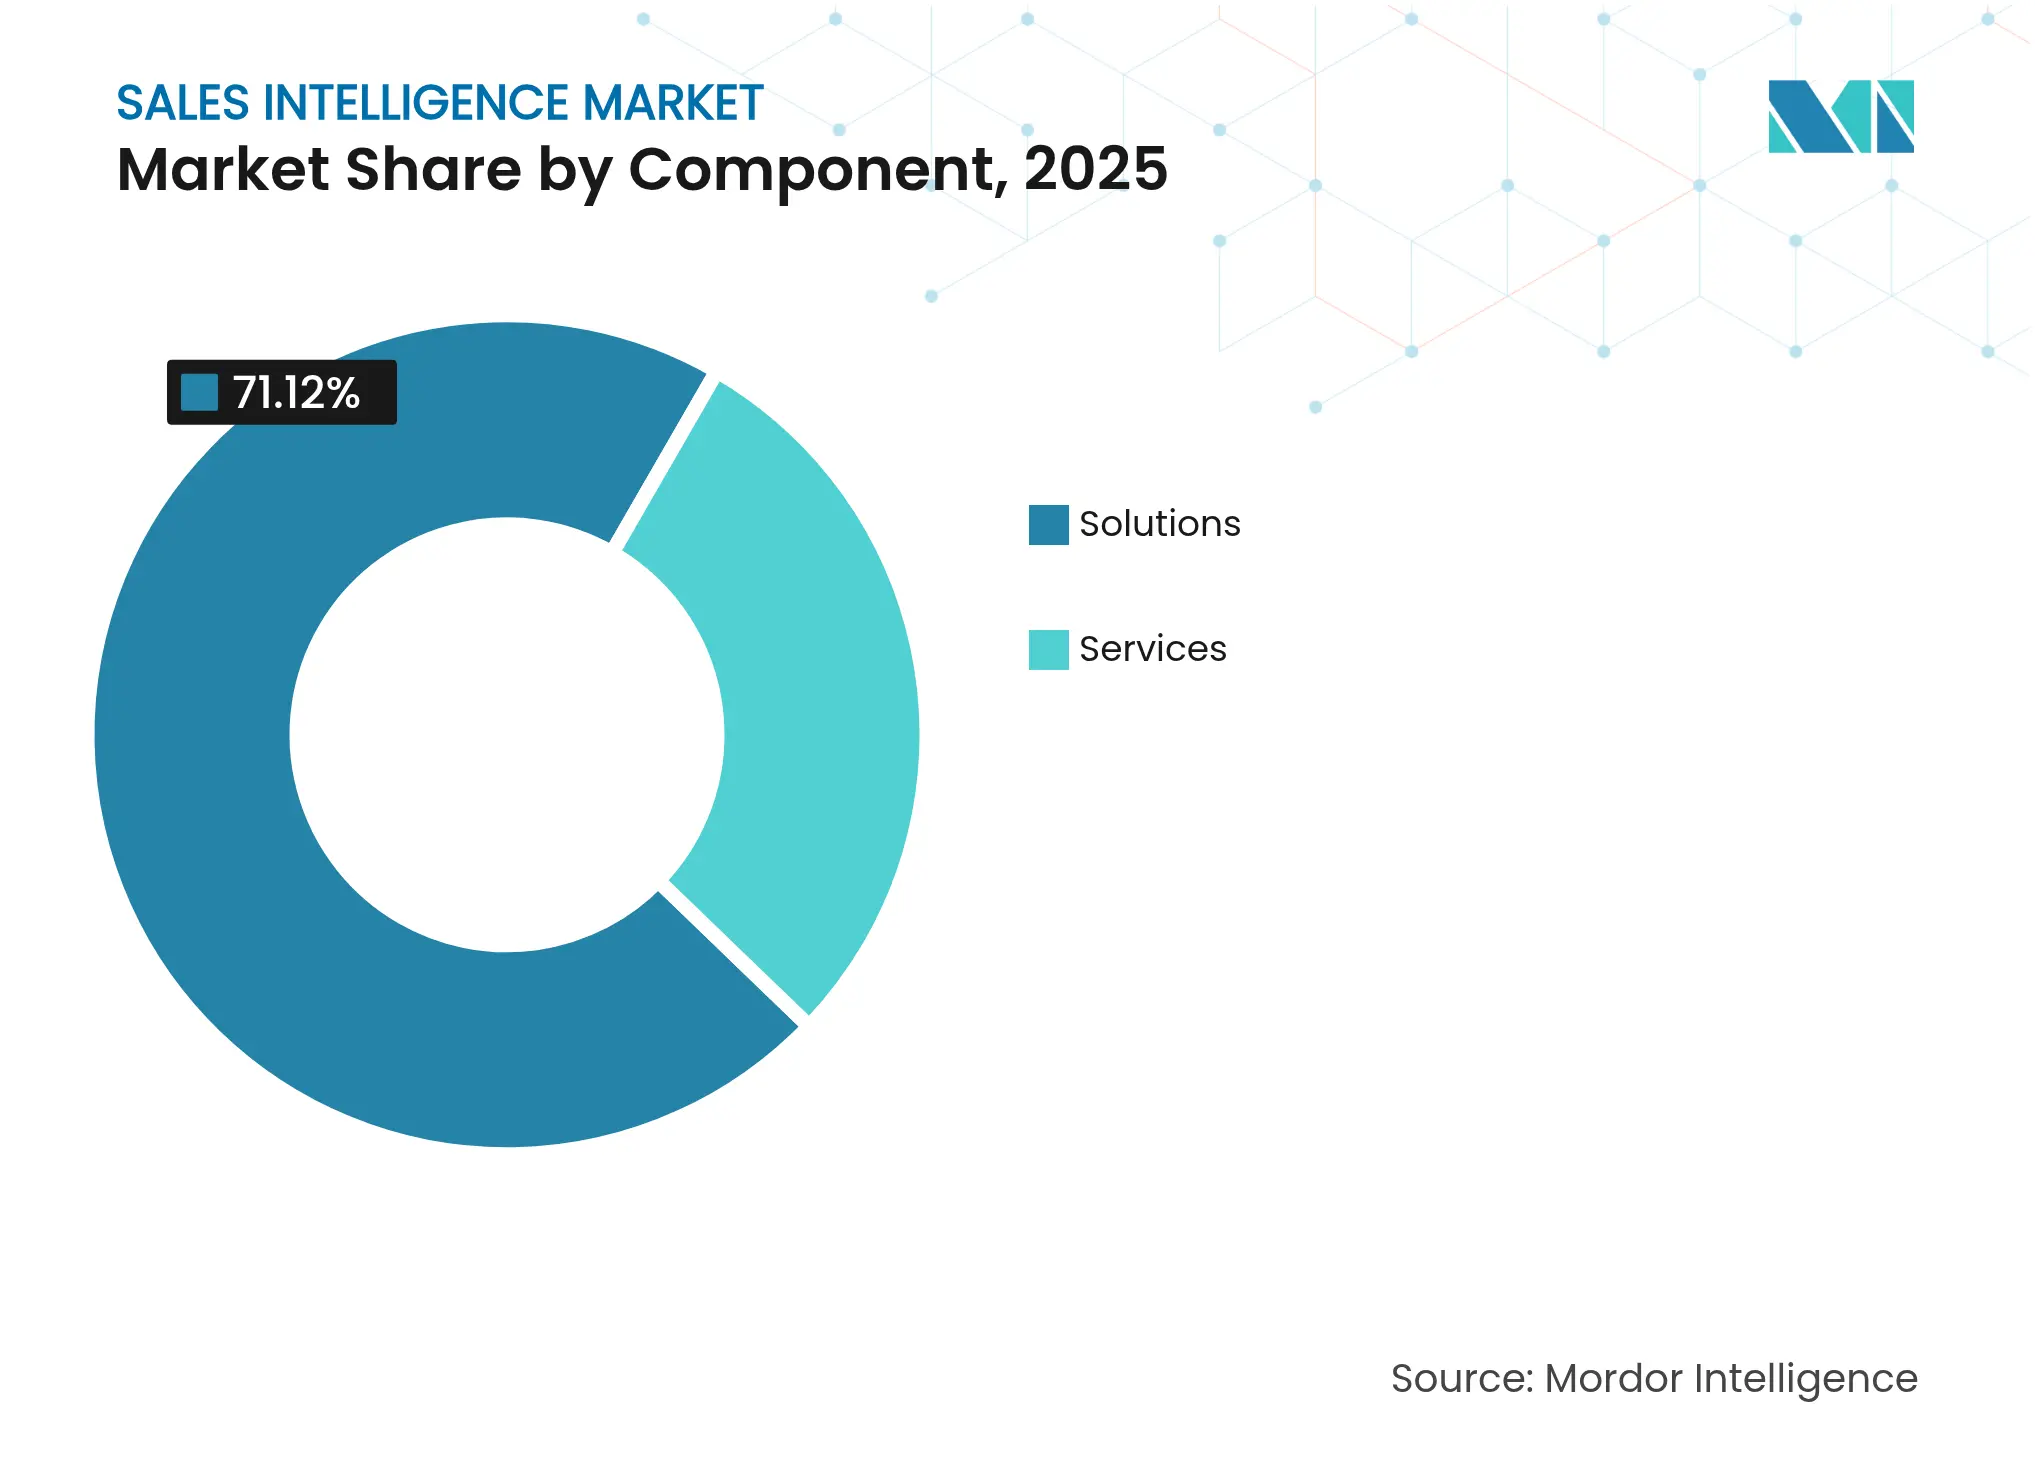
By Component: Services Acceleration Despite Solutions Dominance
Solutions secured 71.12% sales intelligence market share in 2025, reflecting widespread preference for integrated software platforms that combine enrichment, intent analytics, and workflow automation in a single interface. The services sub-segment, however, is tracking 13.26% CAGR through 2031 as firms engage consultants to map compliance frameworks, fine-tune predictive models, and orchestrate multi-cloud architectures. Solutions revenue concentrates around platform licenses that embed data refresh, scoring, and reporting dashboards, whereas services revenue stems from implementation road-maps, change-management workshops, and ongoing managed-analytics programs. Within solutions, data-enrichment and intent-signal modules remain fastest growing because users want constant profile refreshes instead of periodic list purchases. Across the segment, demand accelerates whenever new privacy rules force enterprises to audit data lineage and upgrade metadata taxonomies.
Professional-services take-up is strongest among regulated industries that cannot risk accidental exposure of protected health or financial data. Managed-services contracts also grow because smaller teams outsource enrichment workflows and prefer outcome-based agreements over headcount expansion. This interplay is pivotal to the sales intelligence market because platform outcomes rely on data hygiene, integration depth, and user-adoption training, all of which the services ecosystem supplies. Vendors have responded by bundling success programs inside tiered licenses, securing stickier revenue and mitigating churn. As AI deployments become more autonomous, advisory partners evolve toward prompt engineering, bias testing, and model-governance audits. The cumulative effect is a component landscape where software retains revenue primacy while attach-rate for specialized services widens.
Note: Segment shares of all individual segments available upon report purchase
By Deployment Mode: Hybrid Models Bridge Security and Scalability
Cloud installations captured 82.05% of the sales intelligence market size in 2025 thanks to lower capital expense, continuous feature roll-outs, and elastic compute that handles complex natural-language models. Yet hybrid deployments are compounding at 17.95% as enterprises partition sensitive attributes on-premises while processing anonymized aggregates in the cloud. This architectural swing satisfies data residency mandates in regions like the EU without sacrificing modern AI pipelines. Platform providers answer with containerized micro-services and customer-managed encryption keys that slot into zero-trust architectures.
On-premises instances now cluster within defense, financial-services, and public-sector accounts where internal auditors still dictate local processing. Growth is modest, though, because maintenance, upgrade cadences, and hardware refresh cycles restrict innovation velocity. The hybrid cohort benefits from maturation of orchestration tooling that syncs schemas and pushes inference results back to internal data lakes on schedule. As cyber-insurance premiums climb, CISOs stipulate granular audit logs both in cloud and on-site nodes, reinforcing demand for configurable deployment models. The cloud segment continues to add advanced capabilities first, incentivizing security-sensitive organizations to adopt hybrid so they can pilot AI in controlled zones. Consequently, the deployment mix illustrates how the sales intelligence market balances innovation and risk management.
By Enterprise Size: SME Democratization Through Flexible Pricing
Large enterprises owned 61.63% of 2025 revenue because they possess complex multi-channel pipelines that justify enterprise-wide intelligence roll-outs. SMEs, however, are growing revenue at 16.93% CAGR and showcase the highest new-logo velocity, mainly due to consumption-based tiers and self-serve onboarding. The sales intelligence market benefits here from transparent seat pricing, workflow templates, and native CRM connectors that eliminate custom coding. Low entry barriers let smaller firms test intent data, run ABM pilots, and expand licenses only when ROI is proven.
Apollo.io’s surge to USD 145 million ARR underscores how intuitive user experience and freemium trials draw resource-constrained teams into premium plans . Larger corporations concentrate spend on data-governance modules, integration middleware, and global roll-outs across hundreds of sales territories. Mid-market companies occupy a bridge category, graduating from point tools toward consolidated suites as their pipelines mature. This tiered adoption curve widens the total addressable opportunity because vendor packaging now maps to distinct operational sophistication levels. The democratization narrative will persist as vendors add AI copilots that surface recommendations in plain language, slashing the learning curve for first-time users.

Recognized by Experts. Trusted by Leaders.
A trusted intelligence partner to global decision-makers across 90+ countries.


By Sales Channel/Function: Inside Sales Optimization Drives Growth
B2B Direct Sales contributed 48.14% of 2025 revenue, showing that complex deal structures still depend on relationship management and executive alignment. Inside-sales use cases are scaling at 18.62% CAGR since video-enabled workflows and conversation intelligence allow teams to run enterprise-grade cycles remotely. The sales intelligence market supports this growth through call-analysis transcripts that feed coaching loops and through real-time talk-track nudges that improve objection handling. Channel-sales ecosystems maintain moderate traction as vendors court resellers to penetrate regulated or regionally distant segments.
The rise of full-cycle sellers means SDRs and AEs use the same platform modules, collapsing hand-off latencies. AI scoring also prompts expansive up-sell on existing accounts, thereby re-framing inside sales from pure lead generation into expansion revenue. Remote outreach requires granular schedule orchestration across time zones, and intelligence tools schedule sends to coincide with buyer activity peaks. Ultimately, channel mix evolution pushes vendors to architect flexible licensing assignments and user-role configurations that follow reps between functions without new logins.
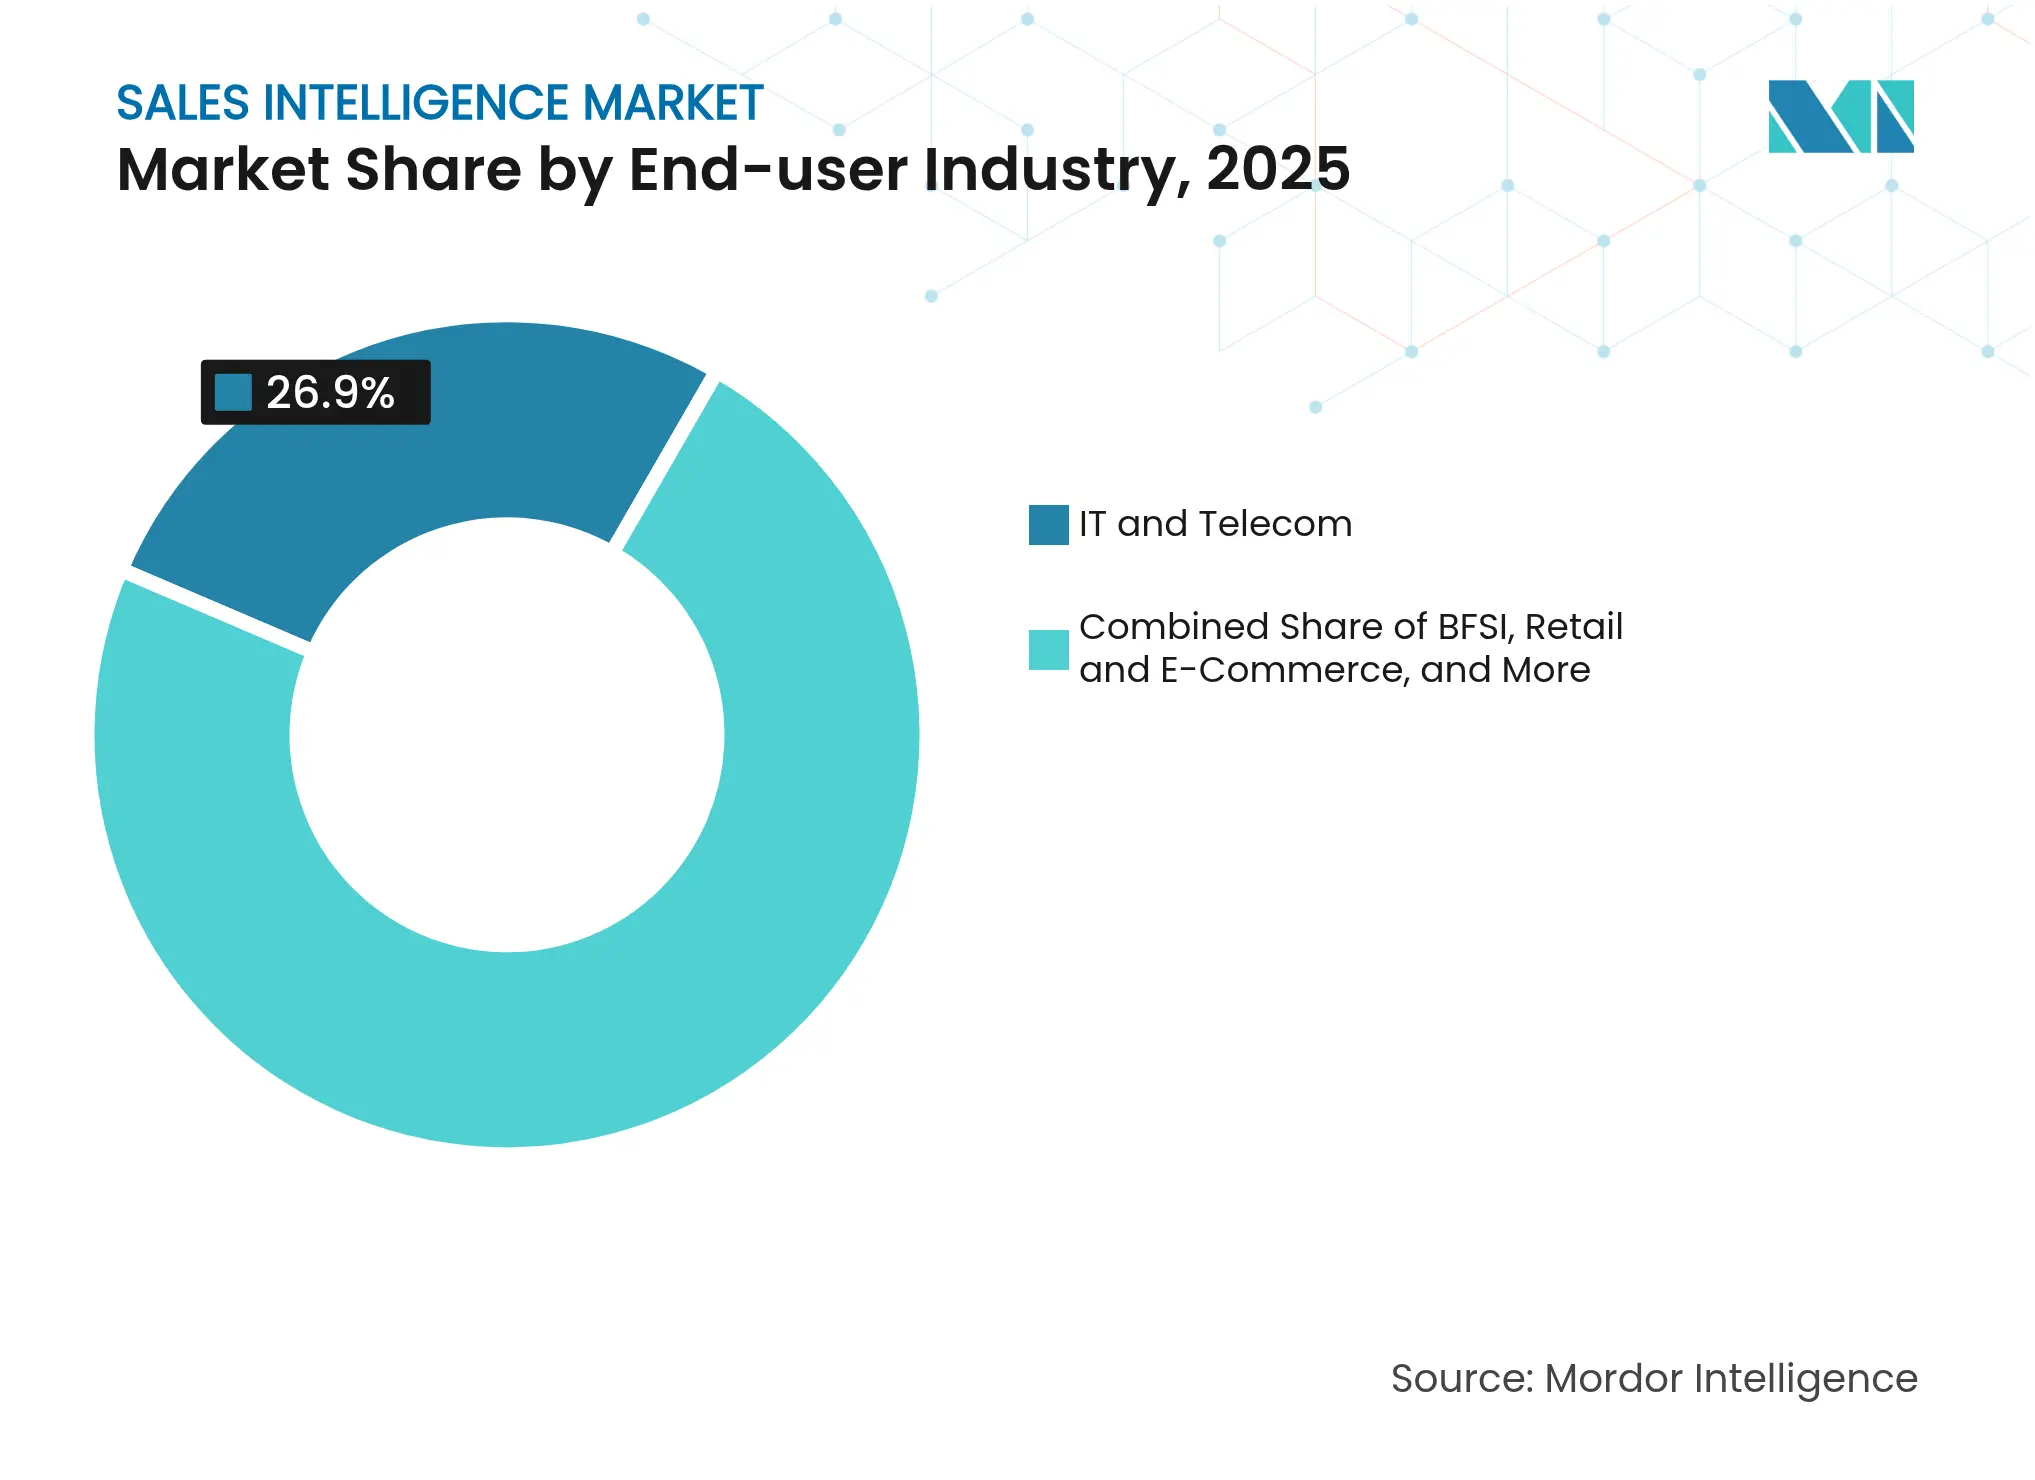
By End-User Industry: Healthcare Specialization Accelerates
IT and Telecom retained the largest revenue contribution at 26.90% in 2025 because solution-selling inherently benefits from deep technographic and funding-round visibility. Healthcare and Life Sciences is outpacing at 15.98% CAGR through 2031, propelled by stringent regulatory workflows and clinical decision-chains that demand nuanced stakeholder mapping. Providers such as LeadGenius overlay hospital-capacity metrics and physician specializations onto standard firmographics, bridging a critical data gap for med-tech sellers. Microsoft’s DAX Copilot roll-out to 400 healthcare providers further validates the appetite for conversational interfaces that reduce administrative overhead.
Manufacturing, BFSI, and Retail also expand steadily as each vertical executes digital transformation and seeks tighter pipeline predictability. Segment nuances shape data needs: manufacturers track plant modernization; banks flag compliance ownership; retailers monitor seasonal assortment changes. The sales intelligence market, therefore, witnesses a proliferation of vertical schemas, knowledge graphs, and scoring rubrics tailored to domain-specific buying committees. Industry templating lowers deployment friction and creates upsell pathways for additional data packs.
Note: Segment shares of all individual segments available upon report purchase
By Subscription/Pricing Model: Consumption-Based Models Gain Traction
Annual subscriptions generated 59.03% of 2025 revenue, mirroring enterprise preference for predictable budgeting and volume purchasing of enrichment credits. Pay-as-you-go plans are growing at 18.51% CAGR because economic uncertainty amplifies demand for cost alignment with utilization. Usage billing lets companies ratchet spend up or down alongside campaign intensity, protecting margins in downturns and encouraging experimentation during proof-of-concept phases. Monthly options suit seasonally skewed businesses that peak around trade-show months or fiscal-year close.
Maxio notes that consumption billing correlates with higher net dollar retention when paired with clear value metrics such as meetings booked or pipeline created maxio. In response, vendors invest in granular metering, overage alerts, and pre-paid credit wallets. Seat-based plans are unlikely to disappear because role-specific permissions and audit logging remain vital for compliance tracking. Nonetheless, investor scrutiny focuses on gross-margin stability under variable revenue, pushing suppliers to fine-tune data-acquisition costs and model-inference pricing.
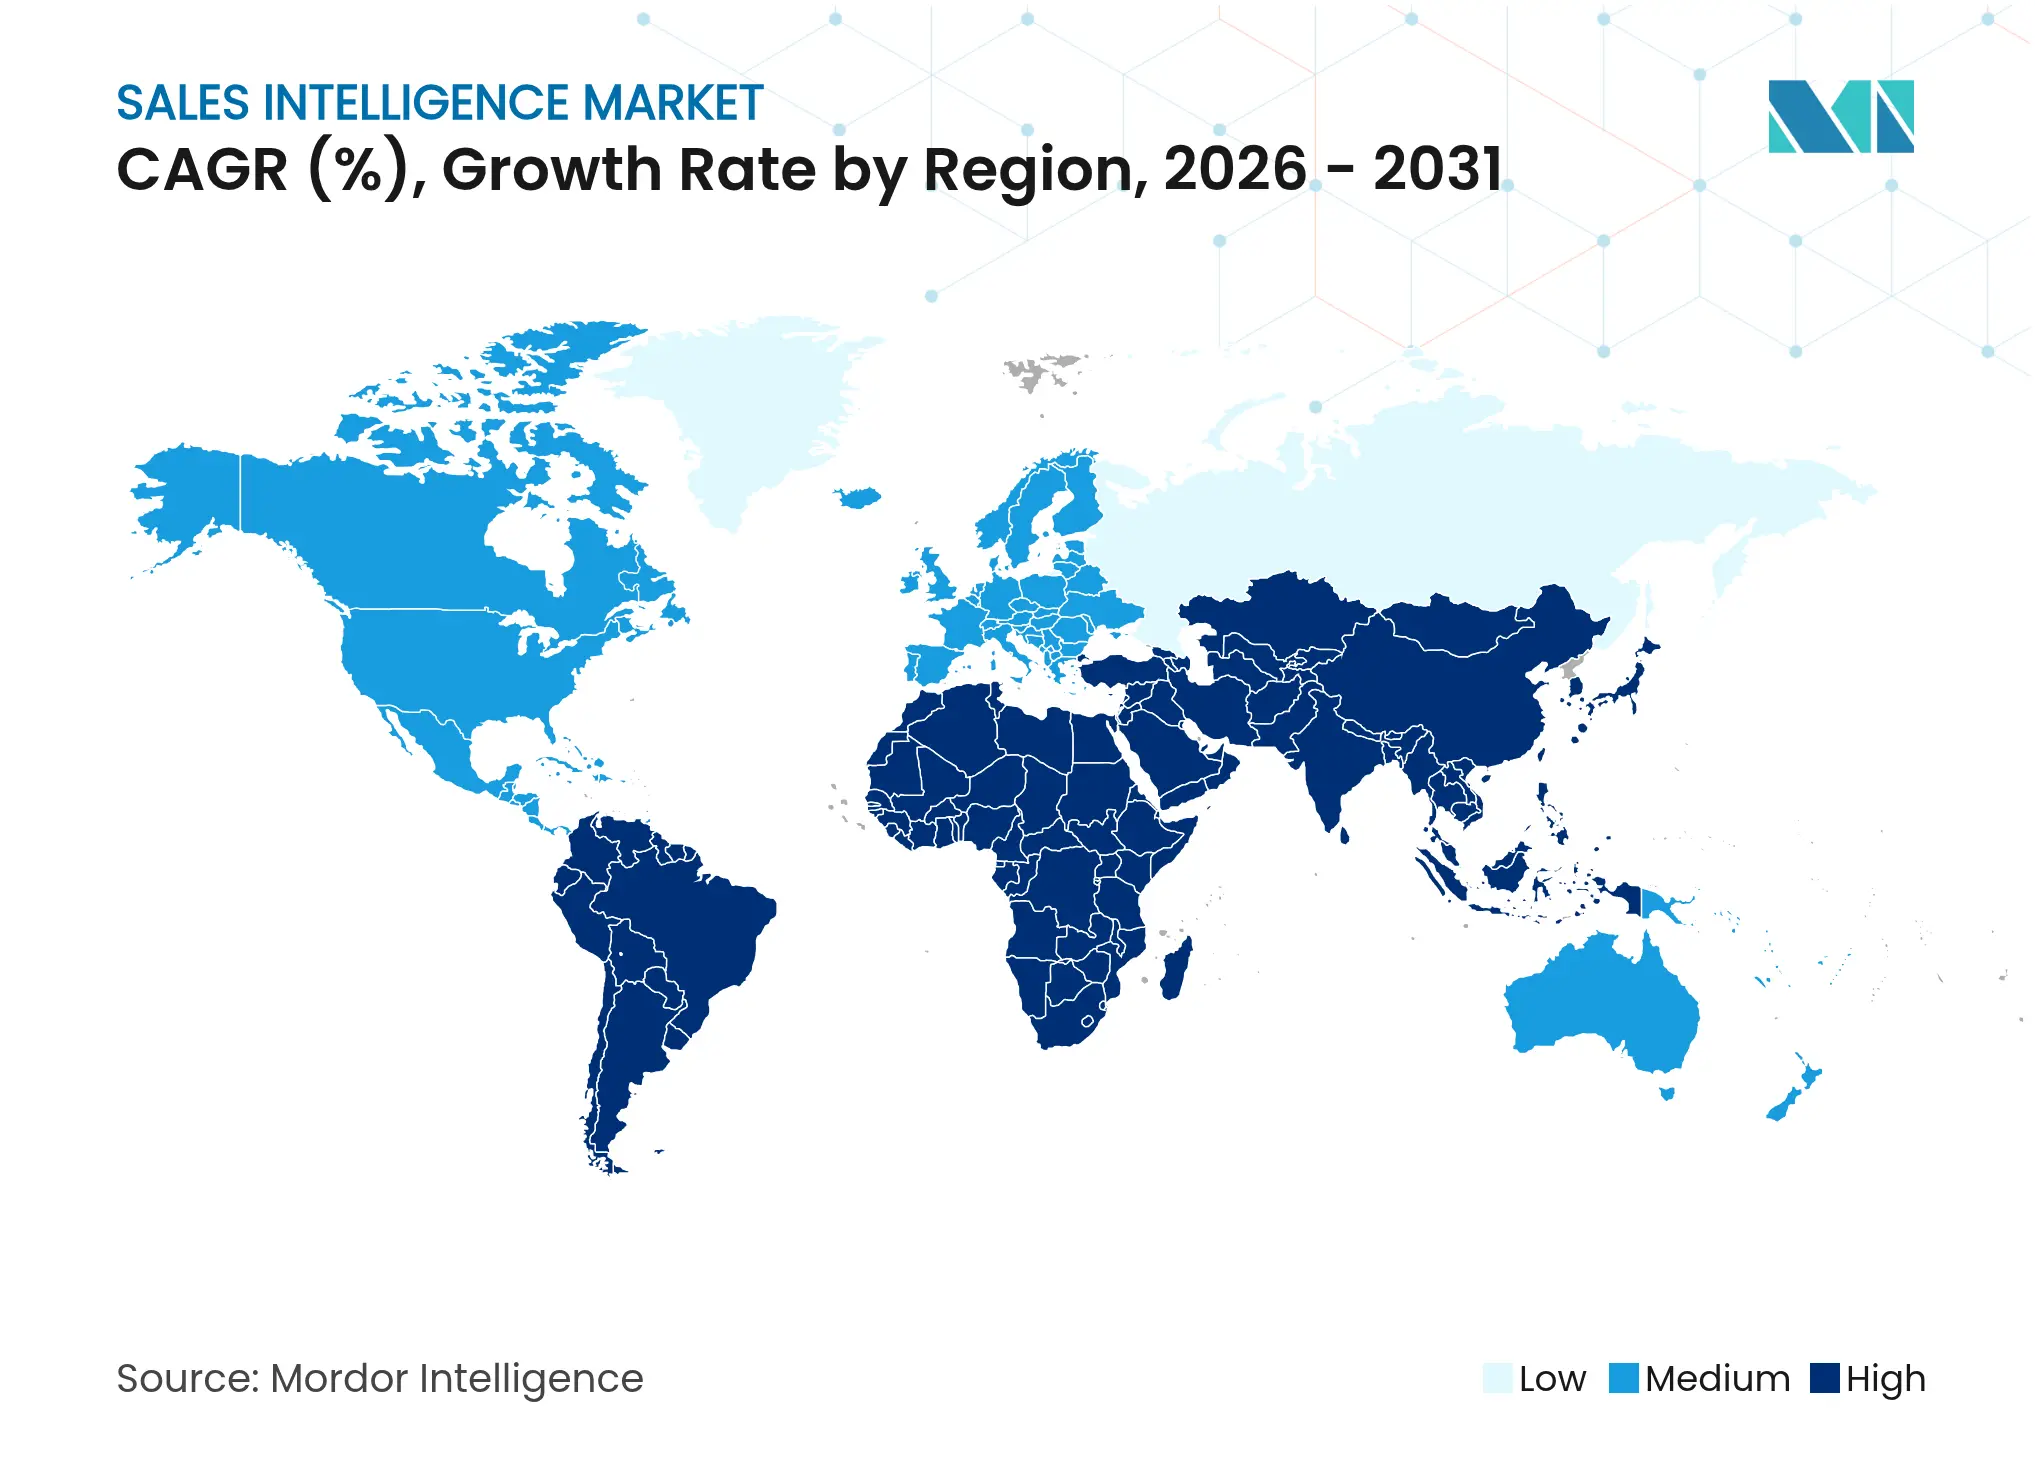
North America delivered 40.40% of 2025 revenue thanks to mature CRM ecosystems, robust venture investment, and a uniform interpretation of CCPA provisions that standardizes compliance workflows . Regional players such as ZoomInfo continuously enrich their domestic datasets, providing unmatched coverage depth that magnifies model accuracy . Government procurement modernization also feeds demand as federal agencies upgrade outreach analytics to improve supplier diversity. Cross-border data transfers into Canada proceed under PIPEDA frameworks, while Mexican adopters lean on US cloud zones but increasingly insist on in-country disaster-recovery nodes.
Asia-Pacific is the fastest growing region at 14.86% CAGR, spearheaded by digitally native firms in India, China, and Southeast Asia that bypass legacy on-premises CRM. These buyers favor cloud-first architectures, micro-transaction billing, and AI modules localized for multibyte character sets. Japan and South Korea prioritize language accuracy, pushing vendors to expand model-training corpora. Australia and New Zealand mirror North American best practices yet enforce stricter breach-notification statutes, necessitating detailed audit trails inside the sales intelligence market. Regional innovation clusters in Singapore and Bangalore spawn numerous white-label data pipelines, broadening intent-signal coverage.
Europe remains privacy-centric, with GDPR principles shaping platform road-maps that emphasize consent orchestration, data minimization, and sovereign cloud options. Germany and France require explicit purpose statements before processing contact records, influencing product-design choices such as field-level encryption and revocable payloads. The United Kingdom adopts a risk-based approach under the UK GDPR, allowing slightly more flexibility for legitimate-interest processing as long as impact assessments remain updated. Eastern Europe is slower to adopt fully automated enrichment due to macro-economic volatility and local hosting mandates, yet growth potential persists as EU funding programs accelerate digital-skills upskilling.
Market Concentration
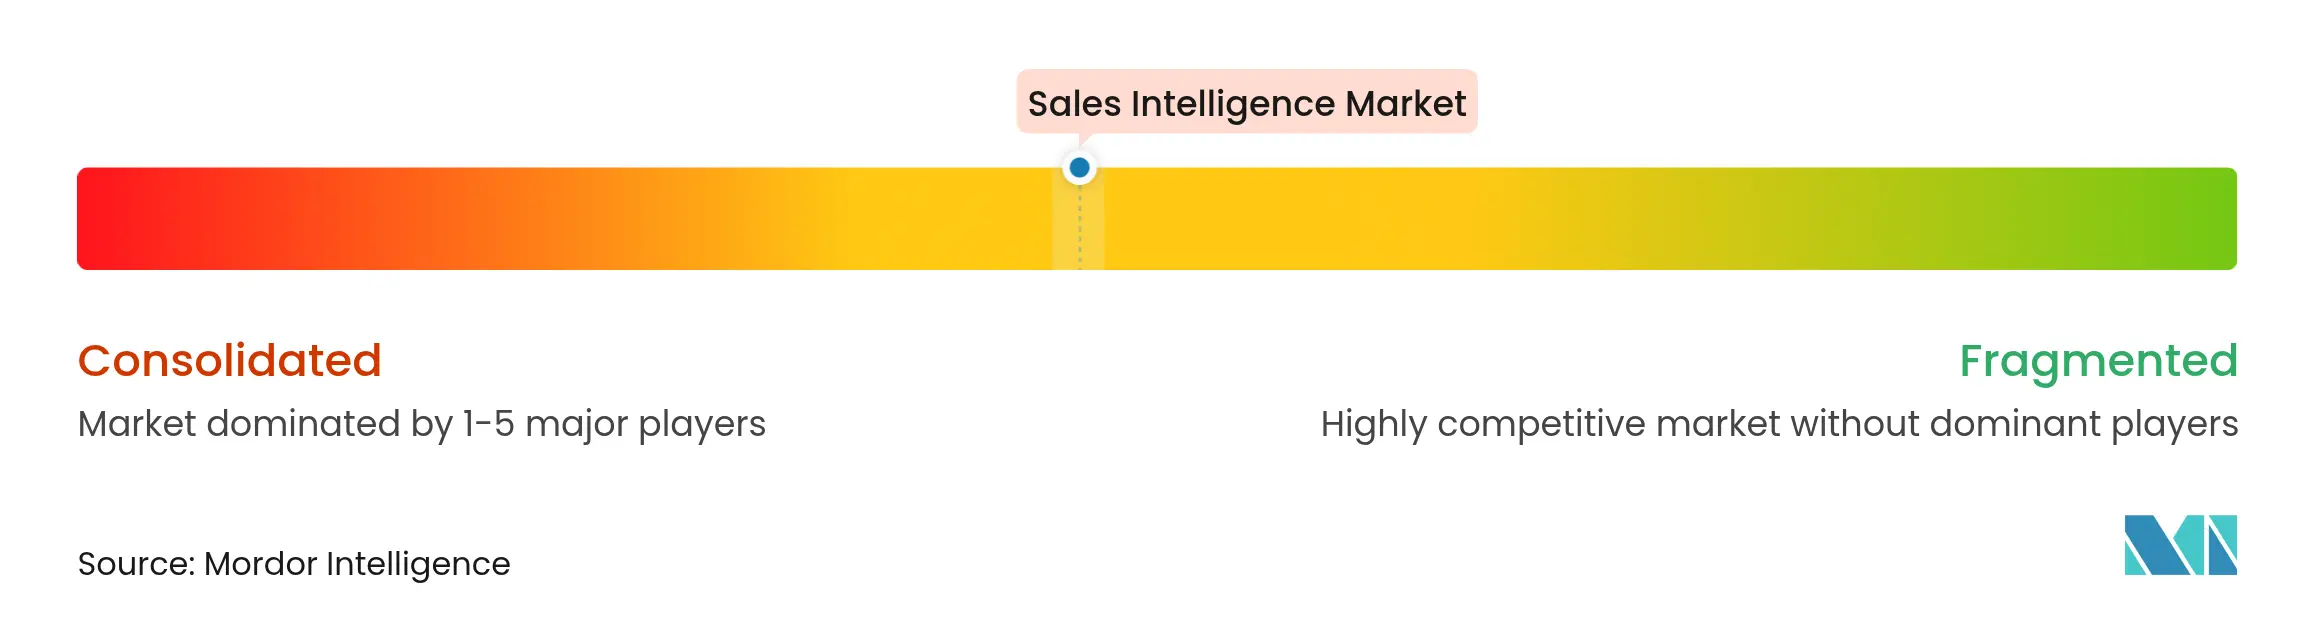
The sales intelligence market displays moderate concentration, with established data aggregators defending share through scale and newer AI-native challengers differentiating via real-time enrichment speeds. Salesloft’s plan to integrate Drift illustrates a consolidation wave in which adjacent-workflow providers fuse to create “revenue orchestration” suites that promise single-pane management across prospecting, engagement, and post-sale expansion warmly. Microsoft leverages its LinkedIn data graph to embed natively within Dynamics 365, using proprietary access privileges to sustain a formidable moat.
White-space opens for vertical specialists that curate niche taxonomies, as well as for privacy-preserving synthetic-data generators that sidestep consent-management overhead. Consumption-billing specialists further unsettle incumbents by matching vendor revenue with measurable customer outcomes. The arms race now pivots on feature velocity, integration depth, and transparency in model reasoning rather than pure data volume. Providers that furnish lineage tracking, bias detection, and prompt-level customization gain regulatory credibility and shorten procurement cycles.
Further, go-to-market teams judge suppliers on deployment friction; hence intuitive UX and low-code connectors differentiate as much as data breadth. Sustained RandD investment remains essential because large-language-model benchmarks evolve monthly. Incumbents hedge by opening venture arms and purchasing challenger tools at early revenue thresholds to absorb novel capabilities. Customers benefit from richer ecosystems but must weigh lock-in risk as suites expand and renegotiation leverage declines.

*Disclaimer: Major Players sorted in no particular order
1. INTRODUCTION
2. RESEARCH METHODOLOGY
3. EXECUTIVE SUMMARY
4. MARKET LANDSCAPE
5. MARKET SIZE AND GROWTH FORECASTS (VALUE)
6. COMPETITIVE LANDSCAPE
7. MARKET OPPORTUNITIES AND FUTURE TRENDS
Market Definitions and Key Coverage
Segmentation Overview
Detailed Research Methodology and Data Validation
Primary Research
Desk Research
Market-Sizing and Forecasting
Data Validation and Update Cycle
Why Mordor's Sales Intelligence Baseline Underpins Reliable Planning
Benchmark comparison
| Market Size | Anonymized source | Primary gap driver | ||
|---|---|---|---|---|
USD 4.42 B (2025) | Mordor Intelligence | - | Anonymized source:Mordor Intelligence | Primary gap driver:- |
USD 4.40 B (2024) | Regional Consultancy A | Counts core software only and relies on vendor self-reports; update every 18 months | ||
USD 3.31 B (2024) | Global Consultancy B | Narrows scope to large-enterprise licenses and folds intent data into BI market; limited primary validation | ||
USD 3.26 B (2023) | Trade Journal C | Omits enrichment APIs and assumes uniform ASP decline post-2022 |
Pricing Strategy for Semiconductor Components
3 Min Read
Accelerating Additive Manufacturing Adoption in India
3 Min Read
A Leading Sanitaryware Company’s Journey in Saudi Arabia
4 Min Read
When decisions matter, industry leaders turn to our analysts. Let’s talk.