Market Overview
| Study Period | 2020 - 2031 |
|---|---|
| Market Size (2026) | USD 6.88 Billion |
| Market Size (2031) | USD 8.44 Billion |
| Growth Rate (2026 - 2031) | 4.18% CAGR |
| Fastest Growing Market | North America |
| Largest Market | Asia Pacific |
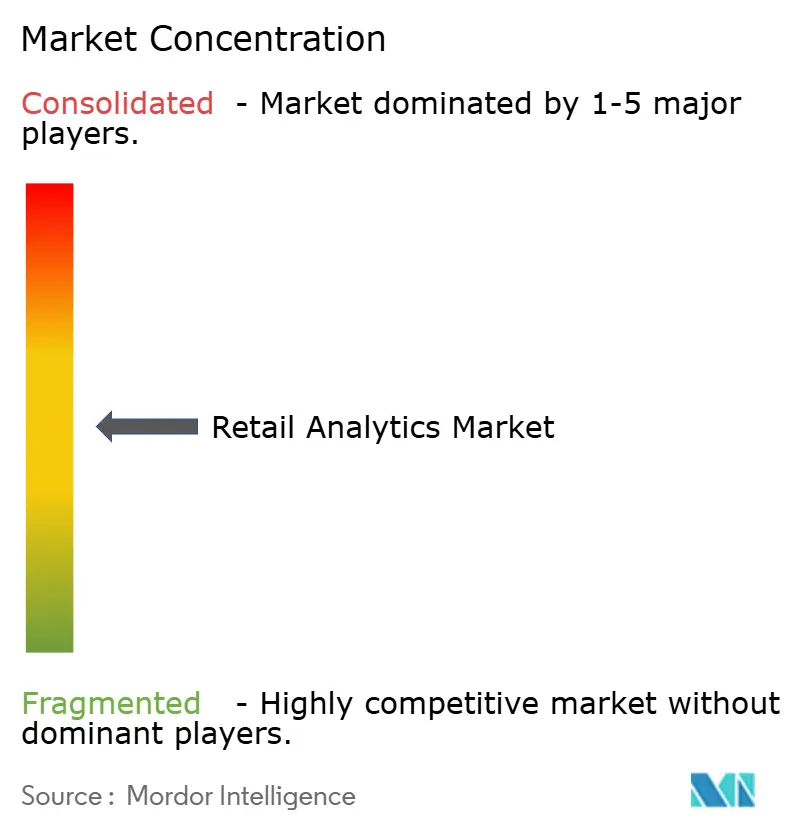
| Market Concentration | Medium |
Major Players
*Disclaimer: Major Players sorted in no particular order Image © Mordor Intelligence. Reuse requires attribution under CC BY 4.0. |
|
Retail Analytics Market Analysis by Mordor Intelligence
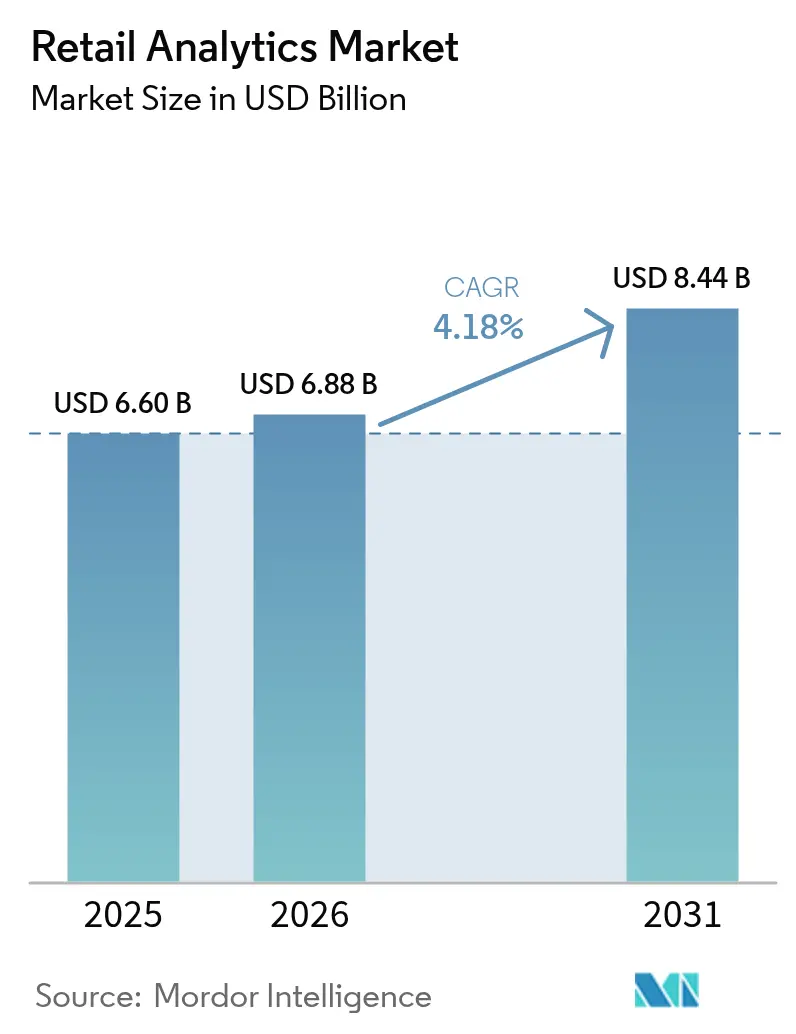
The retail analytics market size in 2026 is estimated at USD 6.88 billion, growing from 2025 value of USD 6.60 billion with 2031 projections showing USD 8.44 billion, growing at 4.18% CAGR over 2026-2031. Broader omnichannel commerce, surging data volumes, and rapid adoption of AI-driven decision engines are encouraging retailers to embed analytics into day-to-day processes. Cloud delivery models are cutting ownership costs and trimming deployment cycles, which allows mid-tier chains to access capabilities once limited to global leaders. Real-time personalization, prescriptive inventory tools, and advanced promotion optimisation are lifting conversion rates and order profitability even as margins tighten. Competitive advantage is shifting toward platforms that integrate predictive, prescriptive, and generative capabilities, signaling that analytics has moved from a discretionary spend to a fundamental retail requirement. [1]Adobe Staff, “Adobe 2025 AI and Digital Trends Report,” Adobe, adobe.com
Key Report Takeaways
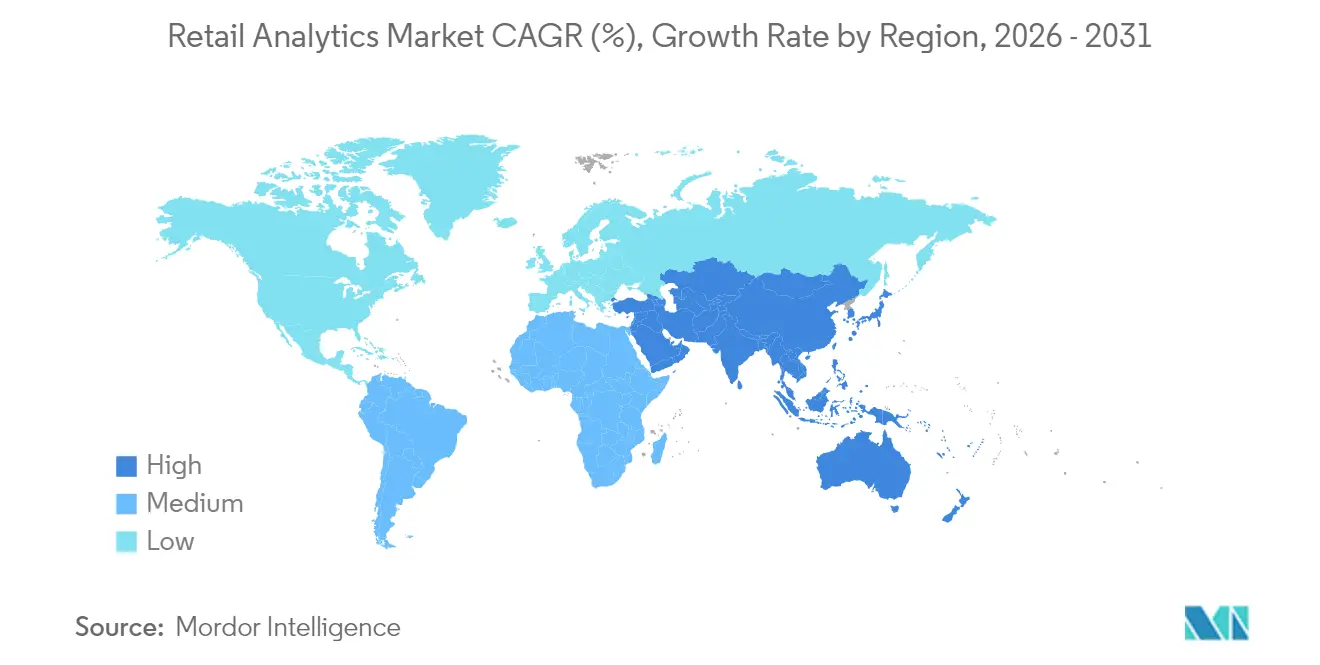
- By geography, North America held 38.05% of revenue in 2025, while Asia-Pacific is forecast to record the fastest expansion at a 6.09% CAGR through 2031.
- By solution, software commanded 72.40% of expenditure in 2025; services represent the quickest growth path with a 7.45% CAGR to 2031.
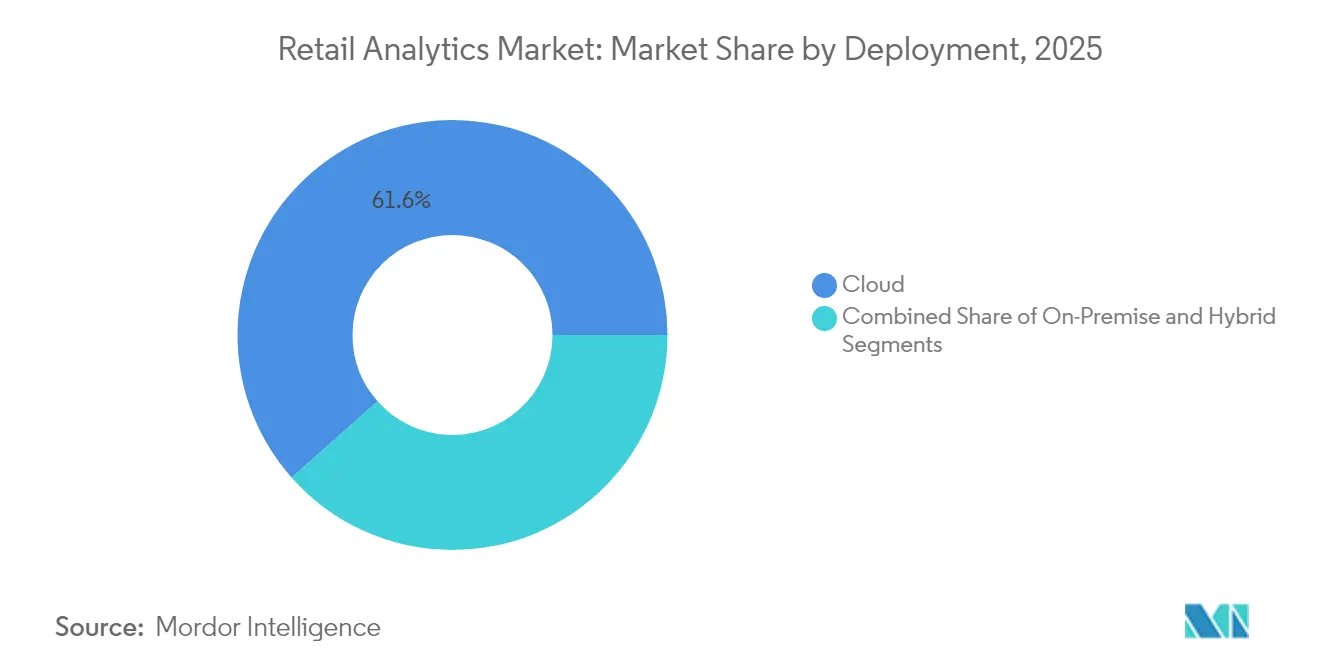
- By deployment, cloud implementations accounted for 61.55% of activity in 2025 and are expected to rise at a 9.22% CAGR over the outlook.
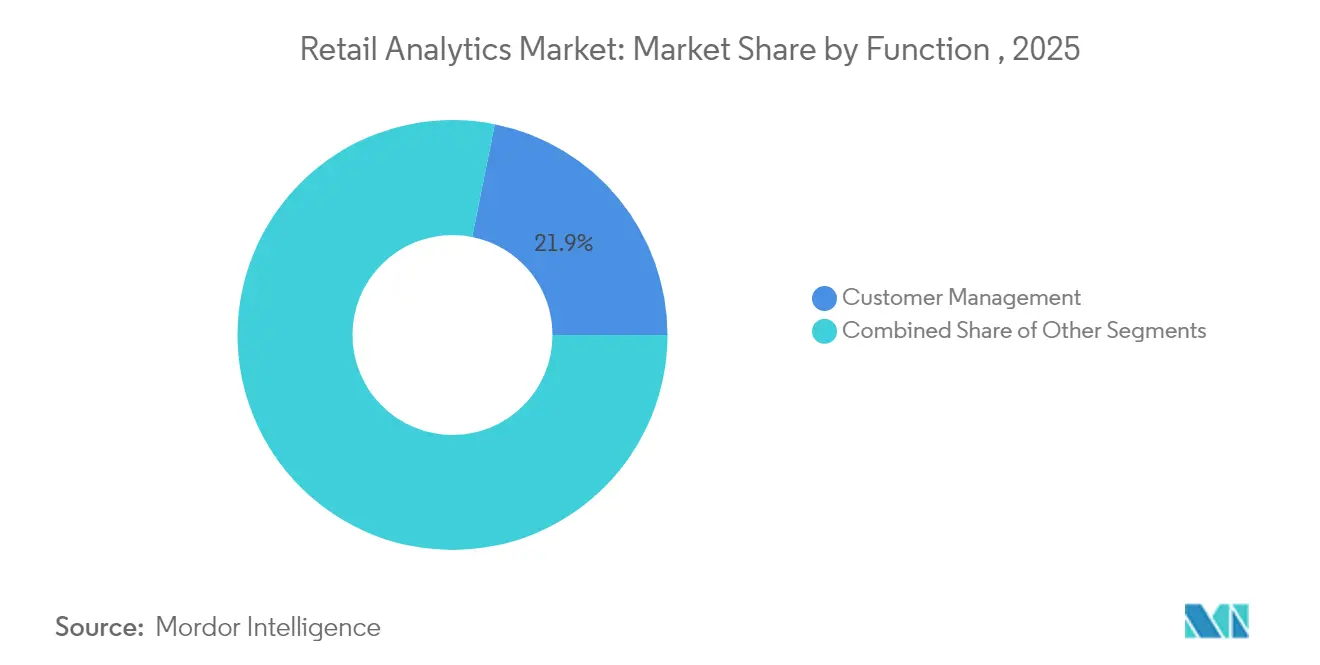
- By function, customer management analytics captured a 21.85% slice in 2025, whereas marketing and merchandising analytics are on course for the sharpest lift at an 7.86% CAGR.
- By retail format, pure-play e-commerce operators led with 59.30% penetration in 2025 and should continue to outpace others at a 8.85% CAGR to 2031.
Note: Market size and forecast figures in this report are generated using Mordor Intelligence’s proprietary estimation framework, updated with the latest available data and insights as of 2026.
Global Retail Analytics Market Trends and Insights
Drivers Impact Analysis*
| Driver | (~) % Impact on CAGR Forecast | Geographic Relevance | Impact Timeline |
|---|---|---|---|
| Omnichannel data-volume explosion | +1.2% | Global; highest in North America and Europe | Medium term (2-4 years) |
| AI/ML advances for real-time prescriptive insights | +1.0% | North America, Europe, advanced Asia-Pacific markets | Long term (≥ 4 years) |
| Uptake of cloud analytics lowering ownership costs | +0.9% | Global; early adoption in North America | Short term (≤ 2 years) |
| Demand for hyper-personalised shopping journeys | +0.8% | North America, Europe, urban Asia-Pacific centres | Medium term (2-4 years) |
| Source: Mordor Intelligence | |||
Omnichannel data-volume explosion
Retailers now ingest vast pools of transaction, behavioural, and social signals that dwarf prior years and mandate scalable analytics platforms. The pace of data growth is prompting investments in unified data lakes that consolidate store, e-commerce, and third-party feeds to support near real-time reporting. Operators that master rapid pattern recognition improve pricing agility, sharpen demand forecasts, and raise inventory turns, which collectively push gross-margin lift. Managing this surge also accelerates cloud demand because elastic infrastructure prevents performance bottlenecks during peak events. Consequently, analytic maturity becomes a barometer for commercial resilience.
AI/ML advances enabling real-time prescriptive insights
Machine-learning-powered demand sensing is reducing supply-chain errors and missed sales opportunities, while computer vision applications extend intelligence to the sales floor. Retailers that embed AI into recommendation engines capture new cross-sell revenue streams and improve lifetime customer value as output moves from descriptive dashboards to automated decisions. Multimodal models that blend language, vision, and structured data produce unified intelligence layers that break down functional silos. These shifts are redefining the talent profiles retailers seek and are reshaping vendor selection criteria, with emphasis now on pre-built, explainable models.
Uptake of cloud analytics lowering TCO
Subscription-based pricing aligns costs with usage and allows seasonal traders to flex capacity without over-investing in under-utilised hardware. Continuous software updates remove the need for disruptive upgrade projects so that retailers can adopt new features such as generative AI faster. Cloud ecosystems improve data-sharing across partners, which supports collaborative forecasting and vendor-managed inventory programs. In addition, built-in security and compliance tooling eases the burden of emerging privacy mandates, which is central for global retailers balancing multiple jurisdictions.
Demand for hyper-personalised shopping journeys
Consumers expect brands to anticipate intent in real time, leading retailers to orchestrate one-to-one experiences across channels. Unified customer profiles fuel marketing, merchandising, and product development decisions that create consistent journeys from discovery through fulfilment. Integrating contextual signals such as location and weather fine-tunes engagement, raising basket size, and reducing churn. Personalisation also guides assortment curation, enabling targeted markdowns that protect margins. The trend reinforces the strategic link between robust customer data architectures and revenue growth.
Restraints Impact Analysis*
| Restraint | (~) % Impact on CAGR Forecast | Geographic Relevance | Impact Timeline |
|---|---|---|---|
| Data-privacy regulation and compliance costs | -0.7% | Europe, North America; expanding globally | Medium term (2-4 years) |
| Legacy IT stacks and analytics skills gap | -0.6% | Global; heavier in emerging markets | Short term (≤ 2 years) |
| Source: Mordor Intelligence | |||
Data-privacy regulation and compliance costs
Tightening privacy laws such as GDPR and CCPA compel retailers to re-engineer data pipelines to uphold consent and minimisation rules. Modernisation budgets now allocate growing shares to security tooling that encrypts and governs sensitive information, diverting funds from analytics innovation. Cross-border retailers face complex compliance matrices that elongate deployment cycles for global rollouts. Privacy-by-design frameworks help reduce regulatory exposure but also limit data granularity, which may curb the scope of advanced analytics in high-stringency markets. The interplay between protection mandates and analytics ambitions, therefore, remains a key strategic balancing act. [2]RIB Software, "Top 10 Analytics & Business Intelligence Trends For 2025," RIB Software, December 23, 2024, rib-software.com.
Legacy IT stacks and analytics skills gap
Many longstanding chains operate fragmented point-of-sale, inventory, and loyalty systems that resist seamless data exchange, which delays advanced analytics projects. Integrating modern cloud platforms with on-premises systems often extends timelines and inflates costs. Compounding technical debt is a shortage of personnel who can bridge strategy, data engineering, and data science competencies. Scarce talent raises wage pressure and can slow the rollout of sophisticated use cases such as autonomous pricing or computer-vision-based shelf analytics. Retailers are mitigating risk with low-code tools and managed services, yet the constraint remains a drag on adoption speed.
*Our forecasts treat driver/restraint impacts as directional, not additive. The impact forecasts reflect baseline growth, mix effects, and variable interactions.
Segment Analysis
By Deployment: Cloud Gains Momentum While Hybrid Models Mature
Cloud deployments captured 61.55% of projects in 2025 and will grow at a 9.22% CAGR to 2031. Subscription pricing minimises capital commitments, and elastic compute equips retailers to handle promotional peaks without performance dips. Although some chains retain sensitive data on-site to satisfy sovereignty and latency requirements, hybrid architectures that blend local data storage with cloud compute are emerging as a strategic middle ground. These hybrid designs reduce round-trip times for mission-critical workloads such as fraud detection while leveraging cloud economics for analytics model training. As a result, deployment choices increasingly hinge on workload characteristics rather than a blanket cloud-first or on-premises stance.


By Retail Format: E-commerce Players Set the Pace
Pure-play e-commerce retailers captured 59.30% of deployments in 2025 and will continue to outgrow other formats at a 8.85% CAGR. Their digital-native architectures enable rapid adoption of predictive models without legacy integration hurdles, allowing them to refine experiences at every click. Brick-and-mortar operators are bridging the data gap by adding sensors, RFID, and computer vision to convert in-store behaviour into actionable data. Omnichannel chains adopt unified commerce analytics that merge online and store insights to improve cross-channel stock allocation and fulfilment routing. These varied priorities illustrate that business model dictates analytics roadmaps, yet all formats converge on the need for faster, more granular insights.
By Function: Customer Management Leads; Marketing Accelerates
Customer-management analytics held 21.85% of the 2025 total as brands focus on acquisition efficiency, conversion optimisation, and lifetime-value expansion. Unified data platforms feed cross-channel engagement engines that personalise offers and content. Marketing and merchandising analytics are projected to advance at an 7.86% CAGR through 2031, powered by dynamic pricing and AI-driven promotion algorithms that react to real-time demand signals. Inventory and supply-chain-oriented analytics also gain relevance as companies use prescriptive insights to align stock with omnichannel orders. Consequently, decision-support tools are moving beyond siloed departmental deployments toward enterprise-wide intelligence layers that align planning, merchandising, and fulfilment.
By Solution: Software Dominates Despite Services Growth
Software platforms accounted for 72.40% of 2025 spending, underscoring a preference for scalable engines that support multiple retail functions without a linear cost increase. Vendors embed AI modules for customer segmentation, demand forecasting, and price optimisation, which strengthens software’s appeal. The services sub-segment is expanding at a 7.45% CAGR as retailers acknowledge that algorithms alone cannot unlock full value without domain expertise. Managed analytics, implementation consulting, and model-governance support now command a larger slice of project budgets. Retailers adopting outcome-based services report faster time-to-value because partners tailor insights to business objectives rather than generic dashboards.
Geography Analysis
North America led the retail analytics market with 38.05% revenue share in 2025, supported by robust cloud infrastructure, deep e-commerce penetration, and proximity to leading analytics vendors. United States retailers plan to raise technology budgets in 2025, directing the largest allocations to customer-data platforms and AI-based decision engines. Canada trails slightly yet invests heavily in customer analytics to differentiate in a mature market, while Mexico emphasises supply-chain optimisation to address logistics volatility.
Asia-Pacific is set to post the fastest CAGR at 6.09% through 2031, propelled by explosive e-commerce growth, increasing smartphone adoption, and ambitious digital transformation programs. China pioneers social-commerce analytics that integrate payment, delivery, and community engagement data, producing end-to-end insight loops. India’s diverse consumer landscape encourages retailers to deploy predictive models that tailor assortments across urban and rural zones. Japan and South Korea emphasise store-centric analytics such as computer-vision footfall measurement to revitalise physical outlets. Europe retains a meaningful footprint anchored by sophisticated retail systems in the United Kingdom, Germany, and France. Stringent privacy rules drive adoption of hybrid deployments that balance data residency with cloud scalability. Sustainability analytics is gaining traction as retailers use environmental metrics to guide sourcing and packaging decisions. Latin American growth concentrates in Brazil and Argentina, where analytics helps manage currency volatility and optimise localised promotions. Middle East and Africa remain smaller but active in markets such as Israel and the United Arab Emirates, where luxury retail and tourism accelerate the adoption of customer experience analytics.

Competitive Landscape
The retail analytics market shows moderate concentration. Enterprise software providers such as SAP, IBM, Oracle, and Microsoft leverage entrenched ERP and cloud relationships to cross-sell analytics modules that span planning, merchandising, and fulfilment. Retail-specialist vendors, including Blue Yonder, RetailNext, and Dunnhumby, compete with deeper functional playbooks that address pricing, shelf optimisation, and customer journey mapping. Cloud hyperscalers Amazon Web Services and Google package native BI tools with their infrastructure, raising price-performance pressure on independent platforms.
Competitive strategies show a split between all-in-one suites and best-of-breed components. Large chains favour integrated platforms to reduce vendor complexity, while mid-size retailers adopt modular tools for rapid returns. AI infusion is now a baseline expectation. Vendors embed natural-language querying, automated anomaly detection, and scenario modelling that convert raw data into recommended actions, supporting labour productivity gains across merchandising and marketing. Start-ups that specialise in unified commerce analytics, real-time store monitoring, or assortment localisation are securing footholds by addressing pain points left open by broader suites. Consolidation is likely as incumbents acquire niche players to fill capability gaps.
Regulatory compliance and data sovereignty add a layer of differentiation, as vendors that offer pre-configured privacy controls appeal to European and multinational chains. Open platform architectures that integrate first-party data with third-party feeds are also valued because they permit retailers to extend analytics models without extensive coding. These trends collectively indicate that vendor selection hinges not only on technical features but also on the ability to deliver rapid, measurable business outcomes.
Retail Analytics Industry Leaders
-
SAP SE
-
IBM Corp.
-
Oracle Corp.
-
Salesforce (Tableau)
-
SAS Institute
- *Disclaimer: Major Players sorted in no particular order

Recent Industry Developments
- May 2025: Salesforce acquired PredictSpring for USD 580 million to strengthen omnichannel engagement analytics.
- April 2025: Oracle launched “Xstore Factor,” adding real-time AI prediction to its retail cloud suite.
- March 2025: IBM reorganised revenue categories to align data security with analytics offerings for retail clients.
- February 2025: ThoughtSpot introduced a sentiment-analysis module that mines customer feedback across channels in real time.


Research Methodology Framework and Report Scope
Market Definitions and Key Coverage
According to Mordor Intelligence, the retail analytics market covers software and service tools that collect, integrate, and analyze data on sales, inventory, shopper behavior, pricing, and supply-chain events across physical stores, pure-play e-commerce, and omnichannel settings. The study values only packaged solutions sold or subscribed by retailers, not custom in-house builds or broader enterprise data platforms.
Scope exclusion: pure social-media listening tools without retail conversion insight fall outside this remit.
Segmentation Overview
-
By Solution
- Software
- Services
-
By Deployment Model
- Cloud
- On-premise
- Hybrid
-
By Function
- Customer Management
- In-store Operation - Inventory Management
- In-store Operation - Performance Management
- Supply Chain Management
- Marketing and Merchandising - Pricing/Yield
- Other Functions - Transportation Management
- Other Functions - Order Management
-
By Retail Format
- Brick-and-Mortar Stores
- Pure-play E-commerce
- Omnichannel Retailers
-
By Geography
-
North America
- United States
- Canada
- Mexico
-
Europe
- United Kingdom
- Germany
- France
- Italy
- Rest of Europe
-
Asia-Pacific
- China
- Japan
- India
- South Korea
- Rest of Asia-Pacific
-
Middle East
- Israel
- Saudi Arabia
- United Arab Emirates
- Turkey
- Rest of Middle East
-
Africa
- South Africa
- Egypt
- Rest of Africa
-
South America
- Brazil
- Argentina
- Rest of South America
-
North America
Detailed Research Methodology and Data Validation
Primary Research
Mordor analysts interview solution vendors, Tier-1 retailers, regional buying groups, and cloud-service integrators across North America, Europe, Asia-Pacific, and the Middle East. These discussions validate typical license fees, deployment timelines, adoption triggers, and the pace at which merchants shift from legacy POS to analytics-ready platforms, thereby refining volume and price assumptions.
Desk Research
Our desk effort begins with reputable, non-paywalled statistics such as the US Census Monthly Retail Trade survey, Eurostat Retail Trade Index, the National Retail Federation's sales tracker, Bank of England card-spend dashboards, and customs shipment data aggregated through Volza. These series anchor baseline sales pools, store counts, and cross-border flows. We then layer insights from company 10-Ks, retailer investor decks, patent filings accessed via Questel, and trade journals that track AI use cases in stores. D&B Hoovers and Dow Jones Factiva provide revenue splits that help approximate software spending ratios. The sources cited above illustrate, not exhaust, the wide body of secondary material reviewed.
Market-Sizing & Forecasting
A top-down model builds retail analytics spend as a share of total IT budgets, which are reconstructed from national retail sales, store footprints, and average transaction values. Results are cross-checked through selective bottom-up views using sampled annual contract value multiplied by active installations in key regions. Inputs that move the dial include cloud subscription penetration, omnichannel order volumes, average basket size, store footfall sensor density, and AI-driven campaign frequency. Forecasts employ a multivariate regression that links software uptake with drivers such as e-commerce sales growth, smartphone penetration, and regulatory data-privacy milestones. Where bottom-up estimates miss niche geographies, benchmark ratios from comparable markets are applied, then validated during follow-up calls.
Data Validation & Update Cycle
Each draft passes anomaly checks, scenario stress tests, and a peer review before sign-off. We refresh figures annually, with interim updates triggered by material events like major vendor acquisitions or steep currency moves, ensuring clients receive the latest calibrated view.
Why Mordor's Retail Analytics Baseline Commands Reliability
Published market values often diverge because firms pick different functional scopes, price stacks, and refresh cadences. Our disciplined lens, confined to packaged analytics solutions and guided by annually audited variables, trims noise from overlapping data-analytics categories.
Key gap drivers include wider scope coverage by others (for example, bundling generic data lakes), aggressive SaaS price inflation assumptions, and less frequent currency conversions that ignore recent retail IT spending swings.
Benchmark comparison
| Market Size | Anonymized source | Primary gap driver |
|---|---|---|
| USD 6.32 B | Mordor Intelligence | |
| USD 8.75 B | Global Consultancy A | Includes broader BI platforms and predictive CRM suites |
| USD 8.90 B | Industry Association B | Uses vendor revenue reported at list price, not realized billing |
| USD 8.50 B | Regional Consultancy C | Applies uniform 20% annual price uplift without regional splits |
The comparison shows that once scope creep and pricing inflation are filtered out, Mordor's moderated baseline offers a transparent, repeatable starting point for strategy teams that need dependable numbers today.


Key Questions Answered in the Report
How big is the Retail Analytics Market?
The Retail Analytics Market size is expected to reach USD 6.88 billion in 2026 and grow at a CAGR of 4.18% to reach USD 8.44 billion by 2031.
Who are the key players in Retail Analytics Market?
IBM Corporation, Oracle Corporation, SAP SE, SAS Institute Inc. and Salesforce.com Inc. (Tableau Software Inc.) are the major companies operating in the Retail Analytics Market.
Which is the fastest growing region in Retail Analytics Market?
Asia-Pacific is estimated to grow at the highest CAGR over the forecast period (2026-2031).
Which region has the biggest share in Retail Analytics Market?
In 2026, the North America accounts for the largest market share in Retail Analytics Market.
What years does this Retail Analytics Market cover, and what was the market size in 2025?
In 2025, the Retail Analytics Market size was estimated at USD 6.88 billion. The report covers the Retail Analytics Market historical market size for years: 2019, 2020, 2021, 2022, 2023 and 2024. The report also forecasts the Retail Analytics Market size for years: 2026, 2027, 2028, 2029, 2030 and 2031.
What is the fastest-growing functional segment within retail analytics?
Marketing and merchandising analytics is forecast to increase at an 7.86% CAGR through 2031.
Which retail format invests most heavily in analytics?
Pure-play e-commerce retailers hold 59.30% of usage and are converting data advantages into a 8.85% growth pace through 2031
Page last updated on:


